
 Open Access Article
 This Open Access Article is licensed under a Creative Commons Attribution-Non Commercial 3.0 Unported Licence
Spectral watermarking in femtosecond stimulated Raman spectroscopy: resolving the nature of the carotenoid S* state†
Miroslav
Kloz
*ab,
Jörn
Weißenborn
a,
Tomáš
Polívka
c,
Harry A.
Frank
d and
John T. M.
Kennis
a
aDepartment of Physics and Astronomy, VU University Amsterdam, De Boelelaan 1081, 1081HV Amsterdam, The Netherlands. E-mail: miroslav.kloz@eli-beams.eu
bELI-Beamlines, Institute of Physics, Na Slovance 2, 182 21 Praha 8, Czech Republic
cUniversity of South Bohemia, Branišovská 1645/31a, 370 05 České Budějovice, Czech Republic
dDepartment of Chemistry, University of Connecticut, 55 North Eagleville Road, Storrs, CT 06269, USA
First published on 29th April 2016
Abstract
A new method for recording femtosecond stimulated Raman spectra was developed that dramatically improves and automatizes baseline problems. Instead of using a narrowband Raman source, the experiment is performed using shaping of a broadband source. This allows locking the signal into carefully crafted watermarks that can be recovered from measured data with high fidelity. The approach uses unique properties of Raman scattering, thus allowing a direct recording of stimulated Raman signals with robust rejection of baselines and fixed-pattern-noise. Low cost technology for generating required pulse-shapes was developed and demonstrated. The methodology is applicable to any Raman experiment but primarily targets Femtosecond Stimulated Raman spectroscopy (FSRS) where a lack of robust methods for parasitic signal rejection has been a major obstacle in the practical development of the field in the last decade. The delivered improvement in FSRS experiments was demonstrated by recording evidence that the so-called S* state of carotenoids in solution corresponds to the optically forbidden S1 state of a sparsely populated carotenoid conformation.
Introduction
Raman spectroscopy is established as a valuable chemical probe with applications spanning from fundamental research through clinical use to industry. Its major advantages compared to complementary mid-infrared spectroscopy is a freedom in choice of the spectral range where the measurement is performed (spanning from X-ray,1,2 where the Raman effect can be used to study electronic transition, to IR3) and a relatively small Raman cross-section of water.4 That makes it a perfect probe for studying biological materials both in vitro and in vivo. Unfortunately, Raman spectroscopy suffers from notoriously weak signals that directly couple with serious baseline problems. Signal yields are typically so weak compared to input photon fluences that even the weakest fluorescence or elastic scattering often obstructs the desired signals. The advent of Stimulated Raman techniques (SRSs)5 brought new possibilities to Raman spectroscopy such as femtosecond time-resolved Raman experiments,6,7 but it did not solve the baseline problem. Unfortunately, time-resolved femtosecond stimulated Raman spectroscopy (FSRS) suffers from baseline problems that are comparable to or even worse than for spontaneous Raman experiments.8 In this paper we present a novel method for suppressing spurious signals in FSRS spectroscopy by a relatively simple shift in the experimental approach using a wavelength modulation technique combined with the theory of digital watermarking.9 Additional benefits compared to a traditional approach are the suppression of fixed pattern10 noise that allows recording a weaker signal. We demonstrate the power of the method by resolving the long-standing issue of the nature of the S* state in the open-chain carotenoid spirilloxanthin.Materials and methods
Experiments were performed on a set-up pumped using a femtosecond regenerative amplifier (Coherent Libra, 40 fs, 1 kHz). The output was split into two 1 mJ pulses and one weak 10 μJ pulse: the first 1 mJ pulse pumped an OPA generating tunable actinic pulse at 530 nm. The experiment was performed with 200 nJ of the actinic pump focused by a 20 cm lens. The second 1 mJ pulse pumped the Raman set-up described in greater detail in the ESI† (Fig. S8). The pulse shaper was constructed in a folded geometry based on a 1600 groves per mm compressor grating and a spherical mirror with a focal length of 50 cm. The Rayleigh length of nearly 6 mm allowed placing the modulator blade just in front of the back reflecting mirror that defines the folding plane of the shaper. Incoming and out-coming beams were separated by their vertical displacement. Such a shaper is low-cost in its construction and self-aligning. The average Rp pulse energy at the sample was 2 μJ after focusing with a 50 cm focal length lens. The 10 μJ pulse was focused into a sapphire plate to generate a broadband supercontinuum to generate a broadband pulse for probing. The residual fundamental pulse was removed using a notch filter to keep only 20 nJ of supercontinuum. The detection was based on a scientific camera system purchased from Entwicklungsbüro Stresing. It consists of a pair of scientific CCD cameras operating in the full vertical binning mode effectively functioning as a pair of linear image sensors operating at 1 kHz connected to spectrographs. The camera driver was connected to a large area photodiode that was read synchronously with the cameras. A photodiode signal was merged with the signal from the cameras so for each recorded spectral image the associated Rp pulse energy was known. This allowed the alignment of the data in order to construct the manifold of shifted signals needed for watermark processing. The system was controlled by home-built AurSir software that drove the measuring instruments and performed alignment and averaging of the raw data. All presented data are based on experiments in which 51 time delays were distributed logarithmically in time. Each time delay was based on 3 s of average (3000 collected shots in total) out of which 50% was used for collecting the pump–probe signal and 50% for the FSRS signal. Such an approach was repeated four times and the median value was taken for each delay to increase the fidelity of the kinetics. If we neglect the time consumed by motion of optical delay-lines, all data presented in this paper were collected in only 20 minutes of combined data acquisition time. Fig. S5A and B (ESI†) show a detailed arrangement of the experimental setup.Conceptual approach
Digital watermarking is a technique of inscribing a subtle signal (a watermark) on top of another typically much stronger signal such as music or video stream (carrier signal).9 The key problem is how to inscribe the watermark in such a way that it does not substantially obstruct the original signal, and at the same time it can be retrieved with high fidelity and independently of the carrier signal structure; ideally even sustain signal alteration during the transcription to various formats. This can be achieved by inscribing the watermark as pseudorandom wavelets. When data mixed with a watermark are convoluted with the model watermark, the position of the watermark is manifested as a sharp localized peak. In this way, data can be very easily tested for the presence/absence of the watermark. The reason is that only when the watermark in the signal and the convoluting model watermark are identical and precisely overlapped, they interfere in convolution fully constructively, while in other cases the result is simply a random number and typically very small in comparison to the resonant spike.The core of the technique relies on the principle that a very complex (rapidly oscillating) pseudorandom function with a vanishing integral (with a mean value close to or equal to zero) manifests a very low level of correlation with any normally encountered function, while being highly correlating with itself, but only in the case of perfect alignment. This allows recording and localizing a very weak watermark on top of a very strong carrier signal, and at the same time converting it into a sharp localized peak by a simple convolution procedure. The resonant spike is a direct product of the watermark amplitude and width, so even a very weak amplitude watermark can be detected given that it is inscribed within a sufficiently wide interval of data. Yet, the efficiency of a single watermark detection is still at a certain point limited by the watermark to carrier signal ratio, as the watermark can interfere with the carrier signal in an unpredictable way (Fig. 1A). A typical (continuous) baseline function has a very low level of correlation with a rapidly oscillating pseudorandom wavelet, however a certain correlation is in practice always present (i.e., a perfect non-correlation is equally improbable as a perfect correlation).
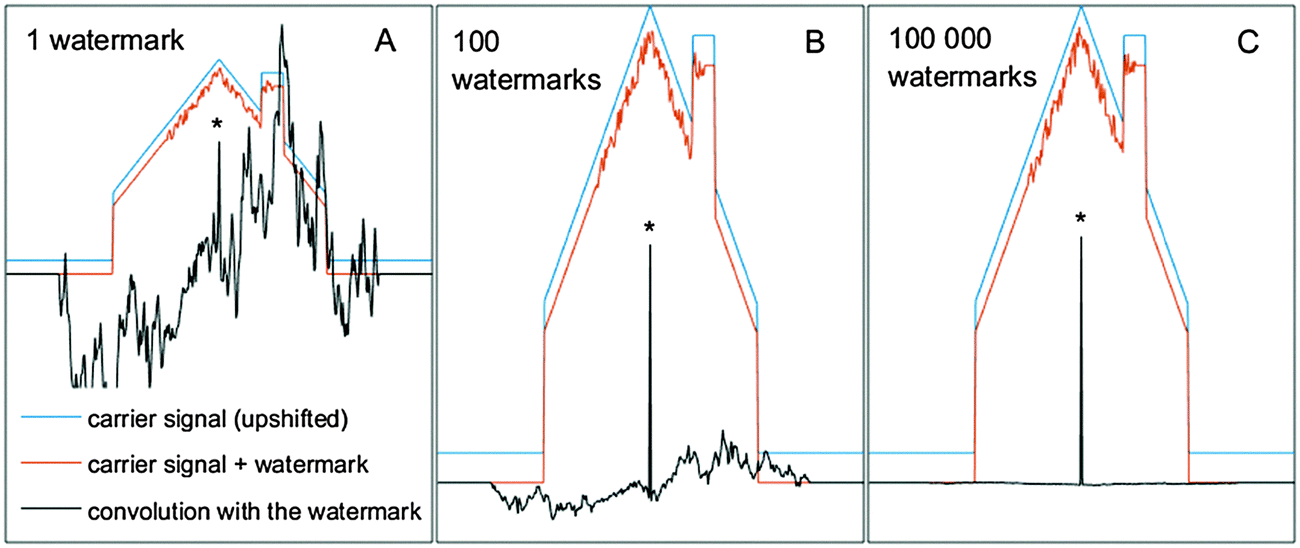 | ||
| Fig. 1 (A) A pseudorandom watermark of 100 pixels (noisy wiggles in the center of the red line) with intensity 50× weaker than the carrier signal (blue line for the carrier signal, red line for the carrier signal with the watermark inscribed) is manifested in the signal convoluted by the model watermark as a sharp peak (marked by the asterisk) but still on top of a substantial background. (B) When 100 different watermarks are repeatedly inscribed on the same carrier signal and the results of convolution averaged, the watermark location becomes distinct and the pseudorandom background weaker. (C) With a sufficient number of random watermarks the location is determined with 100% fidelity regardless of the carrier signal magnitude and structure. The model carrier signal and the carrier signal with an inscribed watermark are vertically offset for clarity. | ||
In Fig. 1A we can see that convolution of the signal (with an inscribed weak watermark) by the model watermark removes the carrier signal and produces a sharp peak in the center of the watermark location in the data. However, a substantial pseudorandom background around the peak still remains. This pseudorandom noise accompanying the resonant spike originates partly from the interaction between the watermark and the baseline function and partially from the interaction within the watermark itself, as explained below. The watermarking technique is based on statistics and so for a finite width of the watermark, it has only a finite performance. Any pseudorandom wavelet convolutes with an uncorrelated (baseline) function simply into another pseudorandom wavelet (as any function multiplied by a random function turns into a random function). The background is thus suppressed, but not entirely eliminated with the remaining offset turned into a random function. This holds also for the interaction of the watermark with itself in case it is not perfectly aligned. When two identical pseudorandom functions are aligned to each other they obviously perfectly correlate. In this case, their mutual product is a positive-only function and sums to a large positive number, and corresponds to the spike in the convoluted signal. However, their random structure causes that even the smallest mutual shift results in a complete loss of correlation with the level that any different pseudorandom function would manifest. In convolution, one basically performs a sliding scalar product of two vectors while filling zeros on the tail of the convoluting vectors to match the lengths for each shift. There is no correlation within the pseudorandom wavelet itself (that is basically a definition of a random function). The result is that when the watermark in the signal and the model convoluting watermark are just partially overlapped, it does not produce a zero but rather a random number of a magnitude equal to the average amplitude of the pseudorandom wavelet.
The interval where the wavelet in the signal and the model convoluting wavelet have at least partial overlap in convolution corresponds to twice the width of the wavelet and left and right part are mirror images (which does not become entirely clear from Fig. 1A because the interaction of the watermark with the strong carrier function dominates the convoluted signal). The reason is that head-to-tail correlation is identical to the tail-to-head correlation. The resonant spike (produced when the wavelet in the signal and the convoluting valet are perfectly aligned) is thus surrounded by a symmetric interval of a pseudorandom signal that has twice the width of the wavelet. It is shown clearly in Fig. S7 in the ESI† where the carrier signal is on purpose minimized. The pseudorandom tails of the resonant spike do not scale with the width of the watermark while the resonant spike does. They are thus less significant as the watermark gets wider, but never disappear for a single specific finite watermark. For example if the watermark consists of 10 pixels and has an average amplitude of 1, then in the convoluted signal the location of the wavelet will be manifested by a peak of the magnitude of 10, which is in the middle of the 20 pixel wide interval of the symmetric pseudorandom signal with the average amplitude of 1. Importantly, these pseudorandom tails are different for each specific wavelet structure. If we have the possibility to cycle various different pseudorandom watermarks inscribed to an identical location on top of the carrier signal and average the results (Fig. 1B and Fig. S7 in ESI†) we can improve the fidelity and suppress the pseudorandom tails. While the resonant spikes add fully constructively, the tails simply average out. Ultimately 100% fidelity of watermark detection is achieved with unlimited possibility to cycle various watermarks (Fig. 1C).
The carrier signal can amplify the non-resonant tails in case it is substantially stronger than the watermark (as it is the case in Fig. 1 but not in Fig. S7, ESI†), but they remain random. Thus, the premise still holds that when various watermarks are cycled, the tails are gradually averaged out. The width of the watermark and the ratio between the baseline and the watermark amplitude influence the efficiency of watermark detection. However, if the possibility exists to cycle watermarks in an unrestricted way any baseline can be rejected. This is the key property of watermarking as described above: it draws absolutely no assumption with respect to the baseline structure.
We recognized an important analogy between digital watermarking and the Raman experiment. In both cases the goal is to detect a fine structure on top of a strong, broadband and generally unspecified background. In the Raman experiment, fluorescence or stimulated emission can be treated as the carrier signal while the Raman signal itself can be seen as a watermark. The key problem in current Raman spectroscopy is that it depends on employing a spectrally-narrow Raman excitation that leads to a single specific manifestation of the Raman signal. The advantage of such an approach is that the recorded spectrogram represents a direct image of the vibrational spectra. Nowadays, however, in the era of digitalized detection, this benefit dropped in importance. Implicit data can be automatically converted to an explicit signal provided that the correct routine exists. The traditional approach of accumulating the signal by repeating the same experiment with a fixed narrow Raman excitation leads to the improvement of the signal, but the background is constantly accumulated as well. If we could instead accumulate the data by cycling the Raman signal as pseudorandom watermarks, and use the high fidelity of pseudorandom watermark recovery, we can in principle accumulate only the desired signal (as in Fig. 1C). This paper shows that especially for femtosecond stimulated Raman experiments this is indeed possible. If we watermark the pulses used to generate the Raman signal (Raman pulse-pump: “Rp”) we can directly watermark the Raman signal as well. This is illustrated in Fig. 2.
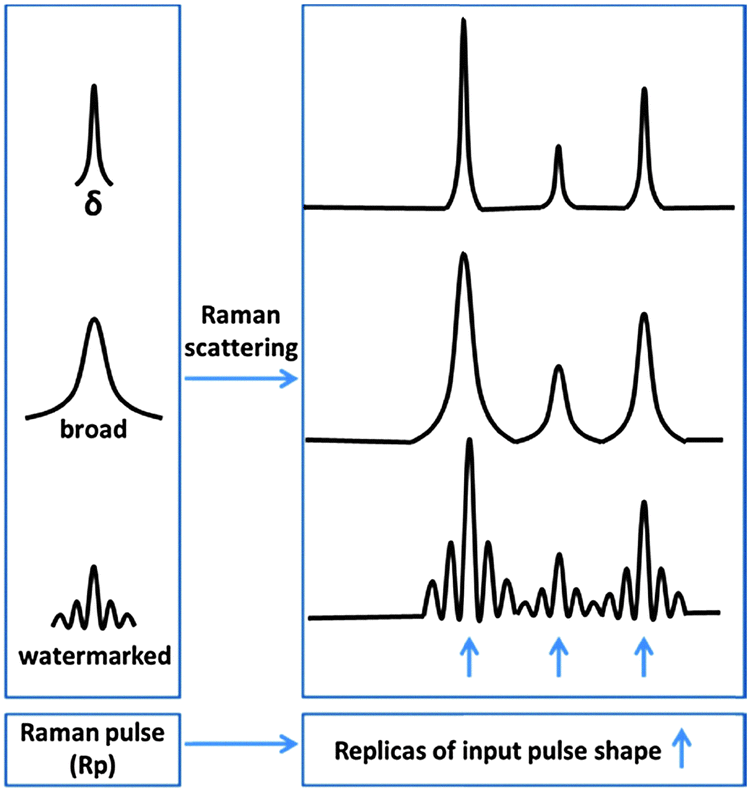 | ||
| Fig. 2 Peaks in Raman spectra are in fact replicas of the spectral shape of the Raman pulse. When the Raman experiment is performed with broad watermarked pulses the Raman peaks are manifested as defined watermarks. | ||
Raman peaks in the Stokes region are in fact red-shifted replicas of the spectral envelope of the Raman pulse, convoluted by the intrinsic bandwidth of the given Raman transition. When the Rp pulse has a fine spectral structure (but broader than the intrinsic width of the Raman transition), this structure will be reproduced for each Raman active transition. Undesired non-Raman contributions to the signal (e.g. fluorescence) might to some extent depend on the spectral shape of the pulse, but they are not manifested as a direct replica of the complex pulse watermark. Fine spectral watermarking of the Rp pulse thus watermarks the Raman signal but not the non-Raman contributions.
A drawback of the basic approach shown in Fig. 2 is the impossibility to create positive and negative signals at the same time, since Raman scattering is always signal gain (or always signal loss as in the case of anti-Stokes stimulated Raman loss11). Inscribing a signal into a watermark of an unrestricted shape requires access to predefined positive and negative features at the same time. This can be solved by inscribing the watermark in two stages as a difference between two complementary Raman experiments. This is illustrated in Fig. 3.
 | ||
| Fig. 3 Procedure of the differential watermark inscribing: the chosen watermark with zero integral (W0) is divided into positive (W+) and negative (W−) parts. Two experiments are performed, one with Rp pulse shape of W+ and another with W− shape. The difference of these experiments is the signal where Raman peaks carry the W0 watermark, but also a broadband background and fixed pattern noise are suppressed. | ||
The procedure is the following: a pseudorandom watermark W0 with a zero integral is generated and divided into negative (W−) and positive (W+) parts. Two separate Raman experiments, one with Rp shape W− and the other with W+ shape, are performed. The difference between these two signals is then the W0 watermarked signal. Because the overall intensity and central wavelength of the W− and W+ are identical, the non-Raman contributions to the signal should be nearly identical for both experiments. As a result, the differential watermarking does not only allow accessing arbitrary watermark structures, but it also greatly suppresses the carrier signal and fixed pattern noise. Note that this method preserves both the sign and peak shapes of a particular Raman spectrum, so when recorded structures are for instance dispersive, this is not going to be lost by watermarking. The differential watermarking is in fact a merger of watermarking and the wavelength modulation technique proposed for Raman experiments in 2011.8 The main advantage of watermarking in comparison with the 2011 method is a substantially higher overall robustness but also more specifically robustness in capturing broadband and narrowband signals at the same time.
Experimental and computational realization: wavelet approach operation in δ-representation
We have described above how recording the Raman signal by cycling pseudorandom watermarks of the Rp pulse results in the explicit detection of the Raman signal while other unwanted signals are strongly suppressed. However, it is important to realize that measuring pseudorandom watermarks directly (e.g. by a pulse shaper generating pseudo-random waveforms) is a rather expensive and inefficient way of collecting the desired data. Instead, it is better to derive the pseudorandom watermarked data from some primary signals. Below we describe in detail that such primary watermarked data can be realized in the so called δ-representation by a set of conventional Raman experiments with shifted Rp pulse wavelengths. Any pseudorandom watermarked signal can be then generated simply as a linear combination of these signals. It is similar to the approach described in Fig. 3, but instead of adding one and subtracting another dataset we can add and subtract a whole manifold of datasets.The watermarking approach in δ-representation is effectively a procedure how to process a cluster of traditional Raman experiments. The only condition is that these experiments have to be performed with different wavelengths of the Raman pulse (pump) (Rp). The crucial advantage is then naturally that experimentally it does not bring any alteration to the traditional FSRS experiment. Any theory and assumption valid to normal FSRS experiments is thus valid also for watermark-processed signals. A disadvantage is that it does not bring increased efficiency to the Raman pulse generation. However, in a research environment where the optical input pulse power is typically not the limiting factor we believe it is the best choice to harness the watermarking approach.
The procedure consists of four elementary steps: (1) shifted signal manifold recording, (2) scrambling signal into watermarks, (3) convolution of the scrambled signal by the ideal watermark forms, (4) summation of the convoluted signals. These are going to be described below:
1. Shifted signal manifold recording
We developed a way how to record the necessary manifold of signals simultaneously by rotating a special blade in the Fourier plane of the pulse shaper. It is very low-cost to implement and robust to use, and built on two crucial technical requirements. That is (i) a chopper with the possibility of external synchronization and phase control and (ii) detector that operates on a shot-to-shot basis (with respect to chopper rotation). For the fidelity of any FSRS result it is desirable to have the opportunity to reference ground state Raman signals and transient absorption signals corresponding to the recorded Transient Raman signal, ideally on a shot-to-shot basis. In traditional FSRS experiments this is typically done by chopping one pulse on half the laser frequency and the other on the quarter frequency. This means for a 1 kHz laser system to chop the Rp beam by 500 Hz and the actinic beam (Pu) by 250 Hz. This creates the repetition of a four element sequence where all needed signals are recorded. We constructed the blade to operate exactly in this way, with shifting the Rp wavelength for each sequence until the entire revolution of the blade. The blade is shown in Fig. 4. The chopper blade with slits arranged in a spiral is placed into the Fourier plane of a pulse shaper. The slits have a triangular shape to allow adjusting their effective width by the phase of the chopper, as described previously.8 The spiral-arranged slits are each repeated twice and followed by two blank elements. Full time-resolved Raman experiments can thus be performed by chopping the Fourier plane of the pulse shaper by the inner part of the blade while chopping the actinic pulse (Pu) by the outer part of the blade (of course exactly the same effect is created when the actinic beam is chopped by an independent chopper operating on half the laser frequency). The sequence on the custom blade is on purpose perturbed at the beginning where there are six blank elements in the row. When the output of the shaper with the custom blade in the Fourier plane is sampled by a photodiode connected to the detection apparatus, it experiences an ON–ON–OFF–OFF–ON–ON–OFF–OFF… sequence until the OFF–OFF–OFF–OFF–OFF–OFF sequence marks the end of the sequence. If the detection is made in a way that the photodiode signals are inscribed into the camera signal, the data can be aligned later and no wiring between the chopper and the detector is needed. We employed a blade based on 60 effective elements that include 14 × sequences of 4; and 6 blank elements for synchronization. As a result, 14 different Raman experiments are thus effectively performed simultaneously. | ||
| Fig. 4 Watermarking in δ-representation: a special chopper blade is designed to record several shifted Raman spectra both in the ground state and the excited state. | ||
The result of this experimental arrangement is 14 Raman signals slightly shifted to each other based on the dispersion of the bandwidth in the pulse shaper and on the separation of the slits on the blade (in our blade slit shifts for one millimeter for each cluster). The interval of spectral modulation in our set-up was ∼15 cm−1. This was chosen as the spectral bandwidth of the used Rp pulse. When the modulation interval is comparable with the effective resolution of the experiment, the watermarking approach is believed to be the most efficient. A too weak modulation decreases the power of the method (reduces the efficiency of baseline rejection) and a too strong modulation means that the collected manifold of signals does no longer form a full basis on a given interval; that means we do not fully sample the watermarking interval. In the latter configuration, we recorded artifacts such as interference patterns between neighboring peaks and the method can lead to spurious peak-shapes. In general, the minimal interval of the wavelength/wavenumber modulation (Δν) should not be larger than the spectral resolution the experiment targets.
2. Signal scrambling into wavelets (watermarks)
Prior to the application of the watermark filter, it is practical to pre-process the data into a form that makes the algorithm most straightforward. The major reason for doing so is that spectrographs are typically linear in wavelength but that the Raman shift is linear in photon energy. For this reason, all recorded signals are converted to an energy scale. In principle this is not strictly necessary but projecting the measured signals into a basis where the Raman shift is equidistant in terms of pixels across the entire measured window allows the use of simple matrix algorithms to perform convolutions‡. This we achieved by calibrating a selected signal (in our case signal 8, chosen because it is in the center of the modulated interval, but that is not a necessary condition) and interpolating all recorded signals into the axis equidistant in wavenumbers based on this calibration vector (cm−1)§. The same holds for the modulation intervals, because a 4f pulse shaper is typically also more or less linear in wavelength. In practice, it is thus useful to calibrate all the signals (in our case all 14) because it is the safest way how to derive the precise modulation intervals, that means how much the signals are shifted to each other. The results of the pre-processing are 14 vectors which are now organized into matrix Dr(n,p) (signals interpolated into the chosen axis equidistant in wavenumbers) and 14 constants that describe how much is each of the signals shifted with respect to the chosen axis noted Δ1−n. When this is done the algorithm itself is fairly straightforward.The signal scrambled into watermarks is created by multiplying each of the 14 signals by a chosen pseudorandom number and summing them up. For the success of the method it is essential that the created watermark has a vanishing integral, which means that the 14 applied pseudorandom numbers have to sum into zero. The operation can be conveniently performed by matrix multiplication. When a set of pseudorandom numbers defining the watermark is vector “W” and the recorded manifold of signals is matrix “Dr” (“D” stand for “data”, “r” stand for “real”) then the signal scrambled into watermark “S” is simply:
| W(1,n) × Dr(n,p) = S(1,p) | (1.1) |
The second element needed is the model watermark “M”. This is constructed in the same way as the scrambled signal:
| W(1,n) × Dm(n,m) = M(1,m) | (1.2) |
3. Convolution of scrambled signal by the ideal watermark forms
When the above-described vectors are evaluated, the resolving of the watermarked signal (effectively the core of the entire approach) is simply a convolution of the Signal and the Model:| S * M = filtered signal | (1.3) |
4. Summation of convoluted signals
The process has to be repeated over a large number of watermark forms in order to resolve any ambiguity (the used watermarks altogether have to form a full basis over the given interval – there has to be enough watermarks that any function on a given interval can be described as a linear combination of these watermarks). A universal approach (however computationally expensive) is to cycle the process (1.1)–(1.3) for various randomly chosen W, such that for each ∑W = 0 and averaging the results. We discovered that about 500 cycles provide already very reliable results for a manifold of 14 signals. The presented data are based on 1000 averages (1000 watermarks used for each data point). Despite the theoretical computational sub-optimality of such an approach, the signal processing including the preprocessing was done in Matlab at a speed substantially exceeding the acquisition of the data. Possibly more optimal solution would be to use elements of a Hadamard12 matrix instead of pseudorandom numbers, however, Hadamard matrices are defined only for a certain number of elements (such as 2, 4, 8…) and 14 is not among them.The entire process is summarized and visualized in Fig. 5.
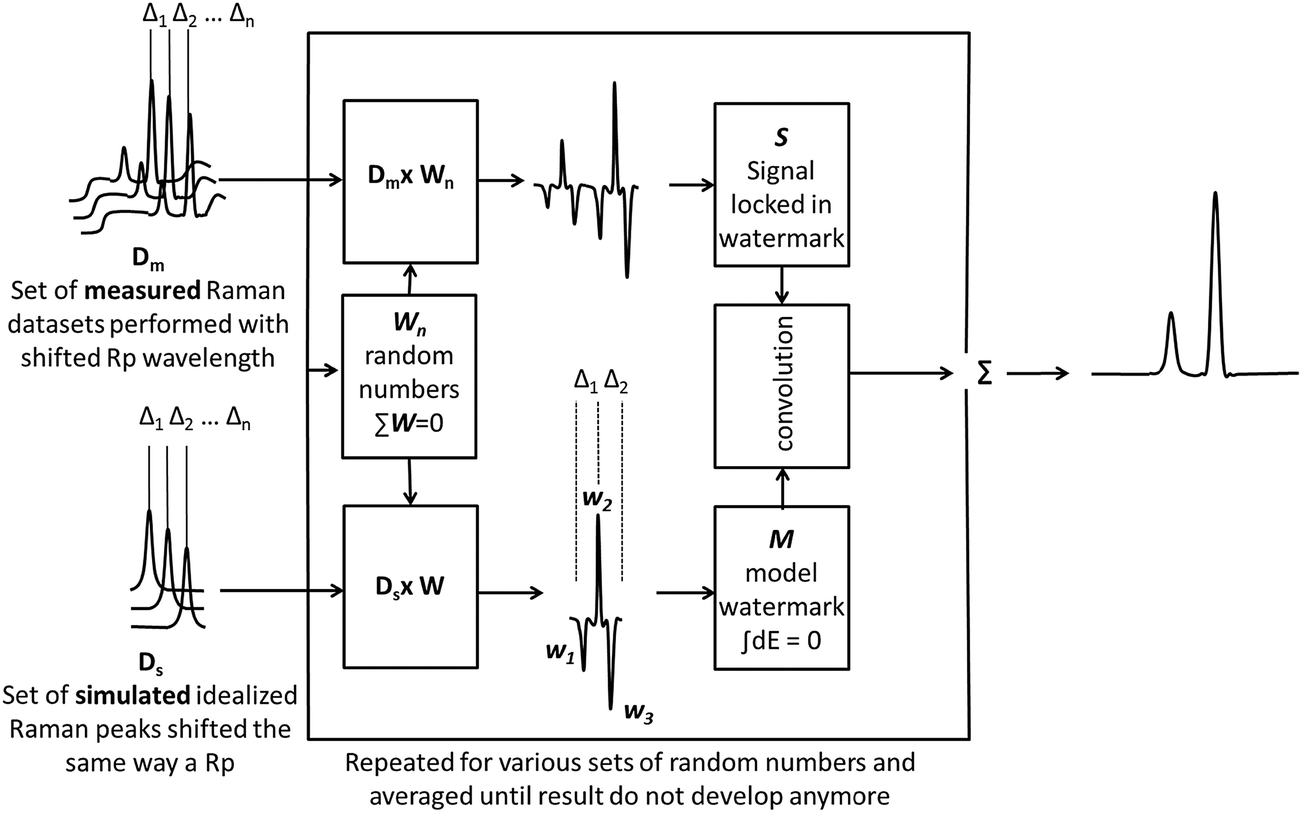 | ||
| Fig. 5 The shifted Raman spectra are fed into a watermark filter that numerically creates a pseudorandom watermarked signal by a linear superposition of measured signals and detects the watermarks by convolution of the signal with the model watermark. For simplicity of the scheme the displayed model watermark M consists just out of 3 elements instead of 14 actually generated by the blade displayed in Fig. 4. | ||
The filter has two inputs: a manifold of the shifted signal (for simplicity illustrated on 3 signals instead of the used 14) and information about shifts between the signals in the manifold. The output is a vector of filtered data. When the manifold of signal enters the filter, a set of random numbers is generated that scrambles the manifold into a single signal. The same is done for the idealized signal that is based on known spectral shifts of the recorded manifold. The real signal locked in the watermark and the idealized watermark are then convoluted, resulting in the extraction of the watermark. This is repeated and averaged for a number of watermarks until it converges to a stable solution.
Advantages of the method with respect to our earlier wavelength modulation technique
In an earlier paper, we described a wavelength modulation technique to automate baseline rejection in FSRS.8 That former approach works fine under optimal conditions, but suffers from two essential drawbacks. First is the choice of the modulation interval. The approach operates with only two signals with a fixed spectral shift. If the shift is very small, there is a substantial loss of the signal, because evaluating a derivative practically always worsens the signal to noise ratio. On the other hand, when the modulation interval is large, the method loses its capacity to capture fine spectral features. In the case of no prior knowledge or the expectation of the signal available, the choice of the modulation interval is very difficult. Consequently, the experiment typically has to be repeated several times with various modulation intervals until satisfactory data are obtained. The second issue is the required equality of shifted signals. When the magnitude of the two generated signals is not perfectly equal, it is very difficult to recover the correct peak shapes. With our new method, the broader manifold of shifted signals recorded in watermarking allows capturing both narrow and broader peaks at the same time while being very robust with respect to different amplitudes of shifted signals.Limitations of the method
The method is continuous by its nature (no defined threshold is applied) so it achieves suppression of the baseline signal and fixed pattern noise, but the suppression is not impeccable. Generally, when the signal does not vary too rapidly across the spectral width of the watermark, the baseline rejection is very efficient and any linear offset is rejected with 100% efficiency (infinitely large offsets are rejected in case they consist of low frequencies only). However, if the signal oscillates within the watermark with amplitude higher than that of the watermark, some residual background might resist rejection. In practice, we readily observed background suppression around 50 dB. This means that for example in the case of a FSRS signal of 100 μOD on top of a highly structured 200 mOD transient absorption signal (2000:1 background to the Raman signal), the residual offset can be substantial even after watermarking. However, it should be noted that without watermarking, resolving such a hidden Raman signal would be absolutely hopeless.The second issue is the alteration of the peak shapes. If the watermark (pseudorandom function) is artificially shaped to have a precisely vanishing integral, it means that an intrinsic correlation within the watermark is introduced. If one part of the watermark is positive, the other part is forced to compensate for it. As a result, the convolution of the signal by the watermark with a vanishing integral forces also the convoluted signal to have vanishing integral. All recovered Raman peaks are then accompanied by a proportional amount of negative signal on the sides of the peak following the width of the watermark, giving the peaks a characteristic sombrero shape (not to be confused with the precisely defined “Mexican hat wavelet” or “Ricker wavelet” which is identical to the second derivative of the Gaussian function). The ratio between the peak amplitude and the amplitude of the negative contribution (a precise shape of the “sombrero”) is determined by the ratio between the width of the resolved peaks and the width of the watermark. From this we can conclude that the spectral width of the watermark needs to be substantially broader than the broadest Raman structures we want to resolve. If the watermark is much broader than the embedded peak, the effect is negligible (100![[thin space (1/6-em)]](https://www.rsc.org/images/entities/char_2009.gif) :1 in the case of Fig. 1C; there is no noticeable negative signal compensating the positive peak). In the case of the data presented in Fig. 5 and 6, the watermark is about 7× broader than the resolved peaks, making the negative contributions insignificant in terms of data interpretation, even though they are detectable (see positive tails of the negative CS2 solvent peak bleach around 650 cm−1 in Fig. 5). It must be stressed that this effect is associated with the resolved peaks themselves and not with the baseline. Thus, if the Raman signal gets weaker, this effect becomes also proportionally weaker. The effect is constant for a given experimental realization and no spurious peaks arise this way. The sombrero peak structure can be avoided simply by not using watermarks artificially tailored to have a perfectly vanishing integral. However, the baseline suppression is then compromised. Another alternative is to work with even broader watermarks.
:1 in the case of Fig. 1C; there is no noticeable negative signal compensating the positive peak). In the case of the data presented in Fig. 5 and 6, the watermark is about 7× broader than the resolved peaks, making the negative contributions insignificant in terms of data interpretation, even though they are detectable (see positive tails of the negative CS2 solvent peak bleach around 650 cm−1 in Fig. 5). It must be stressed that this effect is associated with the resolved peaks themselves and not with the baseline. Thus, if the Raman signal gets weaker, this effect becomes also proportionally weaker. The effect is constant for a given experimental realization and no spurious peaks arise this way. The sombrero peak structure can be avoided simply by not using watermarks artificially tailored to have a perfectly vanishing integral. However, the baseline suppression is then compromised. Another alternative is to work with even broader watermarks.
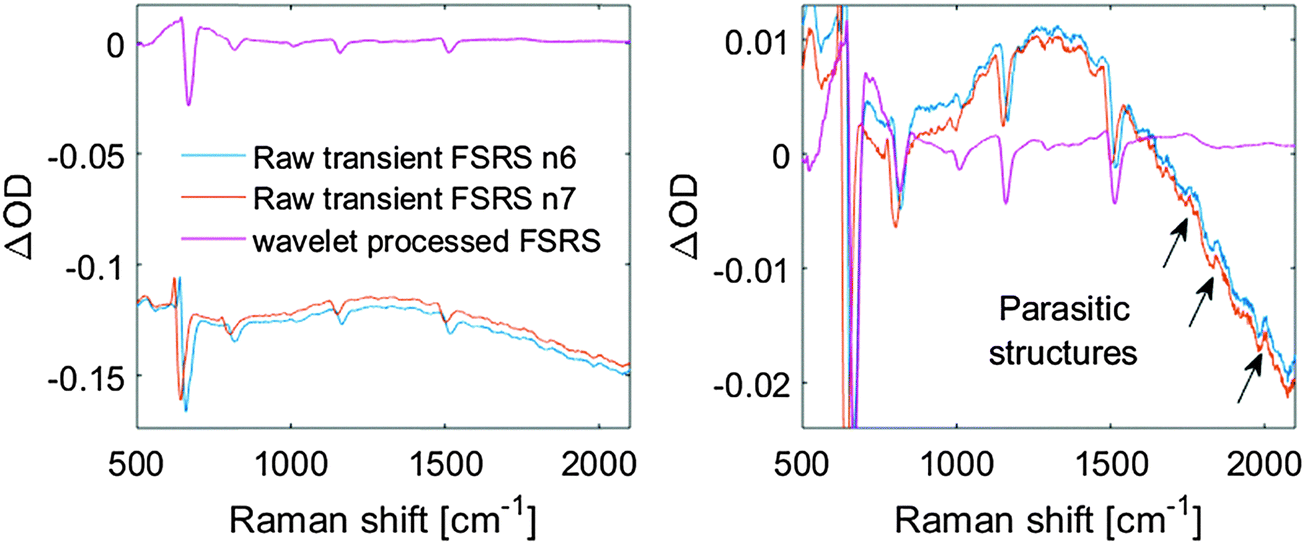 | ||
| Fig. 6 Comparison of the traditional femtosecond Raman experiment and watermark processed signal (absolute values – left, after offset subtraction – right). All three presented signals manifest the transient Raman signal of Spirilloxanthin 1 ps after excitation. Orange and blue signals are 6th and 7th explicit FSRS out of 14 wavelength shifted signals generated as a part of primary watermarked signal recorded in δ-representation. Magenta line represents the signal after processing signals n1–n14 via a watermarking algorithm. Note not only the automatic broadband background and offset rejection but also strong suppression of parasitic fixed pattern noise that can be otherwise interpreted as spurious peaks. | ||
The third issue to discuss is the standard “white noise” (frequency-unspecific noise). In watermarking, random noise appears in exactly the same way as in a traditional FSRS experiment. Convolution of the watermark with another random function simply blurs the watermark and decreases the contrast of recovered peaks. This is natural since watermarking can separate desired from undesired signals but obviously cannot spell a signal out of nothing. Watermarking, however, suppresses any frequency-specific or constant noise (e.g. periodic oscillations in the signal or a fixed pattern noise). In our experience, the frequency-specific noise and the fixed pattern noise typically dominate the genuine white noise, especially in thoroughly averaged data. This causes watermarking to effectively appear to reduce the noise in comparison to an equivalently long traditional FSRS experiment, however it does not alter the fundamental signal-to-noise ratio in the raw signal in any direction. It only conveniently automatically suppresses unwanted signals that manifest some regularity.
Wavelet modulation demonstrated by resolving the nature of the S* signal of carotenoids
We demonstrate the power of our method by challenging a long-standing issue regarding the dark states of carotenoids,13 namely the nature of the so-called S* signal that has generated considerable controversy in carotenoid science.14,15 Whereas carotenoids are known to be very strong Raman scatterers, recording the signature of the S* signal is a challenging task due to its elusive character and small transient population.16 In addition, we show that in very limited data collection time (20 minutes) a complete dataset with 51 time delays can be recorded at high signal to noise.Let us first consider the signal improvements from our proposed method. Fig. 6 shows the watermarked spectra (magenta lines) of spirilloxanthin as compared to raw, unprocessed FSRS spectra (cyan and orange lines) at a time delay of 1 ps. The left panel shows the signals in absolute values, while in the right panel a constant offset was subtracted from the raw FSRS spectra. We observe that the watermarked signal is essentially baseline free, whereas the raw FSRS spectra show Raman features on a steeply sloping baseline signal that has an overall larger amplitude than the Raman signals. In particular, below we will focus on the region around 1770 cm−1, which in the watermarked spectrum shows a small but important positive band and corresponds to an upshifted C![[double bond, length as m-dash]](https://www.rsc.org/images/entities/char_e001.gif) C stretch of spirilloxanthin. In the raw FSRS spectra, this signal cannot be discerned well as a result of the steeply sloping baseline and the higher noise. We draw two conclusions:
C stretch of spirilloxanthin. In the raw FSRS spectra, this signal cannot be discerned well as a result of the steeply sloping baseline and the higher noise. We draw two conclusions:
(i) generation of watermarked signals by the approach described in Fig. 3–5 removes the background with great robustness. Moreover, resolving the Raman peaks using convolution by the inscribed watermark with vanishing integral perfectly removes any offset broader than the wavelet. As a result, two independent consecutive mechanisms contribute to the offset removal. One originates from using watermarking as such and the other from the differential approach that we use to lock the Raman signals to the watermark.
(ii) the fixed-pattern-noise and normal time-dependent noise in the signal are greatly suppressed. This is again a result of two independent processes: first, the fixed pattern noise affects both |W+| and |W−| signals comparably, and their subtraction thus implies fixed-pattern noise suppression. Second, the watermarking approach delocalizes the detection over an interval of pixels (the entire watermark carries information about the Raman mode spectral location). In effect, any residual fixed pattern noise, possibly even dead pixels in the detector plus the time-dependent noise, is averaged over all pixels spanning the spectral interval of the watermark. As a result, if needed, the signal is smoother and can be averaged for a much longer period prior to reaching boundaries set by systematic artifacts. We recorded transient Raman signals with sensitivity up to 10−6 (∼1 μOD) based only on 1.5 seconds of effective averaging (Fig. S4 in the ESI†).
We now consider the issue of the S* state in carotenoids and demonstrate how our new method is instrumental in its solution. Carotenoids are known to have a specific response to photoexcitation: from the ground state they are excited to the S2 state that decays within hundreds of femtoseconds to a weakly radiative S1 state, which is inaccessible from the ground state because the S0 → S1 transition is symmetry-forbidden.13,17 For carotenoids with long π-electron conjugated chains, a clear signal, decaying slower than the S1 state, has been reported.13,14,16,18,19 The origin of this signal, usually denoted as the S* signal or the S* state, remains a subject of a considerable debate;20–22 proposals include it being either a separate excited state,14,15,19,21,23 a hot ground state24 or a Bu− state.14 A crucial observation from ultrafast Raman spectra of carotenoids is the CC stretch that is strongly upshifted in the S1 excited state (in the case of β-carotene from 1526 cm−1 in the ground state to 1778 cm−1 in the S1 state) due to vibrational coupling between the S0 and S1 states.25,26 The vibrational signature of the S* state has not been recorded so far, but due to the large difference between ground and excited state frequencies of the CC stretch, the FSRS experiment has the potential to provide a rigorous test whether the S* signal originates from the ground or the excited state.25–29 Here we compare FSRS spectra of β-carotene (where the S* signal is very weak or absent, at least upon excitation at the red side of the absorption band) and spirilloxanthin (where the S* state signature is well-documented from femtosecond transient absorption experiments) in CS2 as a 3.2 ps component evolving independently of the S1 state that has a lifetime of 1.5 ps.14,18 High fidelity and improved sensitivity of the watermark-resolved FSRS allowed us to record the S* signature in spirilloxanthin.
Complete datasets are displayed in the ESI† for inspection in Fig. S2 and S3. Fig. 7 presents a zoom into the region where major S1 and S* signatures are manifested, for β-carotene in the left panel and spirilloxanthin in the right panel. The S1 state signature of spirilloxanthin can be seen to shift within the first two picoseconds from 1743 cm−1 to about 1771 cm−1 where it almost entirely decays within 10 ps. No shift of this kind can be observed for β-carotene measured under exactly the same experimental conditions whose S1 CC stretch is at 1778 cm−1 regardless of the delay time, and it decays significantly slower. Thus, the 1771 cm−1 feature of spirilloxanthin is explained as due to the CC stretch in the S* state which decays slower (∼3 ps) than the S1 CC stretch at 1743 cm−1. Note that the observed dynamics (dynamic up-shift of the CC vibrational band) cannot be explained as arising from vibrational cooling in the spirilloxanthin S1 state: it is well established that its S1 state depopulates with a time constant of 1.5 ps,14,18 therefore the 3 ps phase must represent a distinct other electronically excited state.
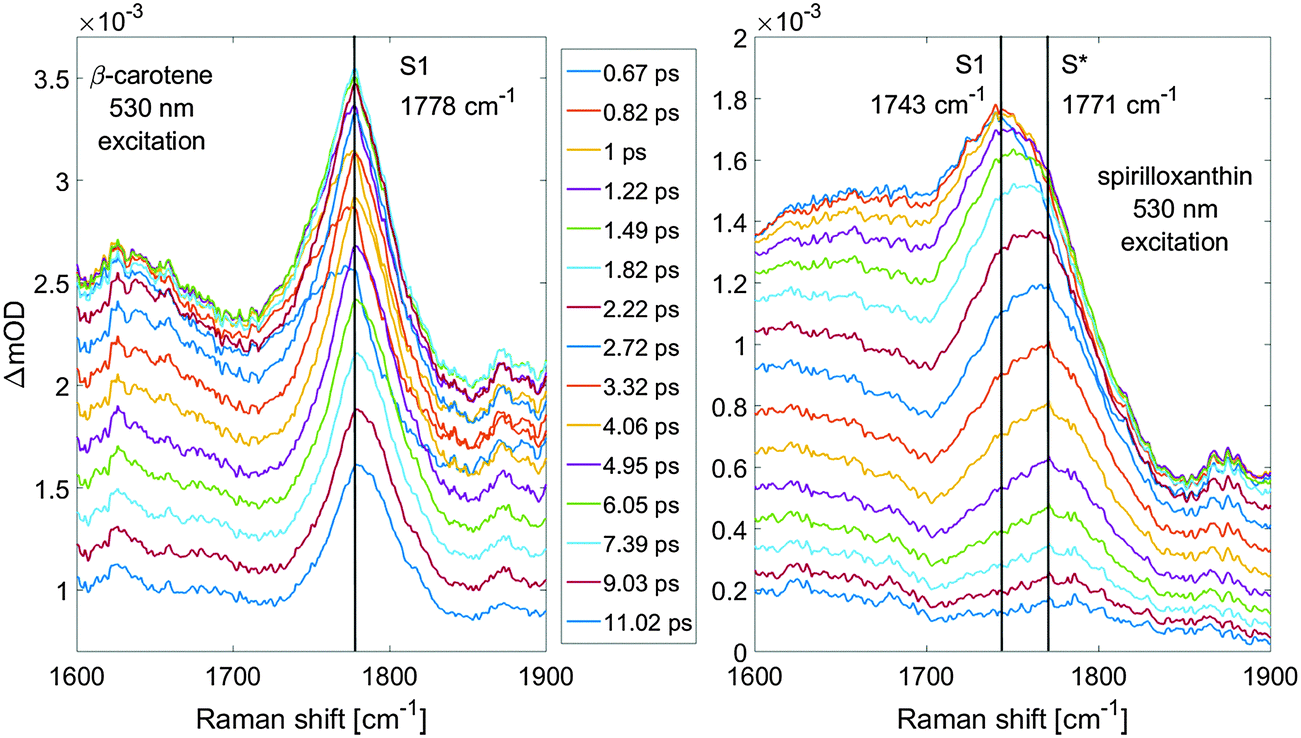 | ||
| Fig. 7 Femtosecond transient absorption spectra of β-carotene (left panel) and spirilloxanthin (right panel) in the S1 state fingerprint region at the time delays indicated. We can observe the spirilloxanthin peak to manifest a higher energy shoulder that decays at a distinctly slower rate making the S1 peak to effectively shift its maximum from 1743 cm−1 to 1771 cm−1 in less than 3 ps. These observations are in agreement with known S1 and S* dynamics in spirilloxanthin suggesting that 1771 cm−1 is indeed an S* state signature. | ||
There is a universal relation between the length of the conjugated backbone and the properties of the S1 state of carotenoids.30 As the backbone gets shorter, the S1 state energy increases, its lifetime is prolonged and the CC ground state vibrational frequency becomes larger13,31 (see Fig. S1, ESI†). The combination of a prolonged lifetime and a larger CC frequency of the S* signal compared to the S1 state (Fig. 6) thus implies that the S* signal must have an origin in an S1-like excited state associated with a carotenoid conformation having a shorter effective conjugation length. Such an observation of the S* state signature rules out the assignment of the S* signal to a hot ground state. Instead, it supports the interpretation of the S* state as the S1 state of certain carotenoid conformations that in a small fraction exists already in the ground state.21 This is further supported by the observation of a high energy shoulder of the spirilloxanthin CC ground state peak that can be clearly seen when the ground state CC band is overlapped with a shifted β-carotene CC peak (Fig. S6, ESI†); there is asymmetrical broadening towards higher energies which likely corresponds to the presence of a ground state population with shorter effective conjugation. All these results demonstrate greater resolving power of FSRS spectra recorded by the spectral watermarking approach and strongly suggest that S* phenomena in free carotenoids correspond to particular S1 states of less populated conformations with a shorter effective conjugation length.
Conclusions and outlook
We have developed the spectral watermarking method to automize baseline rejection in femtosecond Stimulated Raman spectroscopy, implemented through a low-cost experimental realization. We demonstrated robust baseline rejection in actual FSRS experiments that does away with the need for ad hoc baseline fitting and subjective visual inspection. In addition, fixed-pattern noise in the CCD array detectors was greatly reduced. Through this method, we conducted high fidelity FSRS experiments on carotenoids that showed that the elusive S* state in the open-chain carotenoid spirilloxanthin relates to a sub-population of conformationally distorted optically dark S1 states. The new method allows routine application of FSRS to a wide range of photoactive (biological) systems, to address fundamental reaction dynamics issues in a wide range of photoactive materials, from biomolecules in solution to photoreceptor proteins, photosynthetic light harvesting and reaction center complexes and energy materials. The method will be especially powerful when experimentally realized in combination with pairs of a synchronized amplified Ti:sapphire laser system, which enables time-resolved stimulated Raman spectroscopy from the femtosecond to millisecond timescales in a single experiment. Such experiments are currently in progress in our laboratory.Acknowledgements
This work was supported by the Chemical Sciences Council of the Netherlands Organization for Scientific Research (NWO-CW) through a VENI grant to M. K., a VICI grant to J. T. M. K. and a Middelgroot investment grant to J. T. M. K. Work in the laboratory of H. A. F. was supported by grants from the National Science Foundation (MCB-1243565) and the University of Connecticut Research Foundation. TP thanks Czech Science Foundation (grant No. P501/12/G055) for financial support. The authors thank Amy M. LaFountain for preparing the purified spirilloxanthin used in the experiments.References
- N. Rohringer, D. Ryan, R. A. London, M. Purvis, F. Albert, J. Dunn, J. D. Bozek, C. Bostedt, A. Graf, R. Hill, S. P. Hau-Riege and J. J. Rocca, Nature, 2012, 481, 488 CrossRef CAS PubMed.
- S. Tanaka and S. Mukamel, Phys. Rev. Lett., 2002, 89, 043001 CrossRef PubMed.
- T. Takaya and K. Iwata, J. Phys. Chem. A, 2014, 118, 4071 CrossRef CAS PubMed.
- G. W. Faris and R. A. Copeland, Appl. Opt., 1997, 36, 2686 CrossRef CAS PubMed.
- G. Eckhardt, R. W. Hellwarth, F. J. McClung, S. E. Schwarz, D. Weiner and E. J. Woodbury, Phys. Rev. Lett., 1962, 9, 455 CrossRef CAS.
- M. Yoshizawa and M. Kurosawa, Phys. Rev. A: At., Mol., Opt. Phys., 2000, 61, 013808 CrossRef.
- P. Kukura, D. W. McCamant and R. A. Mathies, Annu. Rev. Phys. Chem., 2007, 58, 461 CrossRef CAS PubMed.
- M. Kloz, R. v. Grondelle and J. T. M. Kennis, Phys. Chem. Chem. Phys., 2011, 13, 18123 RSC.
- F. Hartung and M. Kutter, Proc. IEEE, 1999, 87, 1079 CrossRef.
- J. R. Challa, Y. Du and D. W. McCamant, Appl. Spectrosc., 2012, 66, 227 CrossRef CAS PubMed.
- B. Mallick, A. Lakshmanna, V. Radhalakshmi and S. Umapathy, Curr. Sci., 2008, 95, 1551 CAS.
- W. K. Pratt, J. Kane and H. C. Andrews, Proc. IEEE, 1969, 57, 58 CrossRef.
- T. Polivka and V. Sundstrom, Chem. Rev., 2004, 104, 2021 CrossRef CAS PubMed.
- C. C. Gradinaru, J. T. M. Kennis, E. Papagiannakis, I. H. M. van Stokkum, R. J. Cogdell, G. R. Fleming, R. A. Niederman and R. van Grondelle, Proc. Natl. Acad. Sci. U. S. A., 2001, 98, 2364 CrossRef CAS PubMed.
- E. Papagiannakis, J. T. M. Kennis, I. H. M. van Stokkum, R. J. Cogdell and R. van Grondelle, Proc. Natl. Acad. Sci. U. S. A., 2002, 99, 6017 CrossRef CAS PubMed.
- T. Polivka and V. Sundstrom, Chem. Phys. Lett., 2009, 477, 1 CrossRef CAS.
- B. DeCoster, R. L. Christensen, R. Gebhard, J. Lugtenburg, R. Farhoosh and H. A. Frank, Biochim. Biophys. Acta, 1992, 1102, 107 CrossRef CAS.
- D. Niedzwiedzki, J. F. Koscielecki, H. Cong, J. O. Sullivan, G. N. Gibson, R. R. Birge and H. A. Frank, J. Phys. Chem. B, 2007, 111, 5984 CrossRef CAS PubMed.
- E. Papagiannakis, I. H. M. van Stokkum, M. Vengris, R. J. Cogdell, R. van Grondelle and D. S. Larsen, J. Phys. Chem. B, 2006, 110, 5727 CrossRef CAS PubMed.
- A. E. Jailaubekov, S. H. Song, M. Vengris, R. J. Cogdell and D. S. Larsen, Chem. Phys. Lett., 2011, 487, 101 CrossRef.
- V. Lukes, N. Christensson, F. Milota, H. F. Kauffmann and J. Hauer, Chem. Phys. Lett., 2011, 506, 122 CrossRef CAS.
- M. Kloz, S. Pillai, G. Kodis, D. Gust, T. A. Moore, A. L. Moore, R. v. Grondelle and J. T. M. Kennis, Chem. Sci., 2012, 3, 2052–2061 RSC.
- A. E. Jailaubekov, S.-H. Song, M. Vengris, R. J. Cogdell and D. S. Larsen, Chem. Phys. Lett., 2010, 487, 101 CrossRef CAS.
- T. Buckup, J. Savolainen, W. Wohlleben, J. L. Herek, H. Hashimoto, R. R. B. Correia and M. Motzkus, J. Chem. Phys., 2006, 125, 7 CrossRef PubMed.
- H. Hashimoto and Y. Koyama, Chem. Phys. Lett., 1989, 163, 251 CrossRef CAS.
- H. Hashimoto and Y. Koyama, Chem. Phys. Lett., 1989, 154, 321 CrossRef CAS.
- M. Yoshizawa, H. Aoki and H. Hashimoto, Phys. Rev. B: Condens. Matter Mater. Phys., 2001, 63, 4 CrossRef.
- D. W. McCamant, P. Kukura and R. A. Mathies, J. Phys. Chem. A, 2003, 107, 8208 CrossRef CAS PubMed.
- P. Kukura, D. W. McCamant and R. A. Mathies, J. Phys. Chem. A, 2004, 108, 5921 CrossRef CAS PubMed.
- V. Chynwat and H. A. Frank, Chem. Phys., 1995, 194, 237 CrossRef CAS.
- D. Kosumi, M. Fujiwara, R. Fujii, R. J. Cogdell, H. Hashimoto and M. Yoshizawa, J. Chem. Phys., 2009, 130, 8 CrossRef PubMed.
Footnotes |
| † Electronic supplementary information (ESI) available. See DOI: 10.1039/c6cp01464j |
| ‡ Alternative would be constructing its own convolution matrix that would include the nonlinearity of the Raman shift with respect to the spectral sampling interval. In principle this might be more computationally effective, but associated with pitfalls related to unequal sampling and difficult to understand and program. |
| § Because we effectively investigate 14 different samplings over the same pixel distribution, it can be justified to do slight extrapolation when converting wavelengths into wavenumbers. We used a 1024 pixel detector to cover the interval ∼2000 cm−1, but we project the signal into the axis with intervals of 1 cm−1. Our output processed signal then has roughly twice the resolution than each of 14 raw signals at the camera. We did not observe any artifact associated with this extrapolation. See e.g. Fig. SX (ESI†) for the inspection of smoothness of the data. |
| This journal is © the Owner Societies 2016 |