 Open Access Article
Creative Commons Attribution 3.0 Unported Licence
Structural, thermal, dielectric and phonon properties of perovskite-like imidazolium magnesium formate†
Mirosław
Mączka
*a,
Nathalia Leal
Marinho Costa
b,
Anna
Gągor
a,
Waldeci
Paraguassu
b,
Adam
Sieradzki
c and
Jerzy
Hanuza
d
aInstitute of Low Temperature and Structure Research, Polish Academy of Sciences, Box 1410, 50-950 Wrocław 2, Poland. E-mail: m.maczka@int.pan.wroc.pl
bFaculdade de Física, Universidade Federal do Pará, 66075-110, Belém, PA, Brazil
cDepartment of Experimental Physics, Wrocław University of Technology, Wybrzeże Wyspiańskiego 27, 50-370, Wrocław, Poland
dDepartment of Bioorganic Chemistry, Faculty of Industry and Economics, Wrocław University of Economics, 118/120 Komandorska Str., 53-345 Wrocław, Poland
First published on 25th April 2016
Abstract
We report the synthesis and characterisation of a magnesium formate framework templated by protonated imidazole. Single-crystal X-ray diffraction data showed that this compound crystallizes in the monoclinic structure in the P21/n space group with lattice parameters a = 12.1246(4) Å, b = 12.2087(5) Å, c = 12.4991(4) Å and β = 91.39(1)°. The antiparallel arrangement of the dipole moments associated with imidazolium cations suggests the antiferroelectric character of the room-temperature phase. The studied compound undergoes a structural phase transition at 451 K associated with a halving of the c lattice parameter and the disappearance of the antiferroelectric order. The monoclinic symmetry is preserved and the new metrics are a = 12.261(7) Å, b = 12.290(4) Å, c = 6.280(4) Å, and β = 90.62(5)°. Raman and IR data are consistent with the X-ray diffraction data. They also indicate that the disorder of imidazolium cations plays a significant role in the mechanism of the phase transition. Dielectric data show that the phase transition is associated with a relaxor nature of electric ordering. We also report high-pressure Raman scattering studies of this compound that revealed the presence of two pressure-induced phase transitions near 3 and 7 GPa. The first transition is most likely associated with a rearrangement of the imidazolium cations without any significant distortion of these cations and the magnesium formate framework, whereas the second transition leads to strong distortion of both the framework and imidazolium cations. High-pressure data also show that imidazolium magnesium formate does not show any signs of amorphization up to 11.4 GPa.
Introduction
Metal–organic framework (MOF) compounds have been widely studied in recent years due to their useful properties for wide range of applications.1,2 Dense MOFs constitute a subclass of MOFs, in which metal nodes are connected by small organic ligands, such as N3−, CN−, HCOO− or [N(CN)2]−, forming three-dimensional frameworks with cavities occupied by NH4+ or protonated amines.3–5 Among these compounds, azides and cyanides possess interesting switchable dielectric properties,4,5 whereas tetrapropylammonium manganese dicyanamide exhibits both antiferroelectric and magnetic order in one phase.6 Most widely studied were, however, AB(HCOO)3 formates with A = NH4+ or protonated amine and B = Mg2+, Cd2+, Zn2+, Mn2+, Co2+, Fe2+, Ni2+, and Cu2+, due to their rich structural diversity and the corresponding dielectric, magnetic, multiferroic, ferroelastic, mechanical, luminescent, negative thermal expansion and negative compressibility properties.7–23In the family of metal formate frameworks, the protonated amines are located in the cavities and they form hydrogen bonds to the anionic framework.7,9,13,19–21 At room or elevated temperatures, these interactions are usually too weak to overcome the thermally activated reorientational motion of the protonated amine and, as a result, the structures are dynamically disordered.7,9,13,19–21 Strengthening of the hydrogen-bonding interactions at lower temperatures often leads to ordering of these cations, distortion of the framework and the appearance of ferroelectric or antiferroelectric order.7,9,13,19–21 The strength of the hydrogen bonds and thus the phase transition temperature and dielectric properties, can also be modified by changing either protonated amine or metal cation. For instance, it was reported that the replacement of B2+ (B = Mn, Fe, Co, Zn, and Ni) with Mg2+ in the family of [(CH3)2NH2][B(HCOO)3] formates leads to a pronounced increase in the phase transition temperature from 160–185 K to about 260 K, respectively.24 Pressure is another external stimuli that can be used to tune the strength of the hydrogen bonds and tailor the properties of these compounds. For instance, it has been reported that the polar character of [NH4][Cd(HCOO)3] can be enhanced greatly by the application of pressure.25 The application of pressure may also lead to the discovery of new polymorphs that are not accessible under ambient conditions, as shown for a number of chiral and perovskite-like formates.25–29
To date, only two dense perovskite-like MOFs containing imidazolium cations are known. The first, (HIm)2[KFe(CN)6], wherein HIm+ = imidazolium cation, undergoes order–disorder phase transitions and exhibits striking dielectric anomalies and anisotropy below room temperature.30 The second one, [HIm][Mn(HCOO)3] (ImMn), was discovered by Pato Dolán et al., who observed magnetic order below 9 K and interesting dielectric properties.31 Based on the obtained results, it was suggested that this compound exhibits antiferroelectric order below 220 K, i.e., ImMn shows the coexistence of magnetic and electric order in one phase.31 However, DSC did not reveal any anomaly indicative of a phase transition.31 Recently, a phase transition in ImMn was discovered at 438 K and it was suggested that the high-temperature phase has tetragonal symmetry.32
The abovementioned examples show that to better understand mechanism of the phase transition and structure–property relationship in metal formate frameworks, it is important to perform a temperature- and pressure-dependent study of these compounds using various experimental methods. Because in this family of formates, hydrogen bonds play significant role, it is especially important to employ experimental methods that are sensitive to amine-framework interactions, e.g., neutron diffraction, NMR, infrared (IR) and Raman spectroscopy. We have, therefore, decided to synthesise a previously unreported imidazolium magnesium formate (ImMg) and employ temperature-dependent IR and Raman spectroscopy, as well as pressure-dependent Raman spectroscopy of this compound as vibrational spectroscopy is a very sensitive probe for monitoring the changes in hydrogen bonds, dynamics of the molecular units and lattice distortion.33 For comparison, we also report temperature-dependent data for known ImMn that provides additional insight into the properties of this compound and mechanism of the phase transition.
Experimental
Materials and instrumentation
MnCl2 (99%, Sigma-Aldrich), MgCl2·6H2O (99–102%, Sigma-Aldrich), methanol (99.8%, Sigma-Aldrich), imidazole (99%, Sigma-Aldrich) and formic acid (98%, Fluka) were available commercially and used without further purification. The heat capacity was measured using Mettler Toledo DSC-1 calorimeter with a high resolution of 0.4 μW. Nitrogen was used as a purging gas. The weight of the ImMg (ImMn) sample was 32.1 mg (21.4 mg). The heating and cooling rate was 5 K min−1. The excess heat capacity associated with the phase transition was evaluated by subtraction from the data the baseline representing the variation in the absence of the phase transitions. The dielectric measurements at ambient pressure were carried out using a Novocontrol Alpha impedance analyzer (1 Hz–1 MHz). Because the obtained single crystals were not large enough to perform single-crystal dielectric measurements, pellets made of well-dried samples were measured instead. The pellets were placed between two flat copper electrodes of the capacitor with a gap of 0.4 mm. The small signal of amplitude 1 V was applied across the sample. The temperature was controlled by the Novo-Control Quattro system, with a use of a nitrogen gas cryostat. The measurements were taken every 1 K over the temperature range from 390 to 475 K. The temperature stability of the samples was better than 0.1 K. The single-crystal X-ray diffraction experiment was carried out on an Xcalibur, Sapphire1 diffractometer operating in κ-geometry, equipped with a 2D CCD detector and a Mo Kα radiation source (λ = 0.71073 Å). For high-temperature X-ray diffraction, the sample was mounted in a quartz capillary. The high-temperature was provided with a hot-air flow (Kuma Diffraction). The X-ray powder diffraction data were collected using a X'Pert PRO X-ray diffraction system equipped with PIXcel ultra-fast line detector and Soller slits for Cu Kα radiation. The powders were closed in quartz capillaries (with ϕ = 0.5 mm) and measured in the transmission mode in the Anton Paar 1200N High-Temperature Oven Chamber. The temperature-dependent Raman spectra were obtained using a Renishaw InVia Raman spectrometer equipped with confocal DM 2500 Leica optical microscope, a thermoelectrically cooled CCD as a detector, an argon laser operating at 488 nm and Linkam cryostat cell. The temperature-dependent IR spectra were obtained using a Biorad 575C FT-IR spectrometer and a home made furnace. The spectral resolution of the Raman and IR spectra was 2 cm−1. The high-pressure Raman spectra were obtained in back-scattering geometry using a microscope attached to a triple-grating spectrometer Jobin Yvon T64000. The 514.5 nm line of an argon-ion laser was used as excitation and the spectral resolution was 2 cm−1. To reach high pressures, a diamond anvil cell μ-scope DAC HT(S) from Almax easyLab with a diamond culet of 0.4 mm was used. The sample was loaded into a 100 μm hole drilled in a stainless steel gasket with a thickness of 200 μm using an electric discharge machine from Almax easyLab. Nujol served as the pressure transmitting media. Pressures were measured based on the shifts of the ruby R1 and R2 fluorescence lines.Synthesis of the samples
To obtain single crystals of ImMg or ImMn, 16 mL of a methanol solution containing 5 mmol of imidazole and 20 mmol of formic acid was placed at the bottom of a glass tube (9 mm inner diameter). To this solution, 16 mL methanol solution containing 2 mmol of MgCl2·6H2O or MnCl2 was added gently. The tube was sealed and kept undisturbed. Colorless (pale pink) transparent crystals of ImMg (ImMn) were harvested after 1 week.Crystallographic structure determination
The data were collected in the ω-scan mode with Δω = 1.0° and processed with CrysAlis PRO, Agilent Technologies, Version 1.171.37.35h. The structure was solved by direct methods and refined with SHELXL2014/7.34 An empirical absorption correction using spherical harmonics was implemented. The hydrogen atoms were placed in the calculated positions and refined as riding atoms. Crystal data, data collection and the refinement results for ImMg are presented in Table S1 (ESI†). The selected bonds and the hydrogen bond geometry are given in Tables S2 and S3 (ESI†).Results and discussion
DSC
The DSC measurements show that ImMg exhibits a phase transition at 451 K upon heating and 448 K upon cooling (Fig. S1, ESI†). Fig. 1 shows that the heat capacity peak is asymmetric. Furthermore, the change in entropy at the phase transition is not sharp but ΔS decreases gradually with decreasing temperature and reaches almost zero at 410 K (Fig. 1). This type of behavior and small thermal hysteresis suggest that the phase transition is close to a second-order one.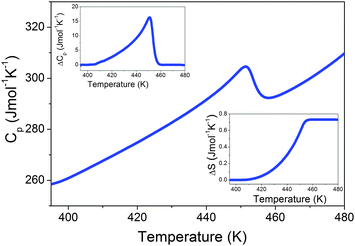 | ||
| Fig. 1 Heat capacity of ImMg measured in a heating mode. The insets show the change in Cp and S related to the phase transition. | ||
The associated change in enthalpy ΔH and entropy ΔS is ∼322 J mol−1 and ∼0.73 J mol−1 K−1, respectively. Isostructural ImMn showed slightly smaller values (see Fig. S2, ESI†). For an order–disorder transition, ΔS = R![[thin space (1/6-em)]](https://www.rsc.org/images/entities/char_2009.gif) ln(N), where N is the number of sites for the disordered system.35 For N = 2, ΔS should be 5.8 J mol−1 K−1. The experimental value of ΔS for ImMg is almost eight times smaller than that expected for the simplest order–disorder transition with only two sites in the disordered phase. Similar behavior was reported for many related perovskite-like formats, such formamidinium manganese formate19 and [(CH3)2NH2][Na0.5Fe0.5(HCOO)3],36 which indicates that the phase transition is more complex than expected on the basis of a simple order–disorder model. In particular, the lower than expected entropy change suggests that imidazolium cations are not fully ordered just below the phase transition, but still retain significant degrees of freedom well below Tc.
ln(N), where N is the number of sites for the disordered system.35 For N = 2, ΔS should be 5.8 J mol−1 K−1. The experimental value of ΔS for ImMg is almost eight times smaller than that expected for the simplest order–disorder transition with only two sites in the disordered phase. Similar behavior was reported for many related perovskite-like formats, such formamidinium manganese formate19 and [(CH3)2NH2][Na0.5Fe0.5(HCOO)3],36 which indicates that the phase transition is more complex than expected on the basis of a simple order–disorder model. In particular, the lower than expected entropy change suggests that imidazolium cations are not fully ordered just below the phase transition, but still retain significant degrees of freedom well below Tc.
X-ray diffraction studies
ImMg crystallizes in the monoclinic system in the P21/n space group with lattice parameters a = 12.1246(4) Å, b = 12.2087(5) Å, c = 12.4991(4) Å, β = 91.39(1)° at 296 K (Table S1, ESI†). The space group is different from that reported by Wang et al.32 (P21/c), but it is in agreement with the crystal structure of ImMn reported by Pato Dolán et al.31 Therefore, ImMg is isostructural with ImMn; however, its lattice parameters are slightly smaller compared to ImMn (a = 12.3034(4) Å, b = 12.4408(4) Å, c = 12.8156(4) Å, β = 91.190(2)° at 295 K31). The Mg(HCOO)3− ions form a perovskite-like architecture, which accommodates HIm+ templates. There are two independent imidazolium cations in the asymmetric unit. Both interact with the Mg-formate framework through the N–H⋯O and C–H⋯O hydrogen bonds of a medium strength. The donor to acceptor distances in the N–H⋯O bonds range from 2.751(3) to 2.873(3) Å; the C–H⋯O interactions are weaker, with donor to acceptor distances of 3.111(4) and 3.176(4) Å (Table S3, ESI†). Similar N⋯O distances, ranging from 2.779(2) to 2.846(2) Å, were reported for ImMn.31 The imidazolium cations are prone to temperature-induced librations and rotations.37,38 Herein, the hydrogen bonds are strong enough to preserve the rotations. Fig. S3 (ESI†) shows both imidazolium cations in the ellipsoid representation and their placement in the crystal cavities. Large displacement parameters at room temperature indicate the presence of a substantial motion, wherein the most expected are the in-plane librations. In both ImMg and ImMn, the basal planes of the HIm+ are situated nearly parallel to the (111) and (−111) planes of the perovskite-like cell. The symmetry center results in the antiparallel arrangement of the dipole moments associated with each imidazolium cation. In addition, two inequivalent A and B cations form two substructures spontaneously polarized in the antiparallel directions. Pato Dolan et al. postulated the antiferroelectric character of ImMn based on the arrangement of the imidazolium dipole moments.31 This study provides additional evidence supporting the antiferroelectric character of the low-temperature phase in both crystals.Fig. 2 illustrates the distribution of the HIm+ dipole moments in the ImMg at room temperature. In this compound, the phase transition at Tc = 451 K is associated with a reduction of the unit cell size. Fig. S4 (ESI†) presents the reciprocal lattice of ImMg at room temperature and at 460 K. At 460 K, the hkl layers with l = 2n + 1 vanish, indicating a halving of the c lattice parameter. The monoclinic symmetry is preserved and the new metrics are: a = 12.261(7) Å, b = 12.290(4) Å, c = 6.280(4) Å, β = 90.62(5)°. The reduction of the unit cell size destroys the antiferroelectric order of the dipoles in both sublattices. Herein, we have to add that the complete analysis of the crystal structure of ImMg at 460 K was not possible due to the rapid decomposition of the single-crystals, even though they were protected in the capillary. Nevertheless, the data collected were sufficient to define without any doubts the metrics of the new phase. This was additionally confirmed by high-temperature powder X-ray diffraction. Fig. S6–S8 (ESI†) present diffractograms of ImMg and ImMn measured at high temperatures. La Bail fits in both phases of both crystals were carried out using the monoclinic unit cells. The most evident difference between the high- and low-temperature patterns detected for ImMg and ImMn is the vanishing of the (−1−11), (−111), (1−11) and (111) diffraction peaks after the phase transition, signifying the reduction of the unit cell size.
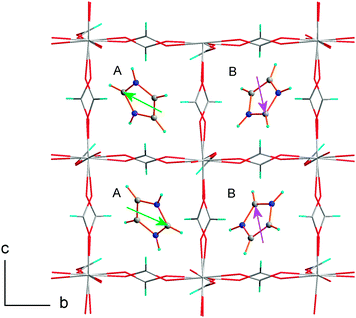 | ||
| Fig. 2 1/2a, b, c unit cell of ImMg at room temperature. Along the c axis, there is an antiparallel setting of the HIm+ dipole moments. The A and B mark two inequivalent substructures. | ||
These findings stay opposite to the recently published data for ImMn.32 Wang et al. postulated that at Tc = 438 K symmetry increases from monoclinic to tetragonal. However, their tetragonal cell choice skips a number of measured diffraction peaks and the lattice parameters, especially the angles, depart significantly from the tetragonal ones, observe Fig. S5 (ESI†). Furthermore, the calculated powder diagram based on the tetragonal structure differs substantially from the measured data presented both in this study and by Wang et al.32 Finally, the experimental powder diffractograms presented by Wang et al. for the high-temperature phase of ImMn at 443, 453 and 463 K show the presence of strong peaks characteristic of the decomposed sample (see Wang et al.32 and our diffractogram of ImMn measured at 503 K, Fig. S7, ESI†).
Dielectric measurements
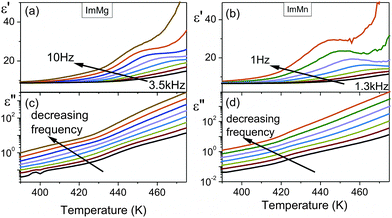
Fig. 3 shows that the temperature dependence of the dielectric permittivity for ImMg and ImMn are similar, i.e., ε′ decreases with increasing frequency at all temperatures and this type of behavior is a characteristic feature of polar dielectric materials. The rapid increase in the imaginary part of the dielectric permittivity with temperature clearly confirms that temperature starts to activate conductivity in the investigated samples. The plots of ε′ vs. temperature indicate the broad dielectric anomalies in the vicinity of the phase transition temperatures. The strong frequency dispersion of these anomalies implies a relaxor nature of electric ordering in the investigated samples. An observation of a similar broad peak in ε′ was recently reported for ImMn by Wang et al., but they did not observe a conductivity process.32 It is worth noting, however, that conductivity above room temperature is often observed for compounds containing the imidazole group.39Based on the values of the activation energy and the relaxation times, it is possible to find a reason of the observed processes. To distinguish the local dielectric relaxation from long-range electrical conductivity in the investigated samples, a frequency domain was used. The data obtained from impedance spectroscopy technique can be analyzed in terms of four equivalent formalisms: electric modulus M*, impedance Z*, admittance Y*, and permittivity ε*. The observed conductivity process can be well observed when the data are presented in the electric modulus representation.40 The advantage of this approach over the classical impedance Bode plots formalism is that M* diminishes the electrode capacitance effects and simply allows for the conductivity process analysis.41 The modulus spectra M′ and M′′ for ImMg and ImMn are depicted in Fig. 4. The imaginary part of the electric modulus exhibits a characteristic peak, which corresponds to the so-called conductivity relaxation that moves towards higher frequencies during heating. The peaks are broader and more asymmetric rather than symmetric, as predicted by an ideal Debye behavior.
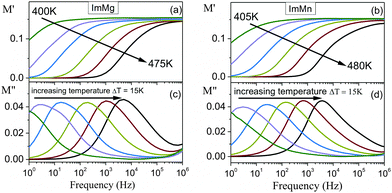 | ||
| Fig. 4 Frequency dependence of the real M′ and imaginary M′′ parts of the electric modulus for ImMg (a and c) and ImMn (b and d). | ||
The relaxation times, τ (=1/ωmax), obtained from the maximum of M′′ at various temperatures, are presented in Fig. 5. The relaxation times can be characterized by approximately two linear functions, indicating two different thermally activated processes, which dominate the conductivity below, and above the phase transition. Thus, the Arrhenius law can be used to describe these data. The activation energies obtained are characteristic of the imidazole-based compounds, wherein the observed long-range conduction is explained by the ion jumping through defect sites.42
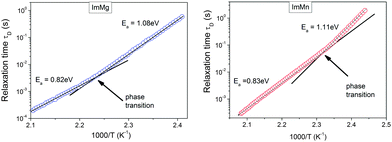 | ||
| Fig. 5 Arrhenius plot of the relaxation times for observed conductivity relaxation processes observed in the modulus spectra. The arrows indicate the phase transition temperatures. | ||
Temperature-dependent Raman and IR studies
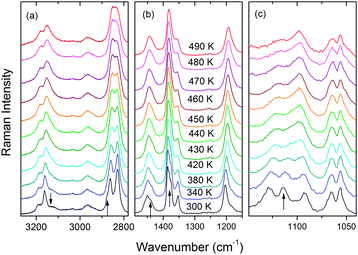
The temperature-dependent Raman and IR spectra of ImMg are presented in Fig. 6 and Fig. S9, S10 (ESI†). Table S4 (ESI†) lists the wavenumber of the observed modes together with the proposed assignment based on the vibrational data reported for the related formates, as well as imidazolium cation, 4-methylimidazolium cation and imidazolium salts.9,13,19,43–46Raman and IR spectra of ImMg show a few characteristic changes upon heating. First, the intensity of many bands and shoulders decrease continuously upon heating and disappear at higher temperatures. This behavior is observed for the Raman bands at 3126, 2877, 1440, 1376 and 1382 cm−1, as well as IR bands at 1459, 1115, 911 and 861 cm−1 (see Fig. 6 and Fig. S9, S10, ESI†). Furthermore, the 1114 and 1093 cm−1 Raman bands coalescence into one broad band at 1098 cm−1 (see Fig. 6 and Fig. S11b, ESI†). It is worth noting that all abovementioned IR bands and most of the Raman bands correspond to vibrations of the imidazolium cation. The decrease in the number of these bands above Tc indicates that the number of crystallographically distinct HIm+ cations changes from two in the low-temperature phase to only one in the high-temperature phase. In contrast to the bands of HIm+ cations, Raman and IR bands, corresponding to HCOO− ions, show very weak changes. The vibrational data are, therefore, consistent with a halving of the unit cell size and a preservation of the monoclinic symmetry, indicated by the X-ray diffraction data.
Raman and IR spectra also show that some bands exhibit pronounced broadening upon heating (Fig. 6 and Fig. S11c, ESI†). This behavior is especially pronounced for the IR (Raman) bands observed in the regions of 820–1150, 1440–1460 and 3110–3200 cm−1 (1090–1130 and 3110–3200 cm−1), which correspond to vibrations of the imidazolium cation, and lattice modes observed below 250 cm−1 (Fig. 6 and Fig. S9, S10, ESI†). This behavior proves that an increase in temperature leads to strong activation of the molecular motions of the whole imidazolium cation and the phase transition is associated with the disordering of HIm+ cations.
Raman data for ImMn (Fig. S12 and S13, ESI†) show that the observed changes upon heating are very similar to those observed for ImMg. The IR spectra of ImMn reported by Wang et al.33 also show similar changes upon heating as the ImMg spectra. This behavior points to the same phase transition mechanism for both compounds.
Pressure-dependent Raman scattering studies
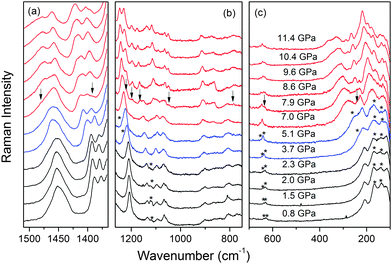
When the pressure increases, the spectra remain similar up to 2.3 GPa (Fig. 7). At 3.7 GPa, the shoulders become evident at 239 and 1237 cm−1. Furthermore, the weak band at 1121 cm−1 disappears, the 632 and 640 cm−1 exhibit a clear upshift by about 5 cm−1, the 139 cm−1 band shifts to lower wavenumber and the 174 cm−1 band (at 2.3 GPa) becomes broad and asymmetric at 3.7 and 5.1 GPa. Many modes also exhibit significant changes in the slope of the wavenumber vs. pressure (Fig. S14 and Table S5, ESI†). These changes suggest that ImMg exhibits some subtle structural change between 2.3 and 3.7 GPa. Because the discussed bands correspond to vibrations of the imidazolium cation and the lattice modes, this transition is most likely associated with a rearrangement of the imidazolium cations without any significant distortion of these cations and the magnesium formate framework.When the pressure increases to 7 GPa, new shoulders and weak bands appear at 242, 1389 and 1482 cm−1 (see Fig. 7). Their intensity strongly increases at 7.9 GPa and a number of other bands appear at 631, 786, 1048, 1164, 1195 and 1220 cm−1 (Fig. 7 and Fig. S14, ESI†). Many narrow bands appear also below 200 cm−1. The intensity of the new bands further increases upon compression to 8.6 GPa. The appearance of Raman bands is associated with the disappearance or strong decrease in intensity of the 218, 1094, 1147, 1241, 1408 cm−1 bands (values at 5.1 GPa, Fig. 7 and Fig. S14, ESI†). These changes indicate that ImMg starts to transform to a new high-pressure phase when pressure is close to 7.0 GPa and when the pressure reaches 8.6 GPa, this transformation is complete.
The observed changes in the Raman spectra allow us to obtain a few conclusions on structural changes occurring upon compression. First, the pressure coefficients α of the ambient pressure and intermediate phases are 2.13–4.57 and 0.36–0.86 cm−1 GPa−1 for the bands near 1380–1420 and 800 cm−1, related to the ν5 and ν3 modes of HCOO−, respectively (Table S5, ESI†). Because the ν5 (ν3) modes correspond to C–H (O–C–O) vibrations,13 their strong (weak) pressure dependence indicates that the C–H (C–O) bond lengths significantly (weakly) decrease upon compression up to 7 GPa. The C–O bonds are, however, strongly affected by the phase transition near 7 GPa, as evidenced by strong pressure dependence and splitting of the ν3 mode above 7 GPa. Second, doubling of the bands related to the ν5 and ν3 modes of HCOO− points to a doubling of the crystallographically unique formate ions. Therefore, the phase transition is associated with significant distortion of the metal formate framework. Third, the phase transition near 7 GPa leads to a strong increase in the number of bands related to the imidazolium cations (see region 1050–1250 cm−1 in Fig. 7). This behavior indicates a lowering of the crystal symmetry and an increase in the number of crystallographically unique imidazolium cations. Previous studies of related azetidinium zinc formate (AzZn) showed that the conformation of the azetidinium cation is strongly affected by the phase transition near about 2.4 GPa.28 Similarly, the structure of the protonated amine was strongly affected in dimethylammonium manganese formate (DMMg) upon the transformation near 5.6 GPa.29 ImMg shows this effect at higher pressures, i.e. close to 7 GPa, which suggests that its metal formate framework is stiffer than the frameworks of the mentioned above compounds. Fourth, imidazolium bands in the range of 1050–1250 cm−1 exhibit significant narrowing above 7 GPa. Furthermore, the Raman spectra do not show a decrease in intensity even at 11.4 GPa. This indicates that the imidazolium cations are well ordered in the high-pressure phase. Very different behavior was reported for [ND4][Zn(DCOO)3], AzZn and DMMg, for which strong broadening and a decrease in intensity of the Raman bands, which is indicative of partial amorphization, was observed close to 2.8, 7.4 and 6.8 GPa, respectively.26,28,29
The Raman spectra of ImMg during the decompression are presented in Fig. S14 (ESI†). The observed changes in the Raman spectra are similar to those observed upon compression, indicating reversibility of the phase transitions.
Conclusions
We report the synthesis and characterization of ImMg perovskite-type formate. This compound crystallizes in the monoclinic structure with an antiparallel arrangement of the dipole moments associated with two inequivalent imidazolium cations. DSC and detailed temperature-dependent X-ray diffraction, dielectric, Raman and IR data show that this compound undergoes a structural phase transition at 451 K, the highest temperature found for any metal formate framework. Although the crystal structure of the high-temperature phase could not be solved due to the poor chemical stability of this compound above 450 K, X-ray diffraction provides evidence that the monoclinic symmetry is preserved above Tc, but the c parameter is halved and the antiferroelectric order of the dipoles is destroyed. The Raman and IR data are consistent with the weak modification of the framework and halving of the unit-cell volume of the high-temperature phase. They also provide evidence that an increase in temperature leads to the strong activation of molecular motion of the imidazolium cation, i.e., order–disorder processes may contribute significantly to the phase transition mechanism. The dielectric data show that ImMg exhibits relaxor type of behavior and significant ionic conductivity. It is worth adding that our data also indicate the same phase transition mechanism for the ImMn compound. However, the X-ray diffraction and vibrational data are not consistent with those reported by Wang et al.,32i.e., an increase in symmetry to tetragonal.ImMg also exhibits very interesting behavior under hydrostatic compression. First, its Raman spectra remain very intense and the Raman bands are narrow up to the highest pressure reached in these experiments, i.e., up to 11.4 GPa. This behavior indicates that the magnesium formate framework does not collapse and the long-range order is well preserved, even at very high pressures. This behavior is quite different from that reported previously for metal formates templated by ammonium, azetidinium and dimethylammonium cations, which showed signs of significant disorder or even partial amorphization well below 10 GPa.26,28,29 Despite the strong stability of the ImMg framework, this compound undergoes two pressure-induced phase transitions near about 3 and 7 GPa. The first transition leads to subtle changes in the crystal structure; however, the second one leads to strong distortion of the magnesium formate framework.
Acknowledgements
The authors acknowledge the Brazilian National Research Council (CNPq) for a fellowship and the grant 401849/2013-9.References
- R. J. Kuppler, D. J. Timmons, Q.-R. Fang, J.-R. Li, T. A. Makal, M. D. Young, D. Yuan, D. Zhao, W. Zhuang and H.-C. Zhou, Coord. Chem. Rev., 2009, 253, 3042–3066 CrossRef CAS.
- R. Shang, S. Chen, Z. M. Wang and S. Gao, in Metal-Organic Framework Materials, ed. R. L. MacGillivray and C. M. Lukehart, John Wiley & Sons Ltd, 2014, pp. 221–238 Search PubMed.
- M. Guo, H.-L. Cai and R.-G. Xiong, Inorg. Chem. Commun., 2010, 13, 1590–1598 CrossRef CAS.
- Z.-Y. Du, T.-T. Xu, B. Huang, Y.-J. Su, W. Xue, C.-T. He, W.-X. Zhang and X.-M. Chen, Angew. Chem., Int. Ed., 2015, 54, 914–918 CrossRef CAS PubMed.
- (a) W. Zhang, H.-Y. Ye, R. Graf, H. W. Spiess, Y.-F. Yao, R.-Q. Zhu and R.-G. Xiong, J. Am. Chem. Soc., 2013, 135, 5230–5233 CrossRef CAS PubMed; (b) W.-J. Xu, S.-L. Chen, Z.-T. Hu, R.-B. Lin, Y.-J. Su, W.-X. Zhang and X.-M. Chen, Dalton Trans., 2015, 45, 4224–4229 RSC.
- J. M. Bermúdez-García, M. Sánchez-Andújar, S. Yáñez-Vilar, S. Castro-Garcia, R. Artiaga, J. López-Beceiro, L. Botana, A. Alegría and M. A. Señaris-Rodriguez, Inorg. Chem., 2015, 54, 11680–11687 CrossRef PubMed.
- (a) P. Jain, V. Ramachandran, R. J. Clark, H. D. Zhou, B. H. Toby, N. S. Dalal, H. W. Kroto and A. K. J. Cheetham, J. Am. Chem. Soc., 2009, 131, 13625–13627 CrossRef CAS PubMed; (b) M. Sánchez-Andújar, S. Presedo, S. Yáñez-Vilar, S. Castro-Garcia, J. Shamir and M. A. Señaris-Rodriguez, Inorg. Chem., 2010, 49, 1510–1516 CrossRef PubMed; (c) W. Wang, L.-Q. Yan, J.-Z. Cong, Y.-L. Zhao, F. Wang, S.-P. Shen, T. Zhou, D. Zhang, S.-G. Wang, X.-F. Han and Y. Sun, Sci. Rep., 2013, 3, 2024 CAS.
- (a) Y. Tian, J. Cong, S. Shen, Y. Chai, L. Yan, S. Wang and Y. Sun, Phys. Status Solidi RRL, 2014, 8, 91–94 CrossRef CAS; (b) Y. Tian, A. Stroppa, Y. Chai, L. Yan, S. Wang, P. Barone, S. Picozzi and Y. Sun, Sci. Rep., 2014, 4, 6062 CrossRef CAS PubMed.
- (a) M. Mączka, A. Gągor, B. Macalik, A. Pikul, M. Ptak and J. Hanuza, Inorg. Chem., 2014, 53, 457–467 CrossRef PubMed; (b) M. Maczka, M. Ptak and L. Macalik, Vib. Spectrosc., 2014, 71, 98–104 CrossRef CAS.
- M. Šimenas, A. Ciupa, M. Mączka, A. Pöppl and J. Banys, J. Phys. Chem. C, 2015, 119, 24522–24528 Search PubMed.
- (a) M. Kosa and D. T. Major, CrystEngComm, 2015, 17, 295–298 RSC; (b) G. P. Nagabhushana, R. Shivaramaiah and A. Navrotsky, J. Am. Chem. Soc., 2015, 137, 10351–10356 CrossRef CAS PubMed.
- (a) G. C. Xu, W. Zhang, X. M. Ma, Y. H. Hen, L. Zhang, H. L. Cai, Z. M. Wang, R. G. Xiong and S. J. Gao, J. Am. Chem. Soc., 2011, 133, 14948–14951 CrossRef CAS PubMed; (b) J. M. M. Lawler, P. Manuel, A. L. Thompson and P. J. Saines, Dalton Trans., 2015, 44, 11613–11620 RSC.
- (a) M. Mączka, A. Pietraszko, B. Macalik and K. Hermanowicz, Inorg. Chem., 2014, 53, 787–794 CrossRef PubMed; (b) M. Mączka, K. Szymborska-Małek, A. Ciupa and J. Hanuza, Vib. Spectrosc., 2015, 77, 17–24 CrossRef.
- (a) J. Xu, B. E. G. Lucier, R. Sinelnikov, V. V. Terskikh, V. N. Staroverov and Y. Huang, Chem. – Eur. J., 2015, 21, 14348–14361 CrossRef CAS PubMed; (b) M. Mączka, M. Ptak and S. Kojima, Appl. Phys. Lett., 2014, 104, 222903 CrossRef.
- S. Chen, R. Shang, K.-L. Hu, Z.-M. Wang and S. Gao, Inorg. Chem. Front., 2014, 1, 83–98 RSC.
- S. Chen, R. Shang, B.-W. Wang, Z.-M. Wang and S. Gao, Angew. Chem., Int. Ed., 2015, 54, 11093–11096 CrossRef CAS PubMed.
- (a) G. Kieslich, S. Kumagai, K. T. Butler, T. Okamura, C. H. Hendon, S. Sun, M. Yamashita, A. Walsh and A. C. Cheetham, Chem. Commun., 2015, 51, 15538–15541 RSC; (b) G. Kieslich, A. C. Forse, S. Sun, K. T. Butler, S. Kumagai, Y. Wu, M. R. Warren, A. Walsh, C. P. Grey and A. C. Cheetham, Chem. Mater., 2016, 28, 312–317 CrossRef CAS.
- (a) A. Stroppa, P. Barone, P. Jain, J. M. Perez-Mato and S. Picozzi, Adv. Mater., 2013, 25, 2284–2290 CrossRef CAS PubMed; (b) D. Di Sante, A. Stroppa, P. Jain and S. Picozzi, J. Am. Chem. Soc., 2013, 135, 18126–18130 CrossRef CAS PubMed.
- M. Mączka, A. Ciupa, A. Gągor, A. Sieradzki, A. Pikul, B. Macalik and M. Drozd, Inorg. Chem., 2014, 53, 5260–5268 CrossRef PubMed.
- (a) L. Cañadillas-Delgado, O. Fabelo, J. A. Rodríguez-Velamazán, M.-H. Lemėe-Cailleau, S. A. Mason, E. Pardo, F. Lloret, J.-P. Zhao, X.-H. Bu, V. Simonet, C. V. Colin and J. Rodríguez-Carvajal, J. Am. Chem. Soc., 2012, 134, 19772–19781 CrossRef PubMed; (b) A. Ciupa, M. Mączka, A. Gągor, A. Sieradzki, J. Trzmiel, A. Pikul and M. Ptak, Dalton Trans., 2015, 44, 8846–8854 RSC.
- M. Mączka, A. Sieradzki, B. Bondzior, P. Dereń, J. Hanuza and K. Hermanowicz, J. Mater. Chem. C, 2015, 3, 9337–9345 RSC.
- W. Li, Z. Zhang, E. G. Bithell, A. S. Batsanov, P. T. Barton, P. J. Saines, P. Jain, C. J. Howard, M. A. Carpenter and A. K. Cheetham, Acta Mater., 2013, 61, 4928–4938 CrossRef CAS.
- W. Li, M. R. Probert, M. Kosa, T. D. Bennett, A. Thirumurugan, R. P. Burwood, M. Parinello, J. A. K. Howard and A. K. Cheetham, J. Am. Chem. Soc., 2012, 134, 11940–11943 CrossRef CAS PubMed.
- B. Pato Dolán, M. Sánchez-Andújar, L. C. Gómez-Aguirre, S. Yáñez-Vilar, J. López-Beceiro, C. Garcia-Fernández, A. A. Haghighirad, F. Ritter, S. Castro-Garcia and M. A. Señaris-Rodriguez, Phys. Chem. Chem. Phys., 2012, 14, 8498–8501 RSC.
- L. C. Gómez-Aguirre, B. Pato Dolán, A. Stroppa, S. Yáñez-Vilar, L. Bayarjargal, B. Winkler, S. Castro-Garcia, J. Mira, M. Sánchez-Andújar and M. A. Señaris-Rodriguez, Inorg. Chem., 2015, 54, 2109–2116 CrossRef PubMed.
- M. Mączka, P. Kadłubański, P. T. C. Freire, B. Macalik, W. Paraguassu, K. Hermanowicz and J. Hanuza, Inorg. Chem., 2014, 53, 9615–9624 CrossRef PubMed.
- W. Li, A. Thirumurugan, P. T. Barton, Z. Lin, S. Henke, H. H. M. Yeung, M. T. Wharmby, E. G. Bithell, J. A. K. Howard and A. K. Cheetham, J. Am. Chem. Soc., 2014, 136, 7801–7804 CrossRef CAS PubMed.
- M. Mączka, T. Almeida da Silva, W. Paraguassu, M. Ptak and K. Hermanowicz, Inorg. Chem., 2014, 53, 12650–12657 CrossRef PubMed.
- M. Mączka, T. Almeida da Silva, W. Paraguassu and K. Pereira da Silva, Spectrochim. Acta, Part A, 2016, 156, 112–117 CrossRef PubMed.
- W. Zhang, Y. Cai, R.-G. Xiong, H. Yoshikawa and K. Awaga, Angew. Chem., Int. Ed., 2010, 49, 6608–6610 CrossRef CAS PubMed.
- B. Pato Dolán, L. C. Gómez-Aguirre, J. M. Bermúdez-García, M. Sánchez-Andújar, A. Fondado, J. Mira, S. Castro-Garcia and M. A. Señaris-Rodriguez, RSC Adv., 2013, 3, 22404–22411 RSC.
- F.-F. Wang, C. Chen, Y. Zhang, H.-Y. Ye, Q. Ye and D.-W. Fu, J. Mater. Chem. C, 2015, 3, 6350–6358 RSC.
- (a) C. Carabatos-Nedelec and P. Becker, J. Raman Spectrosc., 1997, 28, 663–671 CrossRef CAS; (b) M. Maczka, A. G. Souza Filho, W. Paraguassu, P. T. C. Freire, J. Mendes Filho and J. Hanuza, Prog. Mater. Sci., 2012, 57, 1335–1381 CrossRef CAS.
- G. M. Sheldrick, Acta Crystallogr., Sect. A: Found. Crystallogr., 2008, 64, 112–122 CrossRef CAS PubMed.
- (a) M. E. Lines and A. M. Glass, Principles and Applications of Ferroelectrics and Related Materials, Oxford University Press, 2001 Search PubMed; (b) K. Moriya, T. Matsuo, H. Suga and S. Seki, Bull. Chem. Soc. Jpn., 1979, 52, 3152–3162 CrossRef CAS.
- M. Mączka, A. Pietraszko, L. Macalik, A. Sieradzki, J. Trzmiel and A. Pikul, Dalton Trans., 2014, 43, 17075–17084 RSC.
- A. Gągor, A. Piecha, R. Jakubas and A. Miniewicz, Chem. Phys. Lett., 2011, 503, 134–138 CrossRef.
- M. Wȩcławik, A. G
![[a with combining cedilla]](https://www.rsc.org/images/entities/char_0061_0327.gif) gor, A. Piecha, R. Jakubas and W. Medycki, CrystEngComm, 2013, 15, 5633–5640 RSC.
gor, A. Piecha, R. Jakubas and W. Medycki, CrystEngComm, 2013, 15, 5633–5640 RSC. - S. Liu, Z. Yue and Y. Liu, Dalton Trans., 2015, 44, 12976–12980 RSC.
- A. Molak, M. Paluch, S. Pawlus, J. Klimontko, Z. Ujma and I. Gruszka, J. Phys. D: Appl. Phys., 2005, 38, 1450–1460 CrossRef CAS.
- J. C. Dyre, J. Appl. Phys., 1988, 64, 2456–2468 CrossRef.
- V. Tricoli, G. Orsini and M. Anselmi, Phys. Chem. Chem. Phys., 2012, 14, 10979–10986 RSC.
- K. Hasegawa, T. Ono and T. Noguchi, J. Phys. Chem. B, 2000, 104, 4253–4265 CrossRef CAS.
- A. A. Adesokan, G. M. Chaban, O. Dopfer and R. B. Gerber, J. Phys. Chem. A, 2007, 111, 7374–7381 CrossRef CAS PubMed.
- A. Piecha, R. Jakubas, G. Bator and J. Baran, Vib. Spectrosc., 2009, 51, 226–237 CrossRef CAS.
- K. Hołderna-Natkaniec, R. Jakubas and I. Natkaniec, Internal Dynamics of the Ferroelectric (C3N2H5)5Bi2Cl11 Studied by 1H NMR and IINS Methods, in Ferroelectrics – Characterization and Modeling, ed. M. Lallart, Intech, 2011, pp. 41–60 Search PubMed.
Footnote |
| † Electronic supplementary information (ESI) available: Tables S1–S5: crystal data for ImMg, IR and Raman wavenumber for the low- and high-temperature phases of ImMg together with the proposed assignment, and wavenumber intercepts at zero pressure and pressure coefficients for ambient and high-pressure phases of ImMg. Fig. S1–S15: DSC traces for ImMn and ImMg, heat capacity and entropy for ImMn, figure showing the presence of two symmetry-independent imidazolium cations in the perovskite-like cavities, the reciprocal lattice for ImMg, La Bail fits for low- and high-temperature phases of ImMn and ImMg, temperature-dependent IR and Raman spectra, wavenumber vs. pressure plots of the Raman modes observed in the ImMg crystal for compression experiment, high-pressure Raman spectra of ImMg recorded during the decompression experiment. CCDC 1455552. For ESI and crystallographic data in CIF or other electronic format see DOI: 10.1039/c6cp01353h |
| This journal is © the Owner Societies 2016 |

