 Open Access Article
Creative Commons Attribution 3.0 Unported Licence
Giant strain geared to transformable H-bonded network in compressed β-D-mannose†
Ewa
Patyk
,
Anna
Jenczak
and
Andrzej
Katrusiak
*
Department of Materials Chemistry, Faculty of Chemistry, Adam Mickiewicz University, Umultowska 89b, Poznań, Poland. E-mail: katran@amu.edu.pl
First published on 21st March 2016
Abstract
Networks of OH⋯O bonds in sugars and H2O ices are hardly affected by temperature, but transform under pressure. Such a transition at 1.95 GPa in β-D-mannose induces strong strain, non-destructive for the single crystal and easily visible in its shape deformation. This transition occurs at the lowest pressure of all sugars investigated at high pressure so far. The giant strain propagates perpendicular to the clearly visible zero-strain planes. The transition reconstructs the 3-dimensional pattern of OH⋯O hydrogen bonds, changes the conformation of molecules and preserves the space-group symmetry, like the analogous transitions of α-D-glucose and D-sucrose. However, new repulsing O⋯O contacts have been generated at high pressure in D-mannose only.
Introduction
Hydrogen bonds and their transformations are immanent parts of biological systems and life processes at the molecular level.1,2 Equally important are hydrogen bonds for geology and properties of rocks, as the minerals in Earth's crust contain more water than all seas and oceans.3,4 The immense pressure in the deep-crust deposits strongly distorts the structure of minerals and most of all their softest interactions, including the hydrogen bonds.5,6 Therefore, an understanding of the pressure effects on the hydrogen bonds is important. This information about H-bond transformations is also essential for designing new functional materials,7 such as ferroelectrics and relaxors8–10 for electronic applications, as well as for obtaining new polymorphs of pharmaceutical active ingredients.11–14 It was shown recently that pressure significantly modifies the 3-dimensional OH⋯O bond motifs of D-sucrose and α-D-glucose.15,16 In this respect sugars resemble the structures of H2O ices, similarly governed by OH⋯O bonds building the frameworks, hardly affected by temperature, but efficiently destabilized by pressure.17–20 However, in contrast to H2O ices, it is characteristic that high-pressure transitions of D-sucrose, at 4.8 GPa, and α-D-glucose, at 5.4 GPa, preserve their space-group symmetry and lattice translations, an occurrence encountered at high pressure for quite a few compounds.21–25 Presently, we found that a much lower pressure induces an exceptionally strong transformation between Phases I and II of β-D-mannose. Such major microscopic changes may lead to notable macroscopic effects.26,27 The giant strain in the transforming D-mannose crystal is clearly visible under the microscope (Fig. 1).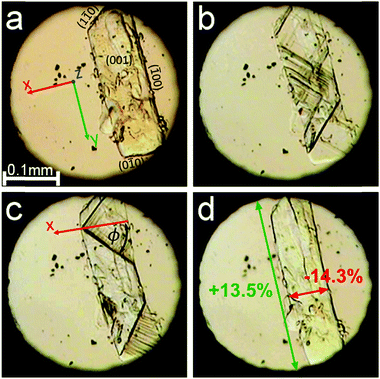 | ||
| Fig. 1 Single crystal of β-D-mannose in Phase I (a); transformation (b and c) to the single crystal of Phase II (d), shown in 4 clips from Movie S1 (ESI,† see also Movies S2–S4 showing the transformation of other samples). The size changes between Phases I and II along the crystal directions [x] and [y] are marked in red and green, respectively. The crystal axes and Miller indices of selected faces are indicated in plate (a). Angle ϕ, between the direction of zero strain and the x axis calculated according to eqn (1) in the text, is marked in plate (c). Small ruby chips for pressure calibration are scattered in the DAC chamber. | ||
D-Mannose, a close isomer of D-glucose, in its metabolism significantly differs from other sugars, mainly the energy carriers. Metabolized D-mannose is incorporated into glycolipids and glycoproteins, so its role is mainly structural.28 Moreover, it exhibits antibacterial and antiviral properties, hence, it is used to treat and prevent recurrent urinary tract infections.29,30 Owing to the slower absorption compared to other sugars, D-mannose travels in blood to the urinary tract, where it binds competitively to Escherichia coli bacteria, preventing their adhesion to mucous membranes and leading to their efficient excretion.31 For these and other reasons D-mannose is an important active pharmaceutical ingredient (API) often described as a healing sugar.32 The considerably different metabolism of D-mannose and D-glucose results from their different codes of H-donor and H-acceptor hydroxyl groups,33 convertible conformation and intermolecular interactions34 adjusting to various environments.35 The structure of the β-anomer of D-mannose crystals, despite its diverse applications,29,30 has remained unknown until now.
Experimental
A single crystal of β-D-mannose (analytical grade; from VEB Berlin-Chemie) was installed in a modified Merrill-Bassett diamond-anvil cell (DAC).36 The gasket was made of 0.3 mm tungsten foil with a spark-eroded hole, 0.3–0.4 mm in diameter. The sample position in the DAC chamber was fixed with a few cellulose fibers or a small amount of glue. Ethanol solution saturated with D-mannose, fluorinert or an n-pentane![[thin space (1/6-em)]](https://www.rsc.org/images/entities/char_2009.gif) :
:![[thin space (1/6-em)]](https://www.rsc.org/images/entities/char_2009.gif) isopentane (vol 1
isopentane (vol 1![[thin space (1/6-em)]](https://www.rsc.org/images/entities/char_2009.gif) :
:![[thin space (1/6-em)]](https://www.rsc.org/images/entities/char_2009.gif) 1) mixture was used as hydrostatic medium. Pressure inside the DAC was measured according to the ruby fluorescence method37 using an enhanced Photon Control Inc. spectrometer, affording an accuracy of 0.02 GPa. Diffraction data were collected at 0.48, 1.00, 1.60, 1.90, 2.02, 2.10 and 2.35 GPa (Fig. S1, ESI†) on a four-cycle KUMA KM4-CCD X-ray diffractometer using graphite monochromated MoKα radiation, and at 2.85 GPa using a 4-cycle Xcalibur diffractometer equipped with the EOS CCD detector and an AgKα radiation source. The crystal and DAC centering were performed according to the methods described previously.38 Low-temperature data (150–295 K range; Fig. S2, ESI†) were measured using a 4-circle SuperNova diffractometer, CuKα radiation, and an Oxford Cryosystems attachment. For data collection, UB-matrix determination, absorption correction and data reduction, the program CrysAlisPro39 was used. The crystal structures were solved by direct methods using SHELXS40 and refined with the program SHELXL.41 Hydrogen atoms were located by molecular geometry with Uiso equal to 1.2Ueq for C-carriers and 1.5Ueq for O-carriers, and with the O–H and C–H bond lengths fixed at the distances of 0.82 Å for oxygen atoms, and 0.98 or 0.97 Å for tertiary and secondary carbon atoms, respectively. To allow the gradual transformation of the sample between the phases and the recording of the visual changes in the β-D-mannose crystal shape (Fig. 1, Movies S1–S4, ESI†), a membrane DXR-GM DAC from Diacell was applied for fine-tuning the pressure through the phase transition.
1) mixture was used as hydrostatic medium. Pressure inside the DAC was measured according to the ruby fluorescence method37 using an enhanced Photon Control Inc. spectrometer, affording an accuracy of 0.02 GPa. Diffraction data were collected at 0.48, 1.00, 1.60, 1.90, 2.02, 2.10 and 2.35 GPa (Fig. S1, ESI†) on a four-cycle KUMA KM4-CCD X-ray diffractometer using graphite monochromated MoKα radiation, and at 2.85 GPa using a 4-cycle Xcalibur diffractometer equipped with the EOS CCD detector and an AgKα radiation source. The crystal and DAC centering were performed according to the methods described previously.38 Low-temperature data (150–295 K range; Fig. S2, ESI†) were measured using a 4-circle SuperNova diffractometer, CuKα radiation, and an Oxford Cryosystems attachment. For data collection, UB-matrix determination, absorption correction and data reduction, the program CrysAlisPro39 was used. The crystal structures were solved by direct methods using SHELXS40 and refined with the program SHELXL.41 Hydrogen atoms were located by molecular geometry with Uiso equal to 1.2Ueq for C-carriers and 1.5Ueq for O-carriers, and with the O–H and C–H bond lengths fixed at the distances of 0.82 Å for oxygen atoms, and 0.98 or 0.97 Å for tertiary and secondary carbon atoms, respectively. To allow the gradual transformation of the sample between the phases and the recording of the visual changes in the β-D-mannose crystal shape (Fig. 1, Movies S1–S4, ESI†), a membrane DXR-GM DAC from Diacell was applied for fine-tuning the pressure through the phase transition.
We found that β-D-mannose is compressed monotonically up to 1.95(2) GPa, when it undergoes a phase transition. It retains the symmetry of the orthorhombic space group P212121 and such phase transitions are described as isostructural, isomorphic, and sometimes as isosymmetric.21 Crystallographic data for β-D-mannose in ambient and high-pressure phases are compared in Table 1 (cf. Tables S1 and S2 in the ESI†) CCDC 1450799–1450809.
| C6H12O6 | Phase I | Phase I | Phase II | Phase II |
|---|---|---|---|---|
| Pressure (GPa) | 0.0001 | 1.90(2) | 2.02(2) | 2.85(2) |
| Crystal system | Orthorhombic | Orthorhombic | ||
| Space group | P212121 | P212121 | P212121 | P212121 |
| a (Å) | 5.6684(2) | 5.375(18) | 4.609(3) | 4.5744(6) |
| b (Å) | 7.5720(2) | 7.436(4) | 8.438(6) | 8.386(3) |
| c (Å) | 18.1425(5) | 17.849(8) | 17.40(9) | 17.212(16) |
| Volume (Å3) | 778.69(4) | 713(2) | 677(3) | 660.3(6) |
| Z | 4 | 4 | 4 | 4 |
| D x (g cm−3) | 1.537 | 1.678 | 1.768 | 1.812 |
| Final R1 (I > 4σI) | 0.0334 | 0.0723 | 0.0725 | 0.0718 |
Compressibility parameters βx = −1/x∂x/∂p, where x represents the measured unit-cell dimensions V, a, b, and c, have been fitted with quadratic polynomials for Phase I and the exponential decay function for Phase II (Table S7, ESI†). Intermolecular interactions have been analysed for the structures with C–H and O–H bonds normalized to the neutron-determined distances of 0.97 Å for oxygen atoms, and, respectively, 1.098 and 1.091 Å for tertiary and secondary carbon atoms, according to Allen and Bruno.42 Contacts have been classified as hydrogen bonds OH⋯O for O⋯O distances shorter than 3.04 Å (i.e. the sum of van der Waals radii43); as CH⋯O bonds for H⋯O distances shorter than 2.72 Å and for the C–H⋯O angle higher than 110°;43,44 and as H⋯H contacts for distances shorter than 2.4 Å.43
Results and discussion
The giant strain between β-D-mannose Phases I and II, the largest ever recorded for sugars, allows the clear visual observation of the transformation fronts, passing through the crystal (Fig. 1).The transition abruptly reduces the crystal volume by nearly 4% (Fig. 2). This transition strongly rearranges hydrogen bonds OH⋯O, and changes the molecular aggregation. In Phase I each molecule is the H-donor in five OH⋯O bonds and the H-acceptor in five H-bonds, and in Phase II seven independent OH⋯O bonds are formed, as illustrated in Fig. 3. The changes in the H-bonding pattern at 1.95 GPa are: (i) the bond O1H⋯O33645 is broken and in its place the bond O1H⋯O63655 is formed; (ii) the bond O2H⋯O53655 bifurcates45 to the oxygen atom O13655; (iii) the bond O3H⋯O44565 reverses its polarization to O3⋯HO44565, while the hydroxyl group O3H forms a bifurcated H-bond with atoms O34465 and O44465; (vi) from the broken O4H⋯O64555 bond hydroxyl O4H is redirected to the reversed bond O4H⋯O34465; and the hydroxyl O6H remains in the ambient–pressure bond O6H⋯O13545.
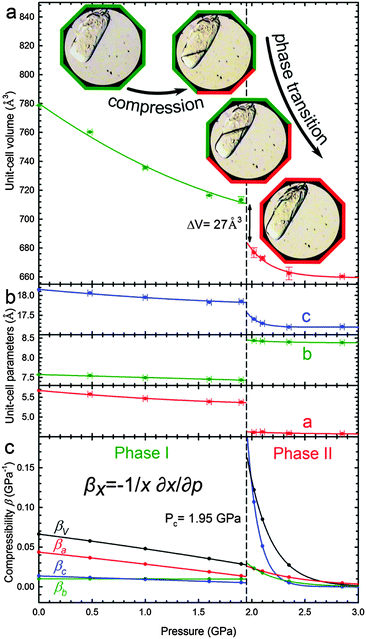 | ||
| Fig. 2 Pressure dependence of β-D-mannose (a) the unit-cell volume (Phases I and II marked in green and red, respectively); (b) unit-cell parameters; as well as (c) compressibilities βx calculated for x = a, b, c and V (Table S8, ESI†). Critical pressure Pc of the phase transition is marked by the vertical dashed line. The insets show a sample in Phases I (green octagonal rim) and II (red), as well as for the transforming stages (green/red). | ||
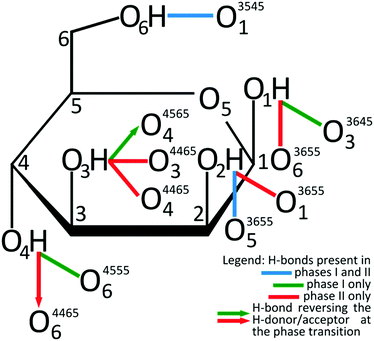 | ||
| Fig. 3 Transformation of OH⋯O hydrogen bonds between β-D-mannose Phases I and II schematically charted for H-donor groups onto Fisher's formula, complemented with H-accepting oxygen atoms, according to the legend below the drawing. ORTEP symmetry codes47 are explicitly listed in Table S3 (ESI†). | ||
It is noteworthy, that ten hydrogen bonds OH⋯O per each β-mannose molecule in Phase I form a 3-dimensional supramolecular network of multitude of interconnected rings and chains/helices.15 The network of 14 OH⋯O bonds per molecule in Phase II is even more complex. The unequivocal description of these networks exceeds the capabilities of graph descriptors used for the H-bonding patterns.46 Therefore we have applied the rigorous ORTEP symmetry codes for precisely describing the H-bonds of one molecule in its nearest vicinity. The symmetry transformations described in superscripts by 4-digit ORTEP codes47 are explicitly listed in Table S3 (ESI†).
The extent of the transformations in the OH⋯O bonding network is quantitatively illustrated in Fig. 4, where the O⋯O and H⋯O distances of all H-bonds present either in Phase I or II are plotted. The transition considerably changes the distances of intermolecular O⋯O contacts, even by more than 2 Å for the H-bonds O1H⋯O63655 and O3H⋯O34465 formed in Phase II. The shortest of contacts O⋯O and H⋯O are only compressed from 2.70 Å to 2.56 Å and from 1.80 Å to 1.67 Å, respectively. High pressure slightly reduces the C⋯O distances, however the shortest of (C)H⋯O contacts in Phase II are longer than those in Phase I (Fig. S8 in the ESI†). In this respect the shortest OH⋯O and CH⋯O bonds behave differently than in the pressure-transformed sucrose and glucose, where in Phase II the O⋯O distances are somewhat longer and CH⋯O bonds shorter than before the transition in Phase I. However, it is a common feature of the β-mannose, sucrose and glucose structures that the excess of H-acceptor sites (general for sugars) at high pressure is balanced by the formation of bifurcated OH⋯O bonds and new CH⋯O bonds.
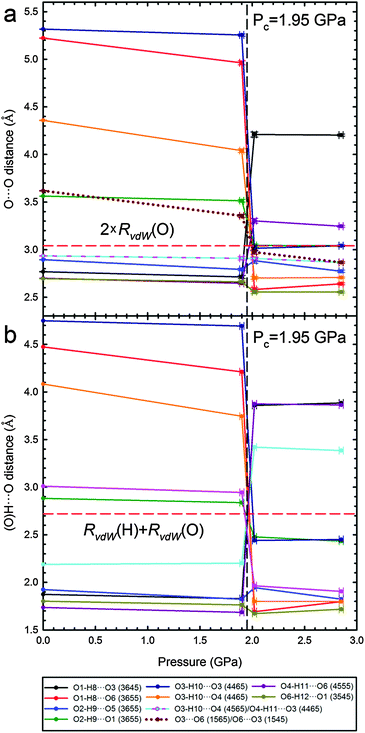 | ||
| Fig. 4 Pressure dependence of O⋯O (a) and H⋯O (b) short distances present either in β-D-mannose Phase I or II (cf. Table S4, ESI†). Lines joining points are only for guiding the eye. Horizontal red dashed lines indicate the sum of van der Waals radii (RvdW) O⋯O (3.04 Å) and H⋯O (2.72 Å).43 | ||
The shortest of H⋯H contacts in Phase II is only about 0.3 Å shorter than that in Phase I, and this compression is stronger than that observed for the other types of contacts (Fig. S11, ESI†). All dimensions of intermolecular contacts (Fig. 4 and Fig. S4–S11, ESI†) are consistent with the strong molecular rearrangement and compression of the structure. The reduction of H⋯H distances is consistent with the collapse of the small voids in Phase I. The voids are contained between the molecules arranged in a herringbone pattern in Phase I, while above 1.95 GPa the molecules are nearly parallel along the plane (bc), as can be seen in the structures and their schemes in Fig. 5. To accommodate these molecular rotations, the crystal shrinks along a and expands along b. Moreover, the longest dimension of the molecule between atoms O2 and O6 becomes better aligned along b within the (bc) plane just above the transition, which is consistent with the more pronounced compression of the crystal along c and expansion along b.
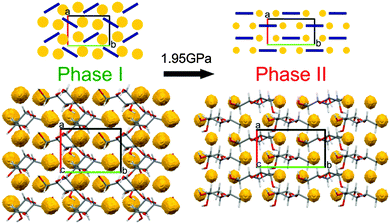 | ||
| Fig. 5 Molecular arrangement in β-D-mannose Phase I at 1.90(2) GPa and Phase II at 2.02(2) GPa viewed along the direction [001].48 Structural voids, calculated using program Mercury48 for the probe radius 0.7 Å and the grid spacing 0.1 Å, are marked in yellow. For clarity, the overlapping molecules have been omitted. In the schematic drawings (top), molecules are represented by navy-blue bars and structural voids by yellow circles. | ||
The considerable volume collapse at Pc allows the transition in β-mannose to be induced in gradually increasing portions of the sample crystal by a very slow increase in the volume reduction of the DAC chamber. In principle, if all the sample volume Vs collapses by ΔVs at Pc, then the reduction of the volume of the DAC chamber by ΔVs from the start of the transition does not increase the pressure in the DAC until the entire sample has transformed (Fig. 2a). This feature illustrates the possible applications of such materials for shock-absorbing or stress-compensating devices, but it also allows observations of the transition front propagating through the sample (Fig. 1).
It is remarkable that the giant strain in the β-mannose crystal does not break the sample. This infers that the transition front proceeds along the planes that minimize the local strain. It can be seen in Fig. 1 that the transition fronts only approximately progress along crystal planes (±1 ±1 0). For the crystal exhibiting negative linear compressibility, such as β-mannose, there are directions of zero strain and these directions can be calculated from the strain tensor between Phases I and II at Pc. For the transition in β-mannose the strongest strain is generated within the (ab) plane, due to the strongest positive and negative linear compression of the crystal along a and b, respectively, (Fig. 1). Owing to the coexistence of positive and negative linear compression within the (ab) plane, there are directions of zero strain along the planes parallel to (c) and inclined to axis a by angle ϕ
| ϕ = ±tg−1[(1 − aII2/aI2)/(bII2/bI2 − 1)]1/2, | (1) |
Conclusions
The high-pressure effects in β-D-mannose strikingly resemble those in D-sucrose and α-D-glucose. In all these systems, crystals transform with no space-group symmetry change, when the OH⋯O bonding network reconstructs to a tighter version, with more bifurcated OH⋯O bonds and more CH⋯O bonds compensating for the insufficient number of hydroxyl donors. The transition in β-D-mannose, occurring at considerably lower pressure than those in D-sucrose and α-D-glucose, induces a giant anomalous strain, which is coupled to the molecular rearrangement. It appears that the sophisticated geometric code of H-donors and H-acceptors in sugars controls the monotonic and discontinuous strain in the compressed crystals. The experimental measurements of crystal compression are presently available for three sugars only, however it is already an intriguing result that each of these sugars undergoes only one isostructural phase transition in the high-pressure range, where several phase transitions occur for the H2O ices, built of considerably simpler and more symmetric (C2v) molecules. It shows that the small H2O molecules cannot control the crystal symmetry and directions of crystal transformations in such a precise and unique way as the much more complex molecules of sugars. This conclusion is partly supported by the relatively scarce occurrence of polymorphs in sugars, reported—aside from the high-pressure transformations in α-D-glucose, β-D-mannose, and D-sucrose—for D-ribose,49 β-D-allose,50,51 lactose,52,53 α,α-trehalose54,55 and cellulose.56 Clearly, further studies are needed for the better understanding of external-stimuli effects and functional responses of H-bonded networks, which will ultimately allow their rational control and applications.Acknowledgements
We are grateful to Ms Michalina Anioła and Wielkopolska Center of Advanced Technologies for the experimental support, as well as to Mr Michał Andrzejewski and Mr Michał Kaźmierczak for their assistance in recording and editing movies included in the ESI.†Notes and references
- G. A. Jeffrey and W. Saenger, Hydrogen Bonding in Biological Structures, Springer, Berlin, Heidelberg, 1994, ch. 1, pp. 3–14, ch. 19, pp. 351–393 Search PubMed.
- G. R. Desiraju and T. Steiner, The Weak Hydrogen Bond: In Structural Chemistry and Biology, Oxford University Press, Oxford, 2001, ch. 5, pp. 343–440 Search PubMed.
- B. Schmandt, S. D. Jacobsen, T. W. Becker, Z. Liu and K. G. Dueker, Science, 2014, 344, 1265 CrossRef CAS PubMed.
- D. G. Pearson, F. E. Brenker, F. Nestola, J. McNeill, L. Nasdala, M. T. Hutchison, S. Matveev, K. Mather, G. Silversmit, S. Schmitz, B. Vekemans and L. Vincze, Nature, 2014, 507, 221 CrossRef CAS PubMed.
- N. Noguchi, T. Moriwaki, Y. Ikemoto and K. Shinoda, Am. Mineral., 2012, 97, 134 CrossRef CAS.
- P. F. Zanazzi, M. Montagnoli, S. Nazzareni and P. Comodi, Am. Mineral., 2007, 92, 655 CrossRef CAS.
- G. Resnati, E. Boldyreva, P. Bombicz and M. Kawano, IUCrJ, 2015, 2, 675 CrossRef CAS PubMed.
- L. Kong, L. Wang, S. Zhang, O. Tschauner, Y. Zhao, W. Yang, H. Liu and H.-K. Mao, Appl. Phys. Lett., 2012, 101, 062904 CrossRef.
- T. Aoyama, K. Yamauchi, A. Iyama, S. Picozzi, K. Shimizu and T. Kimura, Nat. Commun., 2014, 5, 4927 CrossRef CAS PubMed.
- M. Szafrański, CrystEngComm, 2014, 16, 6250 RSC.
- F. P. A. Fabbiani, G. Buth, D. C. Levendis and A. J. Cruz-Cabeza, Chem. Commun., 2014, 50, 1817 RSC.
- F. P. A. Fabbiani, D. R. Allan, W. I. F. David, A. J. Davidson, A. R. Lennie, S. Parsons, C. R. Pulham and J. E. Warren, Cryst. Growth Des., 2007, 7, 1115 CAS.
- M. A. Neumann, J. van de Streek, F. P. A. Fabbiani, P. Hidber and O. Grassmann, Nat. Commun., 2015, 6, 7793 CrossRef CAS PubMed.
- E. V. Boldyreva, T. P. Shakhtshneider, H. Ahsbahs, H. Sowa and H. Uchtmann, J. Therm. Anal. Calorim., 2002, 68, 437 CrossRef CAS.
- E. Patyk, J. Skumiel, M. Podsiadło and A. Katrusiak, Angew. Chem., Int. Ed., 2012, 51, 2146 CrossRef CAS PubMed.
- E. Patyk and A. Katrusiak, Chem. Sci., 2015, 6, 1991 RSC.
- C. G. Salzmann, P. G. Radaelli, B. Slater and J. L. Finney, Phys. Chem. Chem. Phys., 2011, 13, 18468 RSC.
- B. Kamb and B. L. Davis, Proc. Natl. Acad. Sci. U. S. A., 1964, 52, 1433 CrossRef CAS.
- J. D. Londono, W. F. Kuhs and J. L. Finney, J. Chem. Phys., 1993, 98, 4878 CrossRef CAS.
- R. J. Hemley, A. P. Jephcoat, H. K. Mao, C. S. Zha, L. W. Finger and D. E. Cox, Nature, 1987, 330, 737 CrossRef CAS.
- A. Jayaraman, Phys. Rev., 1965, 137, A179 CrossRef CAS; K. Gesi, Phase Transitions, 1992, 40, 187 CrossRef; A. G. Christy, Acta Crystallogr., Sect. B: Struct. Sci., 1995, 51, 753 CrossRef.
- W. Cai and A. Katrusiak, Nat. Commun., 2014, 5, 4337 CAS.
- D. Paliwoda, K. Kowalska, M. Hanfland and A. Katrusiak, J. Phys. Chem. Lett., 2013, 4, 4032 CrossRef CAS.
- J. Zhao, L. Wang, D. Dong, Z. Liu, H. Liu, G. Chen, D. Wu, J. Luo, N. Wang, Y. Yu, C. Jin and Q. Guo, J. Am. Chem. Soc., 2008, 130, 13828 CrossRef CAS PubMed.
- S. V. Goryainov, E. V. Boldyreva, M. B. Smirnov, H. Ahsbahs, V. V. Chernyshev and H.-P. Weber, Dokl. Phys. Chem., 2003, 390, 154 CrossRef CAS.
- Ž. Skoko, S. Zamir, P. Naumov and J. Bernstein, J. Am. Chem. Soc., 2010, 132, 14191 CrossRef PubMed.
- M. Lusi and J. Bernstein, Chem. Commun., 2013, 49, 9293 RSC.
- R. H. Herman, Am. J. Clin. Nutr., 1971, 24, 488 CAS.
- B. Kranjčec, D. Papeš and S. Altarac, World J. Urol., 2014, 32, 79 CrossRef PubMed.
- D. Porru, A. Parmigiani, C. Tinelli, D. Barletta, D. Choussos, C. Di Franco, V. Bobbi, S. Bassi, O. Miller, B. Gardella, R. E. Nappi, A. Spinillo and B. Rovereto, J. Clin. Urol., 2014, 7, 208 CrossRef.
- S. Vanwetswinkel, A. N. Volkov, Y. G. J. Sterckx, A. Garcia-Pino, L. Buts, W. F. Vranken, J. Bouckaert, R. Roy, L. Wyns and N. A. J. Van Nuland, J. Med. Chem., 2014, 57, 1416 CrossRef CAS PubMed.
- E. I. Mondoa, Sugars That Heal: The New Healing Science of Glyconutrients, Random House Publishing Group, New York, 2008, ch. 2, pp. 20–37 Search PubMed.
- K. H. Nam, M. W. Sung and K. Y. Hwang, Biochem. Biophys. Res. Commun., 2010, 391, 1131 CrossRef CAS PubMed.
- T. Tomašić, S. Rabbani, M. Gobec, I. M. Raščan, Č. Podlipnik, B. Ernst and M. Anderluh, MedChemComm, 2014, 5, 1247 RSC.
- J. F. Nagle, M. Mille and H. J. Morowitz, J. Chem. Phys., 1980, 72, 3959 CrossRef CAS.
- L. Merrill and W. A. Bassett, Rev. Sci. Instrum., 1974, 45, 290–294 CrossRef.
- H. K. Mao, J. Xu and P. M. Bell, J. Geophys. Res.: Solid Earth, 1986, 91, 4673 CrossRef CAS.
- A. Budzianowski and A. Katrusiak, in High-Pressure Crystallography, ed. A. Katrusiak and P. McMillan, Springer, Netherlands, 2004, pp. 101–112 Search PubMed.
- Oxford Diffraction, Oxford Diffraction Ltd., Xcalibur CCD system, CrysAlis Software system, Version 1.171, 2004.
- G. M. Sheldrick, Acta Crystallogr., Sect. A: Found. Crystallogr., 2008, 64, 112 CrossRef CAS PubMed.
- G. M. Sheldrick, Acta Crystallogr., Sect. C: Struct. Chem., 2015, 71, 3 CrossRef PubMed.
- F. H. Allen and I. J. Bruno, Acta Crystallogr., Sect. B: Struct. Sci., 2010, 66, 380 CrossRef CAS PubMed.
- A. Bondi, J. Phys. Chem., 1964, 68, 441 CrossRef CAS.
- E. Arunan, G. R. Desiraju, R. A. Klein, J. Sadlej, S. Scheiner, I. Alkorta, D. C. Clary, R. H. Crabtree, J. J. Dannenberg, P. Hobza, H. G. Kjaergaard, A. C. Legon, B. Mennucci and D. J. Nesbitt, Pure Appl. Chem., 2011, 83, 1637 CAS.
- G. A. Jeffrey and S. Takagi, Acc. Chem. Res., 1978, 11, 264 CrossRef CAS.
- M. C. Etter, J. C. MacDonald and J. Bernstein, Acta Crystallogr., Sect. B: Struct. Sci., 1990, 46, 256 CrossRef.
- C. K. Johnson, ORTEPII. Report ORNL-5138, TN: Oak Ridge National Laboratory, Memphis, 1976.
- C. F. Macrae, I. J. Bruno, J. A. Chisholm, P. R. Edgington, P. McCabe, E. Pidcock, L. Rodriguez-Monge, R. Taylor, J. van de Streek and P. A. Wood, J. Appl. Crystallogr., 2008, 41, 466 CrossRef CAS.
- D. Šišak, L. B. McCusker, G. Zandomeneghi, B. H. Meier, D. Bläser, R. Boese, W. B. Schweizer, R. Gilmour and J. D. Dunitz, Angew. Chem., Int. Ed., 2010, 49, 4503 CrossRef PubMed.
- L. M. J. Kroon-Batenburg, P. van der Sluis and J. A. Kanters, Acta Crystallogr., Sect. C: Cryst. Struct. Commun., 1984, 40, 1863 CrossRef.
- P. A. Bonnet, J. van de Streek, A. V. Trask, W. D. S. Motherwell and W. Jones, CrystEngComm, 2004, 6, 535 RSC.
- C. Platteau, J. Lefebvre, F. Affouard and P. Derollez, Acta Crystallogr., Sect. B: Struct. Sci., 2004, 60, 453 Search PubMed.
- C. Platteau, J. Lefebvre, F. Affouard, J.-F. Willart, P. Derollez and F. Mallet, Acta Crystallogr., Sect. B: Struct. Sci., 2005, 61, 185 Search PubMed.
- G. A. Jeffrey and R. Nanni, Carbohydr. Res., 1985, 137, 21 CrossRef CAS PubMed.
- H. Nagase, N. Ogawa, T. Endo, M. Shiro, H. Ueda and M. Sakurai, J. Phys. Chem. B, 2008, 112, 9105 CrossRef CAS PubMed.
- A. Isogai, M. Usuda, T. Kato, T. Uryu and R. H. Atalla, Macromolecules, 1989, 22, 3168 CrossRef CAS.
Footnote |
| † Electronic supplementary information (ESI) available: Detailed experimental and structural data; detailed information about intermolecular interactions; and multimedia files illustrating crystal shape changes. CCDC 1450799–1450809. For ESI and crystallographic data in CIF or other electronic format see DOI: 10.1039/c6cp01286h |
| This journal is © the Owner Societies 2016 |
