 Open Access Article
Target geometry and rigidity determines laser-induced cavitation bubble transport and nanoparticle productivity – a high-speed videography study
Sebastian
Kohsakowski
ab,
Bilal
Gökce
*a,
Rie
Tanabe
c,
Philipp
Wagener
ab,
Anton
Plech
d,
Yoshiro
Ito
c and
Stephan
Barcikowski
ab
aUniversity of Duisburg-Essen, Technical Chemistry I and Center of Nanointegration Duisburg-Essen (CENIDE), Universitaetsstrasse 7, Essen, D-45141 Germany. E-mail: bilal.goekce@uni-due.de
bNanoEnergieTechnikZentrum – NETZ, Carl-Benz-Straße 199, Duisburg, D-47057, Germany
cNagaoka University of Technology, Department of Mechanical Engineering, 1603-1, Kamitomioka, Nagaoka, Niigata 940-2188, Japan
dInstitute for Photon Science and Synchrotron Radiation, KIT Karlsruhe, Germany
First published on 27th May 2016
Abstract
Laser-induced cavitation has mostly been studied in bulk liquid or at a two-dimensional wall, although target shapes for the particle synthesis may strongly affect bubble dynamics and interfere with particle productivity. We investigated the dynamics of the cavitation bubble induced by pulsed-laser ablation in liquid for different target geometries with high-speed laser microsecond videography and focus on the collapse behaviour. This method enables us observations in a high time resolution (intervals of 1 μs) and single-pulse experiments. Further, we analyzed the nanoparticle productivity, the sizes of the synthesized nanoparticles and the evolution of the bubble volume for each different target shape and geometry. For the ablation of metal (Ag, Cu, Ni) wire tips a springboard-like behaviour after the first collapse is observed which can be correlated with vertical projectile motion. Its turbulent friction in the liquid causes a very efficient transport and movement of the bubble and ablated material into the bulk liquid and prevents particle redeposition. This effect is influenced by the degree of freedom of the wire as well as the material properties and dimensions, especially the Young's modulus. The most efficient and largest bubble movement away from the wire was observed for a thin (500 μm) silver wire with velocities up to 19.8 m s−1 and for materials with a small Young's modulus and flexural rigidity. We suggest that these observations may contribute to upscaling strategies and increase of particle yield towards large synthesis of colloids based on targets that may continuously be fed.
Introduction
The interest in nanoparticles (NPs) synthesized by pulsed laser ablation in liquids (PLAL) has increased in recent years due to the simplicity and versatility of the process.1,2,6 Nowadays, a wide range of nanoparticle colloids can be synthesized by PLAL, e.g. metals,1,3 alloys,4,5 and ceramics.7 This process may show numerous advantages in comparison to conventional methods such as high surface purity,6 perfect stoichiometry with homogenous (solid solution) interparticle composition,5 and colloidal stability without the need for any additives.3,6 A drawback of PLAL is the limited productivity that is mostly just relevant for the laboratory-scale. Previous studies have shown that the productivity is influenced by the target geometry and constrained by the laser-induced cavitation bubble which occurs during ablation in liquids.8–10 To increase the productivity of PLAL the whole synthesis process has to be investigated in detail. The formation mechanism of NPs during the laser-based synthesis is an interesting aspect that has motivated many researchers to perform various studies in this field.11,12 In particular, with respect to increasing NP productivity, the laser-induced plasma and dynamics of the generated cavitation bubble during the process play critical and important roles. The process begins with the plasma being ignited by the interaction of the laser pulse with a solid target. Its temperature and extension have a significant effect on the size and productivity of the generated nanoparticles,13 as well as on the induced cavitation bubble. Within the first microseconds the plasma transfers its energy to the surrounding medium13 inducing the vaporization of the medium and the formation of a cavitation bubble.3,14 The formation of the cavitation bubble is one of the main stages involved in PLAL which is considered as an important intermediate in nanoparticle formation. Besides being a productivity-limiting factor9,10 some aspects of the cavitation bubble are still not well understood due to limited possibilities to observe the interior of the bubble. Already in the early state (few μs), cavitation bubble shape follows the shape of the plasma cloud,11 and on that time scale from the first microsecond formation of atom clusters starts.15 Hence, studies and observations of the cavitation bubble dynamics with different strategies have multiplied in the last years to shed light on the nanoparticle formation mechanism.12,16,17 De Giacomo et al. examined the formation and dynamics of cavitation bubbles for bulk and wire-shaped targets by integrating (multiple pulse) shadowgraphic imaging and showed differences in the collapse behaviour and the bubble shape.8 They observed that after the collapse of the cavitation bubble on the bulk target, the material (NPs and permanent gas bubbles) stayed close to the surface whereas in case of the wire ablation the matter was ejected in a mushroom-like jet causing a more efficient transport into the liquid.8 Consequently, the productivity of the synthesis was increased by using the wire-shaped target.18 With their imaging method the authors were not able to visualize the nanoparticle formation, but could explain the NP productivity differences between the two target geometries.8,18 To get a deeper understanding of the NPs formation within the cavitation bubble Wagener et al. observed the nanoparticle formation process by small angle X-ray scattering (SAXS).16 Two different species (primary particles and agglomerates) were detected during the ablation process inside the cavitation bubble and a maximum of the agglomerates concentration was determined after the first collapse. Even after its rebound, the second bubble still contains nanoscale matter,16 and X-ray radiography imaging revealed its internal density distribution recently.19 From these studies it was evident that the dynamics and size of the cavitation bubble during the ablation process have a considerable influence on the formation process of the NPs. All of these studies have provided new insights in the NPs formation process, however, most of them were determined in multi-pulse (stroboscopic) experiments and/or used integration over a certain number of laser pulses.8,16,17 Hence, due to pulse-to-pulse variation and small changes on the target surface, integration artefacts cannot be excluded. Caused by intrinsic fluctuations in the laser pulse energy during the integrative recording of images some changes in the bubble size occur which makes it difficult to follow point-to-point correlations in time series of images. Furthermore, particle shielding of the successive laser pulses, changes in the focus position and small changes in the texture of the target can also occur. These factors cause additional fluctuations in the measurements. Therefore, high-speed laser videography during single pulse irradiation is a powerful approach to deepen the understanding of the evolution and the dynamics of the cavitation bubble without the disadvantages of other visible-light methods. Previous studies with this technique have resolved several processes occurring during PLAL, in a time resolution of less than 0.1 ns and minimum image intervals of 1000 ns.12,20,21 In this work, we demonstrate a detailed observation of the bubble dynamics for different target geometries and focus our work on the collapse behaviour of the cavitation bubble, which has a major influence on the NP productivity since the NPs are dispersed into the liquid during this collapse.8,16 Higher NP productivities were observed for the wire geometry ablation due to an efficient transport of nanoparticles into the liquid caused by a backward impulse of the wire and a subsequent displacement of the cavitation bubble from the wire surface.18 Due to this effect the generated NPs are transported rapidly from the ablation area into the liquid which reduces the particle shielding of subsequent laser pulses.12,18 Moreover, the redeposition of generated NPs on the target surface is reduced, which has an additional influence on the productivity.8Experimental
Therefore, to understand the influence of the displacement of the cavitation on the productivity, we study the bubble displacement from a wire surface for different wire diameters (500 μm and 1 mm), ablation positions (middle, tip) and materials (silver, copper, nickel) with single-pulse videography. The bubble dynamics are quantified and mathematically correlated to material properties. The experimental set-up is schematically shown in Fig. 1, more details about the videography part can be found elsewhere.12,22 An 1 mm thin silver plate as bulk target reference and different wires are placed in a Millipore-Q II water-filled container ensuring a liquid layer of 7 mm above the targets. As shown in Fig. 1, following three geometries are used; (I) two-side clamped wire with ablation at the middle (II) wire tip ablation and (III) bulk target ablation. These geometries are indicated as situations I–III in the following.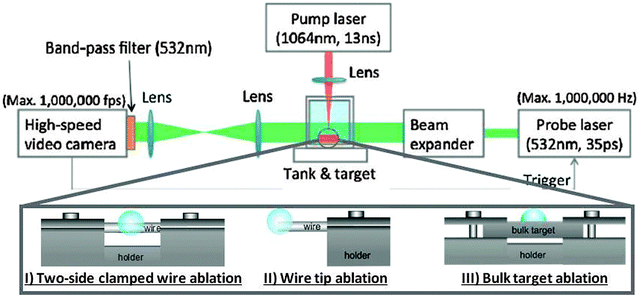 | ||
| Fig. 1 Sketch of the experimental set-up of high-speed videography for different target geometries (I), (II), (III) allowing to compare effects of target shape and ablation site/type of fixation. | ||
The pulsed laser (1064 nm Nd:YAG, 10 ns) is operated in single-pulse mode and focussed on the targets by a lens (f = 35 mm) with a constant pulse energy of 10 mJ.
Results & discussion
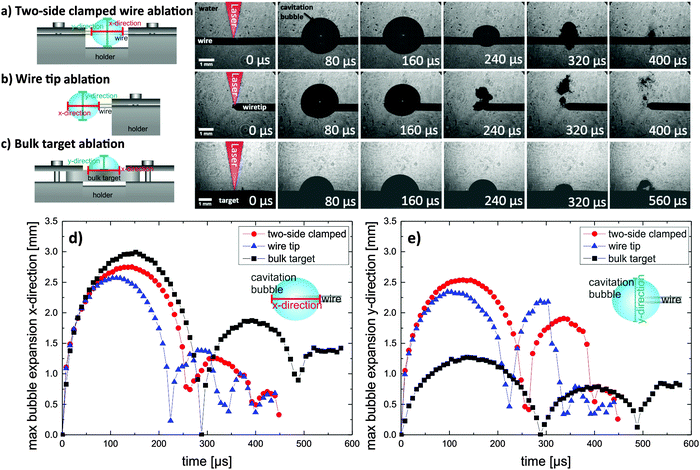
Fig. 2a–c shows the time-dependent evolution of the cavitation bubbles for the schematically shown different types of target fixation and geometries. In Fig. 2a and b the cavitation bubble is induced by a single laser pulse on a 500 μm diameter silver wire, while a bulk silver plate is used in Fig. 2c. From these images the dimensions of the cavitation bubbles and differences between the three target geometries are extracted. Fig. 2d summarizes the maximal bubble expansion in the x-direction, which is the horizontal expansion of the bubble along the wire axis or the bulk target plane. For both situations the data show expansion and subsequent shrinkage phases which end up with a cavitation bubble collapse. Fig. 2e shows the same dynamics for the maximal expansion of the cavitation bubble in y-direction, i.e. perpendicular to the target axis/plane. First, situation I is examined (Fig. 2a). Here, the cavitation bubble expansion appears nearly spherical (aspect ratio a = y/x = 1), in comparison, the situation III (Fig. 2c) leads to an ideal hemispherical-like shape. As shown in Fig. 2d, both dynamics are similar up to the time of collapse, also the lifetimes of the cavitation bubbles differ only by 10% (290 μs for bulk target, 260 μs for two-side clamped wire). In contrary to the bubble rebound in situation III which keeps hemisphericity, rebound in situation II at t = 260 μs undergoes a significant change in the shape perpendicular to the wire (y-direction) causing the loss of sphericity (Fig. 2e).However, as evident at t = 400 μs in Fig. 2a, in situation I the material stays close to the wire surface, which is comparable to the process for the bulk target (Fig. 2c, t = 560 μs). The NP formation process cannot be fully identified by videography. The dark areas remaining after the final bubble collapse may contain nanoparticles, but also permanent-gas bubbles. However, it can be assumed that the generated NPs are in majority only ejected into the liquid after the collapse. Prior results have shown that NPs are trapped in the cavitation bubble until the final collapse.16 The generated NPs stay very close to the target surface and this could cause a redeposition of the particle on the target surface.8 Moreover, the small secondary bubbles seen in Fig. 2a and c and the generated NPs are acting as absorption centers for subsequent laser pulses triggering the formation of nanobubbles23 or microbubbles and a decrease of the effective pulse energy arriving the target.12 This effect can be reduced if the secondary bubble and NP transport into the liquid is more efficient. Such an efficient release has been observed for wire targets8 or ultra-thin (0.1 mm) metal plates.24 A very efficient displacement of the cavitation bubble from the wire surface is reported in literature and has been described as a mushroom-shaped bubble jet.8 In our images, such a mushroom-shaped jet can only be identified in situation 2 in Fig. 2. In contrast with ref. 8 the cavitation bubble of one single shot could be observed with high time resolution and without any integration. Moreover the wires were clamped in two different fixation situations which have a different influence on the collapse and displacement behavior.
In the next step of geometry II, the influence of different target fixation and position of ablation on the collapse dynamics is investigated. For this purpose, a 500 μm silver wire is fixed at one end and ablated with the laser at the wire's tip. The second series in Fig. 2b shows the evolution of the cavitation bubble at the wire tip. Here, the lifetime of the cavitation bubble until collapse is further shortened compared to the dynamics on the two-side clamped wire. In comparison with the bulk target the lifetime of the bubble is decreased by 23%. Although the bubble at the tip is 14% less wide than the bubble on the bulk target, it is spherical and therefore has a 48 ± 1% higher bubble liquid–gas interface area (3247 ± 12 mm2) in comparison with the hemispherical bubble at the bulk target (1553 ± 10 mm2). The expansion of the bulk target bubble in the x-direction is around 0.4 mm higher than the bubble expansion at the wire tip. This distinct expansion caused the 64 μs longer lifetime of the bubble in geometry III. The evolution of the bubble volume for all three situations are shown in Fig. 3.
For the wire geometries the maximum bubble volume is increased by about 16%, and the wire geometries also have a slightly higher integral volume in comparison to the bulk target. From the evolution of the bubble volume the thermodynamic parameters pressure and temperature inside the cavitation bubble can be estimated. Since the integral and maximum bubble volume are in the same order of magnitude we can estimate that also the pressure and temperature evolution over time for all three are comparable which each other. A trend towards higher integral and maximal volume of bubble in case of the wire geometry (elastic target) is observed. Amans stated a complete adiabatic vaporization process in case of the bulk target,25 here the difference in the maximal bubble volume indicated that cavitation bubble thermodynamics may depend on target geometry, in particular if energy may be transferred to the target (i.e. in 2D case) or is conserved longer for oscillation of the bubble. Based on our results one could state that the adiabaticity of the process is decreased in the following order: wire tip > two-side clamped wire > bulk target.
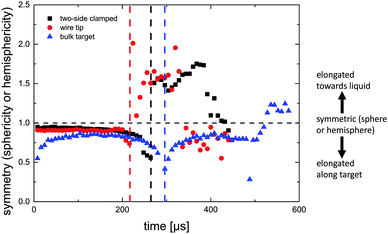
Fig. 4 shows the symmetry (sphericity or hemisphericity) of the three different cavitation bubbles generated on the three different target fixation and geometries. Symmetry factor S is defined as the aspect ratio (expansion in y-direction/expansion in x-direction) relative to the aspect ratio for an ideal sphere (a = 1) and an ideal hemisphere (a = 1/2). If the data are closer to the ideal value of 1 a higher sphericity and hemisphericity is determined. Fig. 4 shows significant differences for different target and fixation geometries.
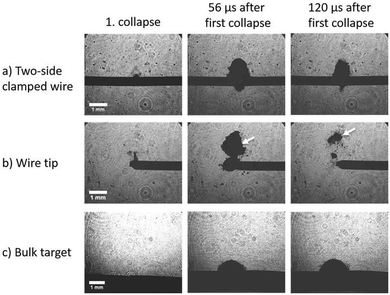
In both wire ablation processes the bubble is nearly spherical and very close to an ideal sphere until the first cavitation bubble collapses. After the collapse on the wire tip and two-side clamped wire the symmetry numbers are first slightly reduced, but then strongly increase as seen in Fig. 4. This change reflects the significant deformation of the cavitation bubble in y-direction (Fig. 2e). The symmetry plot of the bulk target ablation shows an evolution comparable to the well-known oscillation of a PLAL-induced cavitation bubble.19,26 The highest symmetry factor (S = 0.86) here is achieved during the maximum expansion. In the first frames after the laser pulse, deformations of the bubble at the edge of the area in close vicinity of the target can be observed which cause this deviation from an ideal hemisphericity and might be related to an oblique plasma. The symmetry factor again decreases while approaching the collapse, which is a well-known observation of flattening collapse phase.18 Revival (rebound) of the bubble in this last case also follows an oblique geometry. The observations are exemplified in Fig. 5, where the images of the first collapse and the images at t = 56 μs and t = 120 μs after the first collapse are displayed. The collapse moment and the images of the bulk target (Fig. 5c) and the two-side clamped wire (Fig. 5a) are similar and comparable in shape and position of the material. This changes strongly for the wire tip.
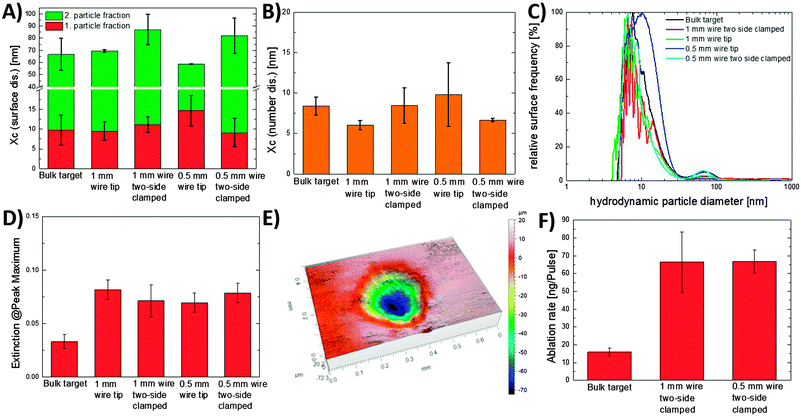
Here, visible in Fig. 5b a considerable displacement of the bubble in the y-direction can be observed as marked in the figure by a white arrow. De Giacomo et al. reported that this displacement takes place immediately before the bubble collapse at a maximum strain in the bubble–wire system.8 This displacement is the reason for the deformation of the bubble in y-direction after the collapse. 56 μs and 120 μs after the first collapse the rebouncing cavitation bubble and thus the material is located close to the target surface in all geometries except for the wire tip where a significantly efficient transport and displacement of the bubble and matter is observed. Apparently, the displacement of the bubble from the wire is more efficient if the wire is only fixed on one end acting as a springboard and thus allows for larger excursion. The different collapse dynamics and behaviour could have an impact on the NPs size and productivity. In order to verify this effect, we performed multi-pulse experiments (1000 pulses, with 10 mJ) with the three different target fixations and silver as material. The productivity of the NPs was characterized via UV/Vis and 3D confocal microscopy and the sizes were characterized by analytical disc centrifugation. The results are shown in Fig. 6.
Despite the different collapse dynamics and differences in the bubble dynamics number weighted hydrodynamic diameters for all geometries are in the range of 6–14 nm. Moreover, the highest productivities during the multi-pulse experiment were observed for the ablation of the wires. In contrast to the bulk target the productivity and extinction of the peak maximum of all wire situations were increased up to a factor of 2.5. For the two-side clamped wire and the wire tip ablation the productivity and extinction are at the same level. Therefore the influence of the spring-board like behavior during the wire tip ablation does not lead to an increase in NPs productivity compared to the two-side clamped wire. This is not surprising, since the bubble and NPs are transported upwards into the liquid towards the incident laser beam. Therefore for all geometries the generated daughter bubbles and particles can interact with the subsequent laser pulses and cause shielding. The spring-board like effect will have a more pronounced influence on the productivity if a liquid flow perpendicular to the target is applied which will result in a more effective transportation away from the ablation zone and area of the laser beam.
Hence, the displacement of the cavitation bubble is not only induced by the geometry of the target but also by its degree of freedom in movement. Due to this elastic target effect the bubble movement can be considered as a function of the wire diameter and the wire material. In order to quantitatively describe this movement, we describe the bubble movement away from the wire tip in first approximation as a vertical projectile motion of a sphere with friction. The movement until the turning point can be modelled by the following equation:27
ẏ(t) = a![[thin space (1/6-em)]](https://www.rsc.org/images/entities/char_2009.gif) tan(tan−1 tan(tan−1![[thin space (1/6-em)]](https://www.rsc.org/images/entities/char_2009.gif) v0/a − gt/a) v0/a − gt/a) | (1) |
y(t) = (a2/g){ln![[thin space (1/6-em)]](https://www.rsc.org/images/entities/char_2009.gif) cos([g(tu − t)]/a) − ln cos([g(tu − t)]/a) − ln![[thin space (1/6-em)]](https://www.rsc.org/images/entities/char_2009.gif) cos(gtu/a)} cos(gtu/a)} | (2) |
![[thin space (1/6-em)]](https://www.rsc.org/images/entities/char_2009.gif) tan−1
tan−1![[thin space (1/6-em)]](https://www.rsc.org/images/entities/char_2009.gif) v0/a for the turning point time (t) and a = (mg/k)1/2, the movement y(t) from the wire surface in the liquid can be approximated by:
v0/a for the turning point time (t) and a = (mg/k)1/2, the movement y(t) from the wire surface in the liquid can be approximated by:y(t) = (m/k)[ln![[thin space (1/6-em)]](https://www.rsc.org/images/entities/char_2009.gif) cos(tan−1(v0 − gt)/(mg/k)1/2) − ln cos(tan−1(v0 − gt)/(mg/k)1/2) − ln![[thin space (1/6-em)]](https://www.rsc.org/images/entities/char_2009.gif) cos(tan−1(v0/(mg/k)1/2))] cos(tan−1(v0/(mg/k)1/2))] | (3) |
| With k = (1/2)ρCwA | (4) |
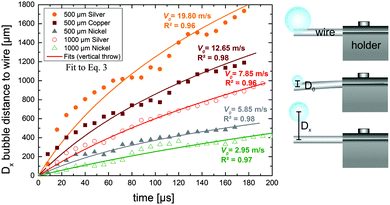 | ||
| Fig. 7 Temporal evolution of the displacement of the cavitation bubble center from the wire tip after the first collapse for different wire materials and dimensions (on the left). The data were fitted with vertical projectile motion fits (eqn (3)) to determine the initial bubble velocity. Schematic illustration of the determination method of the bubble movement (on the right). | ||
For wires with a diameter of 500 μm the movement of the bubble away from the surface is 19–32% faster than the bubble movement from wires with twice the diameter. Hence, the initial velocity v0 of the cavitation bubble for the thinner wires (500 μm) of silver and nickel are 40–50% higher compared to the velocities determined for the 1 mm wires. The expansion and oscillation of the cavitation bubble induced on the wire surface provides a downward movement of the wire from its initial position, which is induced by a pressure gradient directed towards the wire. The rebound of the wire causes a flow and pressure gradient into the liquid directed away from the wire surface which caused the displacement from the surface and movement of the cavitation bubble into the liquid. During this downward movement and rebound process of the wire a formation of a vortex inside the liquid in the vicinity to the wire surface is observed. For thicker wires the downward movement is smaller which results in a lower pressure gradient away from the wire surface and an inefficient movement of the bubble into the liquid. This behavior is comparable to the observations of a laser-induced cavitation bubble near an elastic boundary.28,29
In addition to the influence of the wire thickness, the influence of the material, particularly the elasticity at given geometry, on the bubble movement has to be investigated. The largest bubble movement and therefore the highest initial bubble acceleration were determined for the 500 μm silver wire. The springboard-like behaviour provides a short-term acceleration of the bubble. The oscillation of the values and the deviation from the projectile motion fits is a result of the asymmetric cavitation bubble oscillation in the liquid. As shown in Table 1, the determined initial velocities from the vertical projectile motion fits can be correlated with the Young's modulus E. The data of Table 1 show a clear dependence of the bubble velocity on the Young's modulus, where smaller Young's modulus provide higher initial bubble velocities. The displacement of the cavitation bubble from the wire surface is induced by an impulse of the wire and an application of kinetic energy (E = 1/2m × v02 with m: virtual bubble mass and v0: initial bubble velocity) that is necessary to transport the bubble into the liquid. In order to make an accurate statement about the function of this parameter the square root of the initial velocities can be plotted against the Young's modulus of the different wires, as can be seen in Fig. 8a.
| Material | Wire diameter [μm] | Bubble velocity v0 [m s−1] | Young's modulus [GPa]30 |
|---|---|---|---|
| Silver | 500 | 19.80 | 83 |
| Copper | 500 | 12.65 | 110 |
| Nickel | 500 | 5.85 | 200 |
| Silver | 1000 | 7.85 | 83 |
| Nickel | 1000 | 2.95 | 200 |
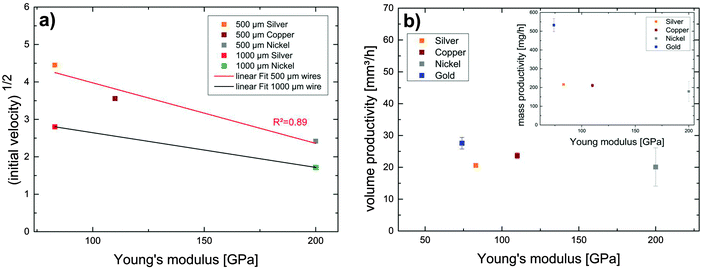 | ||
| Fig. 8 Influence of the Young's modulus of the wires on the initial velocity of the vertical projectile motion (a) and on the NP productivity (b). | ||
The square root of the initial velocities decreases with increasing Young's modulus. The data can be fitted by linear functions for the two diameters. Because of the elasticity and plasticity difference of the two thicknesses the data were plotted separately. Moreover, the oscillation of the 1 mm wires is reduced caused by the higher stiffness of these wires. Fig. 8 shows that with higher Young's modulus the square root of the initial bubble velocity is decreased proportional to the kinetic energy, which is necessary for the displacement of the cavitation bubble. Summarizing, it was shown that the major difference of the cavitation at the wire tip compared to that of the other target geometries is the efficient ejection of the cavitation bubble and its rebound from the target, such that redeposition and laser shielding is minimized. The magnitude of this effect is determined by the stiffness of the wires and thus by wire diameter and Young's modulus. The bubble movement can be imagined to stem from two effects: (i) during the wire moving downwards a lateral curling flow takes place at the interface between bubble and wire, which creates a flow away from the target. Additionally (ii) during the back motion the springboard effect pushes the liquid and thus the bubble further away from the wire. Prerequisite for this effect is the freedom of movement (bending) of the wire. It is clear that this effect can have an impact on the NP productivity by multi-pulse laser ablation due of the efficient transport of the matter into the bulk liquid. Therefore, the productivity for different wire materials was measured (repetition rate: 5 kHz and pulse energy: 8 mJ) and are shown in Fig. 8b. In addition to the materials silver, copper and nickel, a gold wire was used as reference material. The data show a productivity decrease with increasing Young's modulus. At first appearance the volume ablation rate scales inversely with the Young's modulus. This suggests that the efficient transport of the matter into liquid by the displacement of the cavitation bubble has an impact on the productivity. But to confirm this trend more materials with Young's modulus smaller than 74 GPa (silver) have to be compared. Moreover, the productivity is influenced by a variety of different material parameters, for instance, the thermal diffusivity and conductivity of the material, the optical penetration depth in the material and for laser ablation with nanosecond laser certainly the mass-specific melting enthalpy. Also plasticity of the material is relevant for multiple pulse ablation, as permanent bending towards rear side of ablation has been observed during our productivity studies. Anyway, a more efficient transport of the matter into the bulk liquid is an important aspect to increase the productivity due to the prevention of the interaction of successive laser pulses and the pre-generated NPs and vapour bubbles12 and to reduce the redeposition of NPs on the target's surface.
Conclusion
High-speed imaging by laser videography is an efficient method to investigate the cavitation bubble dynamics with a high time resolution with single-shot experiments. Our studies showed that during laser ablation of targets in different geometries and fixation the cavitation bubble dynamics undergo similar mechanism including several expansions and shrinkage phases. Also, the bubble volume caused by the single-pulse ablation was in the same order of magnitude for all three geometries. Due to the difference in the maximal bubble volume we assume that the adiabaticity of the process is decreased in the following order: wire tip > two-side clamped wire > bulk target. It can be assumed that similar amount of NPs is initially produced inside the bubble, while differences in the yield are caused by subsequent dynamics. Big differences in the dynamics were observed for the collapse of the cavitation bubble when the target fixation was varied. In case of the wire irradiation the cavitation bubble was deformed perpendicular to the wire axis caused by the elasticity of the wire. An inefficient transport and movement of the material was observed as the wire was clamped at both ends due the limited flexibility of the wire in the sample holder. The most efficient transport of the cavitation bubble after the first collapse was observed when a wire tip was ablated by the laser.We observed a springboard-like behaviour of the wire and transport of the material into the liquid. Therefore, a more efficient transport of the NPs into the bulk liquid was observed for wire tip ablation in liquid. We could show that this efficient transport of material does lead to an increase in NP productivity. Despite the different collapse dynamics and differences in the bubble dynamics the same particle size of Ag-NPs was observed for all geometries.
The springboard-like effect is influenced by the wire diameter as well as the material due to differences in the Young's modulus. The bubble displacement could be described by a vertical projectile motion, from which initial velocities could be extracted. Highest initial velocities were observed for the thinner (500 μm) wires due to their stronger bending from their initial positions. For the bulk target and two-side clamped wire ablation the cavitation bubble stay close to the surface causing heat dissipation, and a redeposition of material on the surface and a decrease in laser-based NP productivity. Our studies allow us to shed light on the evolution and collapse behaviour of the cavitation bubble and correlation to NP productivity. The wire tip ablation shows a more efficient transport of the material into the bulk liquid. Note that wire feeders would allow continuous supply of target, perfectly matching the continuous NP synthesis process of PLAL, omitting any interruption by target replacement.
But there is still a challenge to find the best material parameters for increasing NP productivity. Due to the bending of the wire tip a drawback could be the change in the focus position and the reduction of the stability of the ablation process which results in a decrease in productivity. Bubble transport towards incident beam also calls for combination of liquid flow with wire feeder. Moreover, it has to be investigated if the springboard-like displacement of the cavitation bubble and its thereby effective oscillation on lifetime may have an influence on the NP growth mechanism of different NP materials.
Acknowledgements
This study was supported by the Deutsche Forschungsgemeinschaft (DFG) BA 3580/15-1/PL 325/8-1 and the German Federal Ministry of Education and Research (BMBF) within the young investigator competition NanoMatFutur (project INNOKAT, FKZ 03X5523). P. Schönfeld is acknowledged for discussions.References
- V. Amendola and M. Meneghetti, Phys. Chem. Chem. Phys., 2009, 11, 3805–3821 RSC.
- H. Zeng, S. C. Du, X.-W. Singh, S. A. Kulinich, S. Yang, J. He and W. Cai, Adv. Funct. Mater., 2012, 22(7), 1333–1353 CrossRef CAS.
- V. Amendola and M. Meneghetti, Phys. Chem. Chem. Phys., 2013, 15, 3027–3046 RSC.
- J. Jakobi, A. Menendez-Manjon, V. S. K. Chakravadhanula, L. Kienle, P. Wagener and S. Barcikowski, Nanotechnology, 2011, 22, 145601 CrossRef PubMed.
- A. Neumeister, J. Jakobi, C. Rehbock, J. Moysig and S. Barcikowski, Phys. Chem. Chem. Phys., 2014, 16, 23671–23678 RSC.
- S. Barcikowski and G. Compagnini, Phys. Chem. Chem. Phys., 2013, 15(9), 3022–3026 RSC.
- C. L. Sajti, R. Sattari, B. N. Chichkov and S. Barcikowski, J. Phys. Chem. C, 2010, 114(6), 2421–2427 CAS.
- A. De Giacomo, M. Dell'Aglio, A. Santagata, R. Gaudiuso, O. De Pascale, P. Wagener, G. C. Messina, G. Compagnini and S. Barcikowski, Phys. Chem. Chem. Phys., 2013, 15(9), 3083–3092 RSC.
- P. Wagener, A. Schwenke, B. Chichkov and S. Barcikowski, J. Phys. Chem. C, 2010, 114(17), 7618–7625 CAS.
- R. Streubel, S. Barcikowski and B. Gökce, Opt. Lett., 2016, 41(7), 1486–1489 CrossRef PubMed.
- A. Tamura, A. Matsumoto, K. Fukami, N. Nishi and T. Sakka, J. Appl. Phys., 2015, 117(17), 173304 CrossRef.
- R. Tanabe, T. T. P. Nguyen, T. Sugiura and Y. Ito, Appl. Surf. Sci., 2015, 351, 327–331 CrossRef CAS.
- M. Dell'Aglio, R. Gaudiuso, O. D. Pascale and A. D. Giacomo, Appl. Surf. Sci., 2015, 348, 4–9 CrossRef.
- A. D. Giacomo, M. Dell'Aglio, O. D. Pascale and M. Capitelli, Spectrochim. Acta, Part B, 2007, 62(8), 721–738 CrossRef.
- J. Lam, D. Amans, F. Chaput, M. Diouf, G. Ledoux, N. Mary, K. Masenelli-Varlot, V. Motto-Ros and C. Dujardin, Phys. Chem. Chem. Phys., 2014, 16, 963–973 RSC.
- P. Wagener, S. Ibrahimkutty, A. Menzel, A. Plech and S. Barcikowski, Phys. Chem. Chem. Phys., 2013, 15(9), 3068–3074 RSC.
- J. Tomko, J. J. Naddeo, R. Jimenez, Y. Tan, M. Steiner, J. M. Fitz-Gerald, D. M. Bubb and S. M. O'Malley, Phys. Chem. Chem. Phys., 2015, 17, 16327–16333 RSC.
- G. C. Messina, P. Wagener, R. Streubel, A. De Giacomo, A. Santagata, G. Compagnini and S. Barcikowski, Phys. Chem. Chem. Phys., 2013, 15, 3093–3098 RSC.
- S. Ibrahimkutty, P. Wagener, T. dos Santos Rolo, D. Karpov, A. Menzel, T. Baumbach, S. Barcikowski and A. Plech, Sci. Rep., 2015, 5, 16313 CrossRef CAS PubMed.
- T. T. P. Nguyen, R. Tanabe and Y. Ito, Appl. Phys. Express, 2013, 6(12), 122701 CrossRef.
- T. T. P. Nguyen, R. Tanabe and Y. Ito, Appl. Phys. A: Mater. Sci. Process., 2014, 116(3), 1109–1117 CrossRef CAS.
- R. Tanabe, H. Kusano and Y. Ito, Proc. SPIE, 2008, 7126, 71260M CrossRef.
- T. Katayama, K. Setoura, D. Werner, H. Miyasaka and S. Hashimoto, Langmuir, 2014, 30(31), 9504–9513 CrossRef CAS PubMed.
- A. Sasoh, K. Watanabe, Y. Sano and N. Mukai, Appl. Phys. A: Mater. Sci. Process., 2005, 80(7), 1497–1500 CrossRef CAS.
- J. Lam, J. Lombard, C. Dujardin, G. Ledoux, S. Merabia and D. Amans, Appl. Phys. Lett., 2016, 108(7), 074104 CrossRef.
- K. Sasaki, T. Nakano, W. Soliman and N. Takada, Appl. Phys. Express, 2009, 2(4), 0465011 Search PubMed.
- E. Di Benedetto, Classical Mechanics: Theory and Mathematical Modeling, Cornerstones, Birkhaeuser Boston, 2010 Search PubMed.
- S. J. Shaw, Y. H. Jin, T. P. Gentry and D. C. Emmony, Phys. Fluids, 1999, 11(8), 2437–2439 CrossRef CAS.
- E.-A. Brujan, K. Nahen, P. Schmidt and A. Vogel, J. Fluid Mech., 2001, 433, 251–281 CrossRef CAS.
- W. Haynes, CRC Handbook of Chemistry and Physics, CRC Press, 96th edn, 2015 Search PubMed.
| This journal is © the Owner Societies 2016 |

