
 Open Access Article
 This Open Access Article is licensed under a Creative Commons Attribution-Non Commercial 3.0 Unported Licence
Revealing nanoscale optical properties and morphology in perfluoropentacene films by confocal and tip-enhanced near-field optical microscopy and spectroscopy
Xiao
Wang
*a,
Katharina
Broch
bc,
Frank
Schreiber
b,
Alfred J.
Meixner
*a and
Dai
Zhang
*a
aInstitute of Physical and Theoretical Chemistry and LISA+, University of Tübingen, Auf der Morgenstelle 18, 72076 Tübingen, Germany. E-mail: xiao.wang@uni-tuebingen.de; alfred.meixner@uni-tuebingen.de; dai.zhang@uni-tuebingen.de
bInstitute of Applied Physics, University of Tübingen, Auf der Morgenstelle 10, 72076 Tübingen, Germany
cCavendish Laboratory, University of Cambridge, JJ Thomson Avenue, CB3 0HE Cambridge, UK
First published on 24th May 2016
Abstract
Combining high resolution optical microscopy and spectroscopy, we propose a novel, generally applicable and highly sensitive method for determining the local morphology in organic semiconductor thin films (e.g. perfluoropentacene (PFP)). An azimuthally or radially polarized doughnut mode (APDM or RPDM) laser beam is focused by a high numerical aperture parabolic-mirror to excite a diffraction limited volume of the PFP film with an electric field polarized either exclusively in-plane or dominantly out-of-plane (relative to the substrate). We find two distinct morphologies of thin PFP films: molecular aggregates and crystalline terraces. The well-defined dipole emission patterns observed from the molecular aggregates strongly suggest the presence of localized excitations. For both laser modes, we observe that for the PFP aggregates, the photoluminescence (PL) emission from the main electronic transition is blue-shifted by about 10 meV, as compared to that from the molecular terraces. For the C–C bending modes, the B3g at 1581 cm−1 (ν1) and the Ag at 1316 cm−1 (ν0), we observe a decrease of the intensity ratio (Iν1/Iν0) from 0.6 (terrace) to 0.15 (aggregate). Furthermore, the intensity ratios (IAPDM/IRPDM) of ν1 excited by different polarizations increase from 0.12 (terrace) to 0.73 (aggregate). These results indicate that the PFP molecules orient rather parallel to the substrate in the aggregates, whilst more upright in the terraces. Benefiting from the nanometer scale optical resolution offered by the tip-enhanced near-field optical method, we observe clear optical contrasts between the molecular aggregate and the terrace as well as individual layers within a terrace. Tip-enhanced optical spectra locally taken from the molecular terrace and the aggregate show similar blue-shift of the main PL peak and change in the Raman intensity with different polarizations as from the far-field assemble-measurements, which further confirms the different molecular orientations in these two morphologies.
Introduction
Organic semiconductor thin films have attracted increasing attention for applications in flexible electronic devices.1 An important point is the chemical tunability by attaching or replacing certain functional groups. Fluorination is an important strategy, e.g., to make the compounds more stable against oxidation, to shift the relevant energy levels, or to create donor–acceptor pairs with the hydrogenated parent compound.2–7 Perfluoropentacene (PFP, C22F14), a derivative of the prototype system pentacene (PEN, C22H14) with exchange of the hydrogen by fluorine, is an obvious choice of study in this context.2,8–11 Compared with PEN which is a p-type semiconductor, PFP behaves as an n-type material due to the strong electronegativity of fluorine, providing the opportunity for bipolar device applications. For achieving high device performance, the fundamental properties, such as local morphology, orientation and intermolecular coupling of molecules in the films are of great interest.12–19Although the crystal structure and the morphology of pure PFP thin films on various substrates can be investigated by X-ray diffraction (XRD) and atomic force microscopy (AFM),3,4,20 as well as other microscopic techniques,21 optical methods such as absorption,22–24 photoluminescence (PL)25 and infrared26 spectroscopy provide additional important information on the molecular energy levels and interaction in the films. Polarization-dependent micro-Raman spectroscopy provides valuable information of the molecular vibrations, and their modifications due to the local environment. For PEN, polarized Raman spectroscopy has been used to investigate the molecular orientation and the crystal phase of the films.27–29 Compared to linearly polarized laser beams, cylindrical vector beams, such as radially or azimuthally polarized doughnut modes (RPDM or APDM) provide distinct electric field distributions in the laser focus: a dominant out-of-plane electric field can be achieved with the RPDM whilst an exclusive in-plane electric field is produced with the APDM. Based on the polarization-dependent PL or Raman intensities, accurate and quantitative information about the molecular orientation can be obtained with diffraction-limited spatial resolution of typically half of the excitation laser wavelength.28,30 To further correlate details of the nanoscale morphology with optical properties, an optical resolution below the diffraction-limit is required which can be achieved by tip-enhanced near-field optical microscopy and spectroscopy.31,32 This technique provides images with an optical resolution down to several nanometers33–36 and sensitivities allowing for the detection of single molecules and single surface states.37–40
In this paper, we use a home-built parabolic-mirror assisted confocal and near-field optical microscope41–44 to study the optical properties and morphology of PFP films by PL and Raman microscopy and spectroscopy with high spatial resolution. We reveal the molecular orientations in different morphologies by analysing the intensity of different Raman vibrational modes with two distinct laser excitation polarizations.
Results and discussion
The topography (Fig. 1(a) and (b)) of the PFP film shows that the film mostly forms ordered molecular terraces. The topographic line profile (Fig. 1(c)) reveals 1.5 nm high steps corresponding to the length of an upright-oriented single PFP molecule.3 We also observe large PFP ‘aggregates’, by which we mean large, anisotropic features. The aggregates are typically about several tens of nanometers high and hundreds of nanometers long, as marked by the circle in Fig. 1(b). As the orientation and stacking of molecules can be revealed from their Raman and PL spectra, we study the nature of these two distinct morphologies by polarization-dependent confocal and near-field optical microscopy and spectroscopy.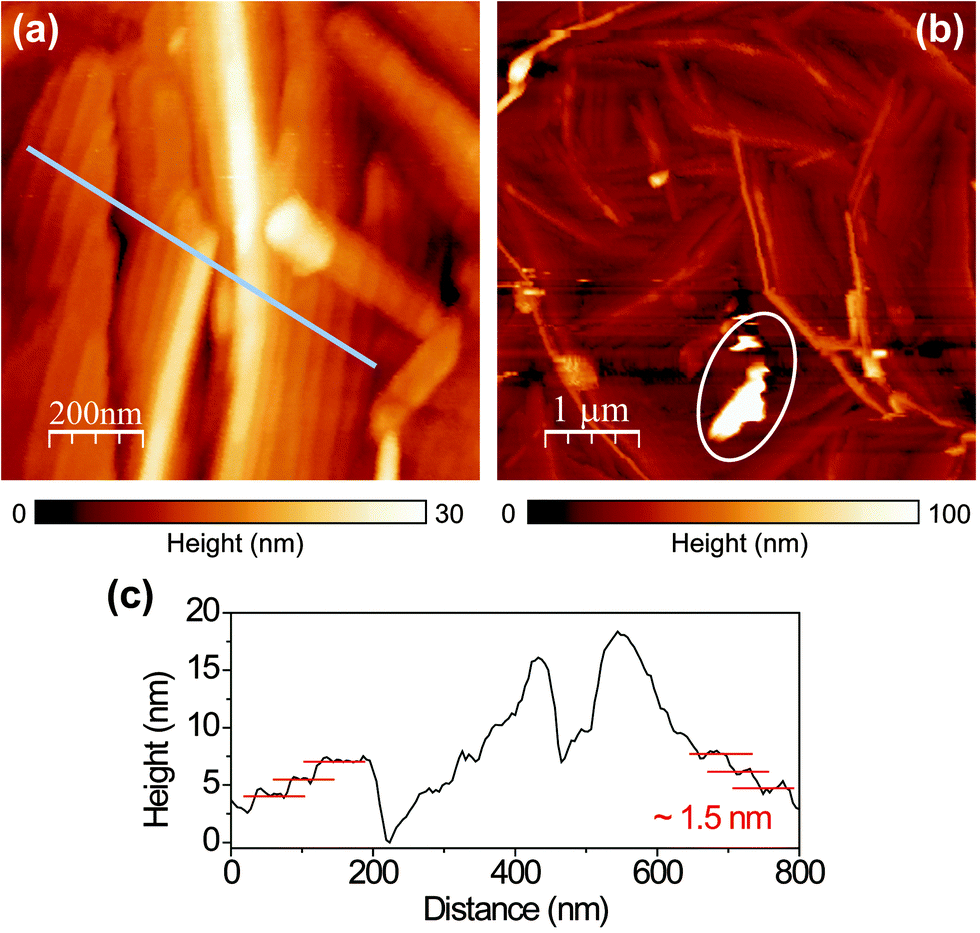 | ||
| Fig. 1 (a and b) Topographic images recorded by raster scanning a sharp gold tip of the near-field optical microscope over the surface of a PFP film. (c) A respective topographic line profile that is taken from the region indicated by the line in (a). Single PFP molecular steps of about 1.5 nm are clearly visible. | ||
We first perform topography-correlated confocal PL and Raman imaging and spectroscopy from molecular terraces and aggregates in the PFP film. Fig. 2(a) and (b) show confocal PL images (10 μm × 10 μm) of a PFP film excited with RPDM and APDM, respectively. In the focal volume of these polarization modes the PFP molecules are excited differently: mainly perpendicular to the substrate with RPDM and purely parallel to the substrate with APDM. In Fig. 2(a) and (b) we observe localized and diffraction-limited excitation patterns which have intensities which exceed the average PL by one order of magnitude. In general the PL excitation rate is proportional to |![[E with combining right harpoon above (vector)]](https://www.rsc.org/images/entities/i_char_0045_20d1.gif) ·
·![[D with combining right harpoon above (vector)]](https://www.rsc.org/images/entities/i_char_0044_20d1.gif) |, where is the excitation electric field and is the transition dipole moment. For the image obtained with RPDM we observe a bright and almost circular Airy disc pattern from the structure marked by the white arrow in Fig. 2(a). This pattern reflects the projection of the transition dipole moment parallel to the surface normal of the sample.45 When RPDM is switched to APDM, the pattern changes to two parallel lobes as marked by the white arrow in Fig. 2(b). In this case, the pattern reflects the direction of the transition dipole moment projected into the sample plane which orients along the two lobes as indicated by the white arrows (on both ends). Hence for a quasi-point-light source which could originate in the present case from structural defects or local excitations, we observe distinct coffee-bean shaped patterns which allow us to determine the orientation of a transition dipole moment as in the case of an isolated molecule.46,47
|, where is the excitation electric field and is the transition dipole moment. For the image obtained with RPDM we observe a bright and almost circular Airy disc pattern from the structure marked by the white arrow in Fig. 2(a). This pattern reflects the projection of the transition dipole moment parallel to the surface normal of the sample.45 When RPDM is switched to APDM, the pattern changes to two parallel lobes as marked by the white arrow in Fig. 2(b). In this case, the pattern reflects the direction of the transition dipole moment projected into the sample plane which orients along the two lobes as indicated by the white arrows (on both ends). Hence for a quasi-point-light source which could originate in the present case from structural defects or local excitations, we observe distinct coffee-bean shaped patterns which allow us to determine the orientation of a transition dipole moment as in the case of an isolated molecule.46,47
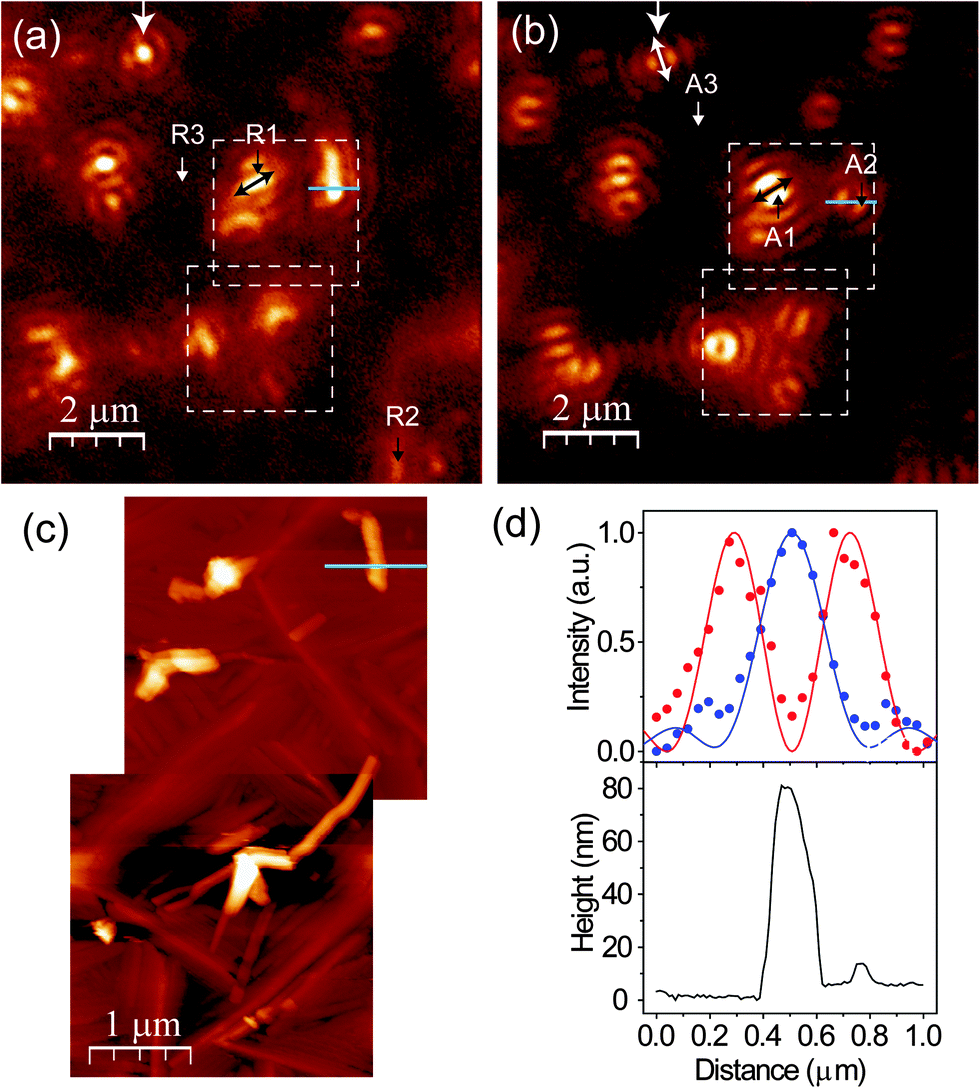 | ||
| Fig. 2 (a and b) Confocal PL images of the same sections of a PFP film recorded with RPDM and APDM, respectively. Image size: 10 μm × 10 μm. (c) Topography images of the areas marked by the white dashed squares in (a) and (b). (d) The lower panel shows the topographic line profiles across the aggregate marked by a blue line in (c). In the upper panel, the dots indicate the intensity line profiles across the positions marked by the blue lines in (a) and (b); while the lines represent the calculated electric field intensity distributions (E2) through the focal fields in a parabolic-mirror. For the calculation, a laser wavelength of 632.8 nm and a Si substrate are considered. In (d), the red colour indicates the results from APDM excitation; whilst the blue one represents those from RPDM excitation. | ||
Comparing the optical and the topography image (Fig. 2(c)), which are taken from the white dashed squares marked in Fig. 2(a) and (b), we clearly see that the localized excitations only occur at the aggregates and not at the terraces. In the topography images (Fig. 2(c)), both PFP aggregates and molecular terraces are observed. Fig. 2(d) shows the normalized optical intensities (upper panel, blue dots for RPDM, red dots for APDM) as well as the calculated electric field intensity distributions (E2) (upper panel, solid lines) and the corresponding topography (lower panel) line profiles of a PFP aggregate, which is about 80 nm high, 160 nm wide and 800 nm long. Due to the far-field confocal optical resolution and the weak optical contrast, the PFP molecular terraces are not clearly resolved in Fig. 2(a) and (b).
To further understand the polarization-dependent PL and Raman spectra and their relations to the local morphologies of the PFP film, spectra were recorded from different terraces and aggregates (over the 10 μm × 10 μm area in Fig. 2) with the two polarizations. Fig. 3(a) illustrates a stack of all spectra recorded with RPDM from the terraces to aggregates, showing increasing intensities from the bottom to the top of the picture. Three representative spectra for the high, moderate and low intensities are shown in Fig. 3(b). All the spectra consist of sharp Raman peaks and broad PL backgrounds. Clearly, the PL background dominates the optical intensity that we observed in Fig. 2(a) and (b). As shown in Fig. 3(b), The PL background of these spectra can be fitted by three Gaussian curves: one main electronic transition (S1 to S0) in the range from 1.748 eV to 1.736 eV and two weak spectral shoulders at 1.865 eV and 1.635 eV. The spectral shoulder at 1.635 eV has been assigned to a vibronic band of the S1 to S0 transition.25 The dashed lines in Fig. 3(c) indicate the peak positions and show a blue-shift from the terrace to the aggregate.
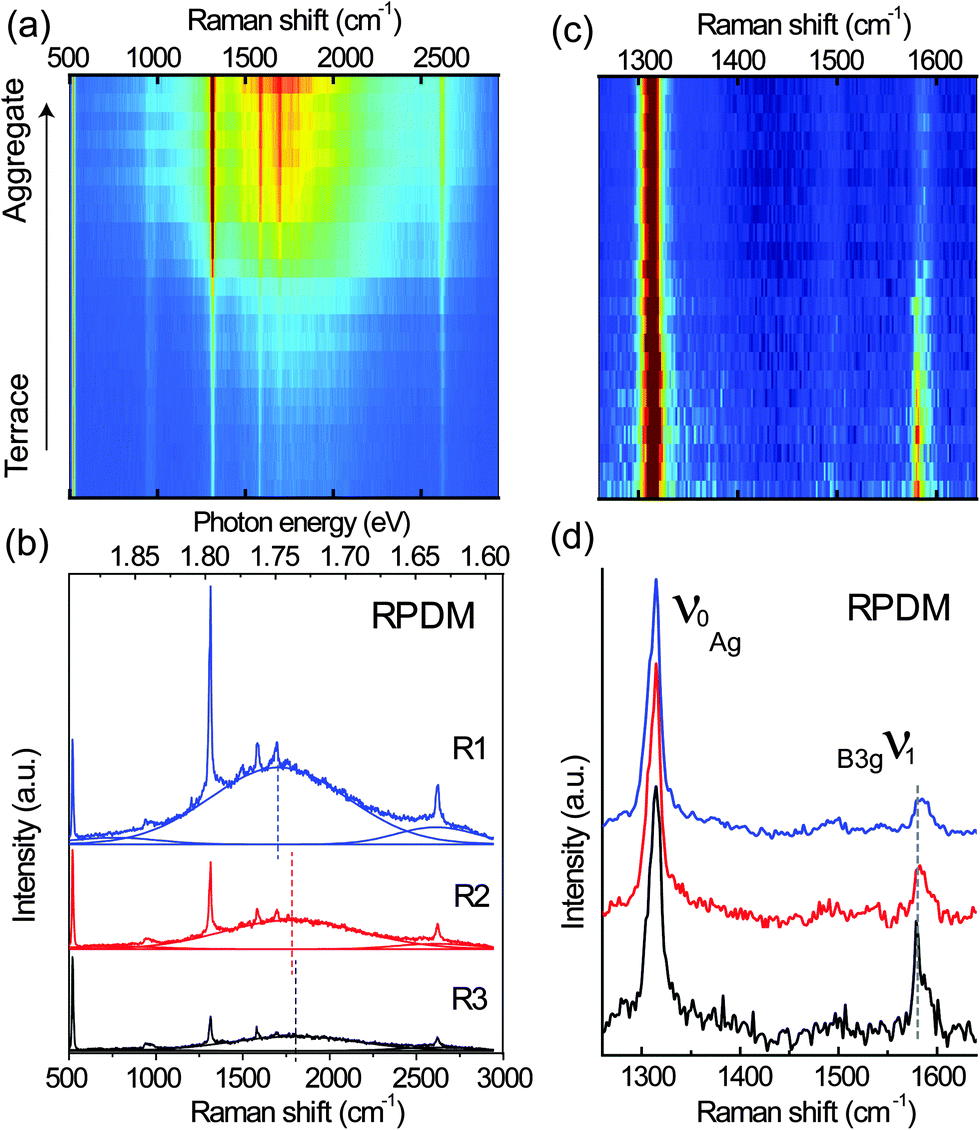 | ||
| Fig. 3 (a) A series of spectra recorded with RPDM from the same area as in Fig. 2(a) and (b). (b) Three representative spectra taken from the bright (R1), moderate (R2) and dark (R3) areas by the excitation with RPDM. The Raman peaks at about 520 cm−1 and 950 cm−1 are from the Si substrate. The PL background are fitted using Gaussian function and the maxima of the fitted spectra are indicated by the dashed lines. (c) A series of Raman spectra after the subtraction of PL background in (a). The Raman spectra are normalized to the 1316 cm−1 peak. (d) Three representative Raman spectra recorded with RPDM. | ||
Although the Raman and PL peaks from the PFP aggregates are generally stronger than from the molecular terraces as shown in Fig. 3(a), we find that the relative intensity ratios for certain Raman peaks vary significantly with the locations. To provide a clear comparison, we plot in Fig. 3(c) a series of the normalized Raman peaks of the spectra shown in Fig. 3(a) after the subtraction of the PL background. Red indicates the highest intensity; whilst blue the lowest. Three typical spectra are shown in Fig. 3(d) with an offset for clarity. The well-defined Raman peaks are in good agreement with the published results48 within the spectral resolution. The intense Raman peaks observed in the range from 1200 cm−1 to 1600 cm−1 are mainly C–C stretching modes of the conjugated ring.48 The most prominent peak labelled as ν0 is located at 1316 cm−1. The peak located at 1581 cm−1 is labelled as ν1. For the RPDM, the Raman peak ν1 from the PFP terrace is more intense than that from the aggregate.
Similarly, spectra recorded with the APDM from terraces and aggregates in the 10 μm × 10 μm area are shown as a series in the sequence from low intensity to high intensity in Fig. 4(a). Compared with the RPDM, in Fig. 4(b) the three representative spectra taken from the terraces and aggregates show similar spectral profiles and PL peak-shifts. We also show the normalized Raman spectra recorded with the APDM after the PL background subtraction in Fig. 4(c) and three representative spectra in Fig. 4(d). In contrast to the observations with the spectra recorded with RPDM, for the APDM, the intensities of the Raman peaks ν1 recorded from all the locations are equally weak as compared to the intense Raman peak ν0.
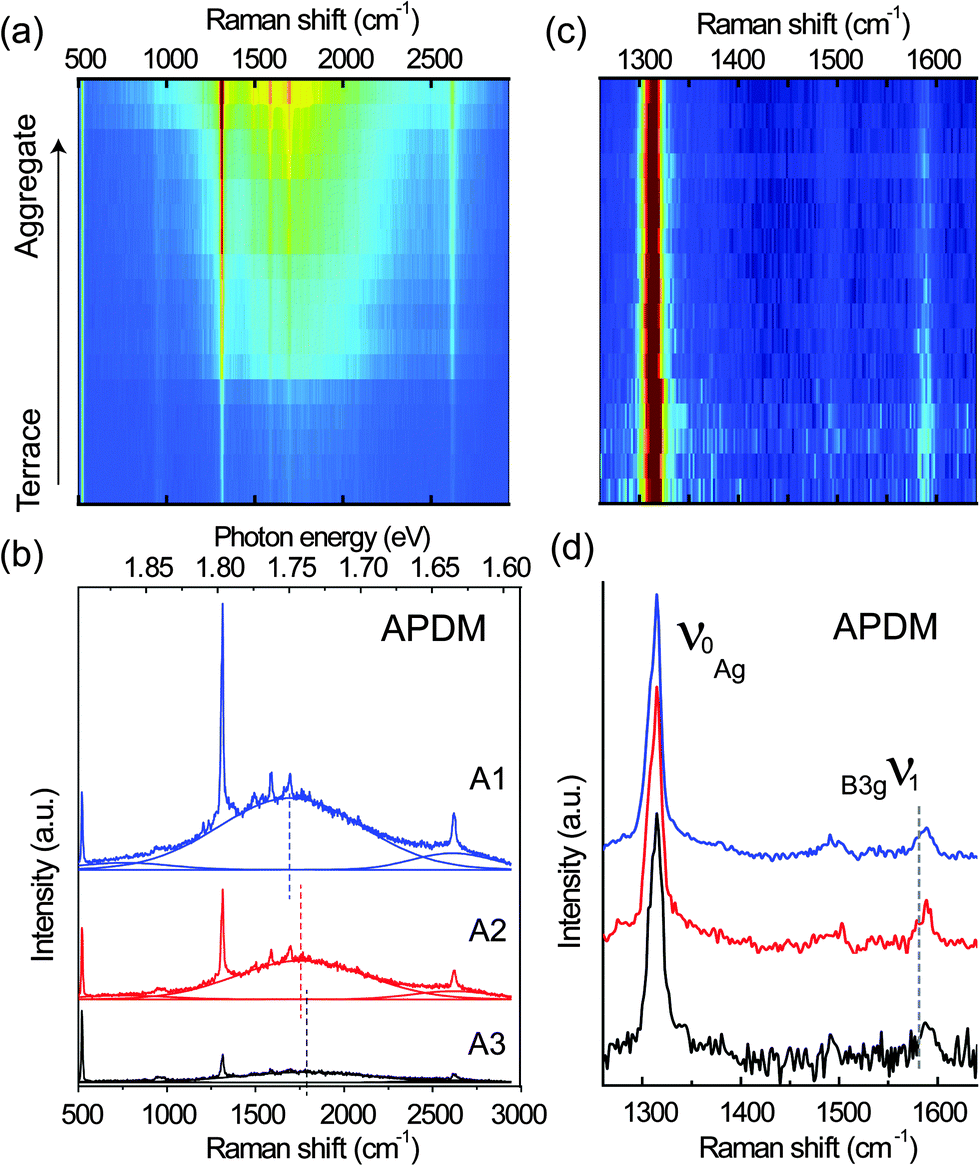 | ||
| Fig. 4 (a) A series of spectra recorded with APDM. (b) Three representative spectra taken from the bright (A1), moderate (A2) and dark (A3) areas. (c) A series of normalized Raman spectra after the subtraction of PL background in (a). (d) Three representative Raman spectra recorded with APDM. | ||
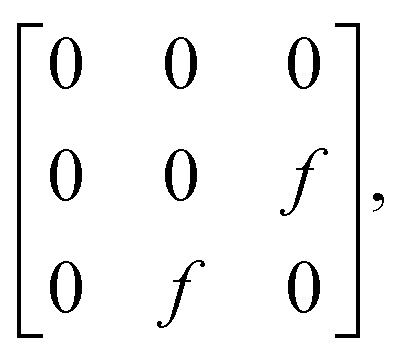
To interpret the polarization-dependent Raman intensity variations, we need to understand the Raman tensor of the vibrational modes. The chemical structure of free PFP molecule has D2h symmetry. Based on the published theoretical results48 of the free PFP molecule Raman modes and the irreducible representation of D2h point group, ν0 has an Ag representation and its Raman tensor components are x2, y2 and z2; however ν1 has a B3g representation and its Raman tensor component is yz.49 Therefore, the intensity of ν1 is sensitive to the molecular orientations. It is known that the PFP molecule in the terrace structures (on SiO2/Si substrate) orients with the long axis almost perpendicular to the substrate surface.2,3 Since the dominant electric field in the focus of the RPDM is parallel to the substrate normal, an increase in the tilt angle of the PFP molecule with respect to the substrate normal leads to a weaker excitation, decreasing the intensity of the Raman mode. From the change of the intensity ratio of ν1 to ν0 modes, the orientation of the molecules with respect to the substrate normal can be deduced.
To obtain a comprehensive description of the molecular orientation, we analyse all spectra recorded from the sample. Fig. 5(a) shows the intensity ratios of the B3g Raman mode ν1 against the Ag mode ν0 (Iν1/Iν0) at different locations as recorded with RPDM and APDM. In these plots, the different locations are represented by their total PL intensities. In general, high PL intensities correspond to PFP aggregates while low PL intensities correspond to the molecular terraces. We differentiate the experimental results from the terraces and aggregates by red dashed lines in Fig. 5(a) and (b), according to the topography and the corresponding PL intensity. Due to the exclusive in-plane excitation with APDM, the ν1 peaks are weak and the (Iν1/Iν0) ratio is about 0.1 for all the locations (Fig. 5(a) right). For RPDM, the relative intensities of ν1 peaks vary systematically with the locations: for PFP aggregates, the (Iν1/Iν0) ratio is about 0.15. For molecular terraces the PL intensity is generally lower than that from the aggregate, however, the (Iν1/Iν0) ratio of the Raman peak increases (up to about 0.6) with the decreasing PL intensity. The changing in the (Iν1/Iν0) ratio indicates that PFP molecule in the aggregate orients differently from it in the molecular terraces. A high (Iν1/Iν0) ratio indicates a small molecular tilting angle with respect to the surface normal. This can be further confirmed by comparing the intensity of the ν1 Raman peak excited with RPDM and APDM, respectively. Fig. 5(b) shows the intensity ratio (IAPDM/IRPDM) of the Raman mode ν1 recorded from the terraces and aggregates. The small ratio indicates a small tilting angle which refers to the terraces; while the large ratio indicates a large tilting angle which refers to the aggregates. To demonstrate the above conclusion quantitatively, the following calculations are performed.
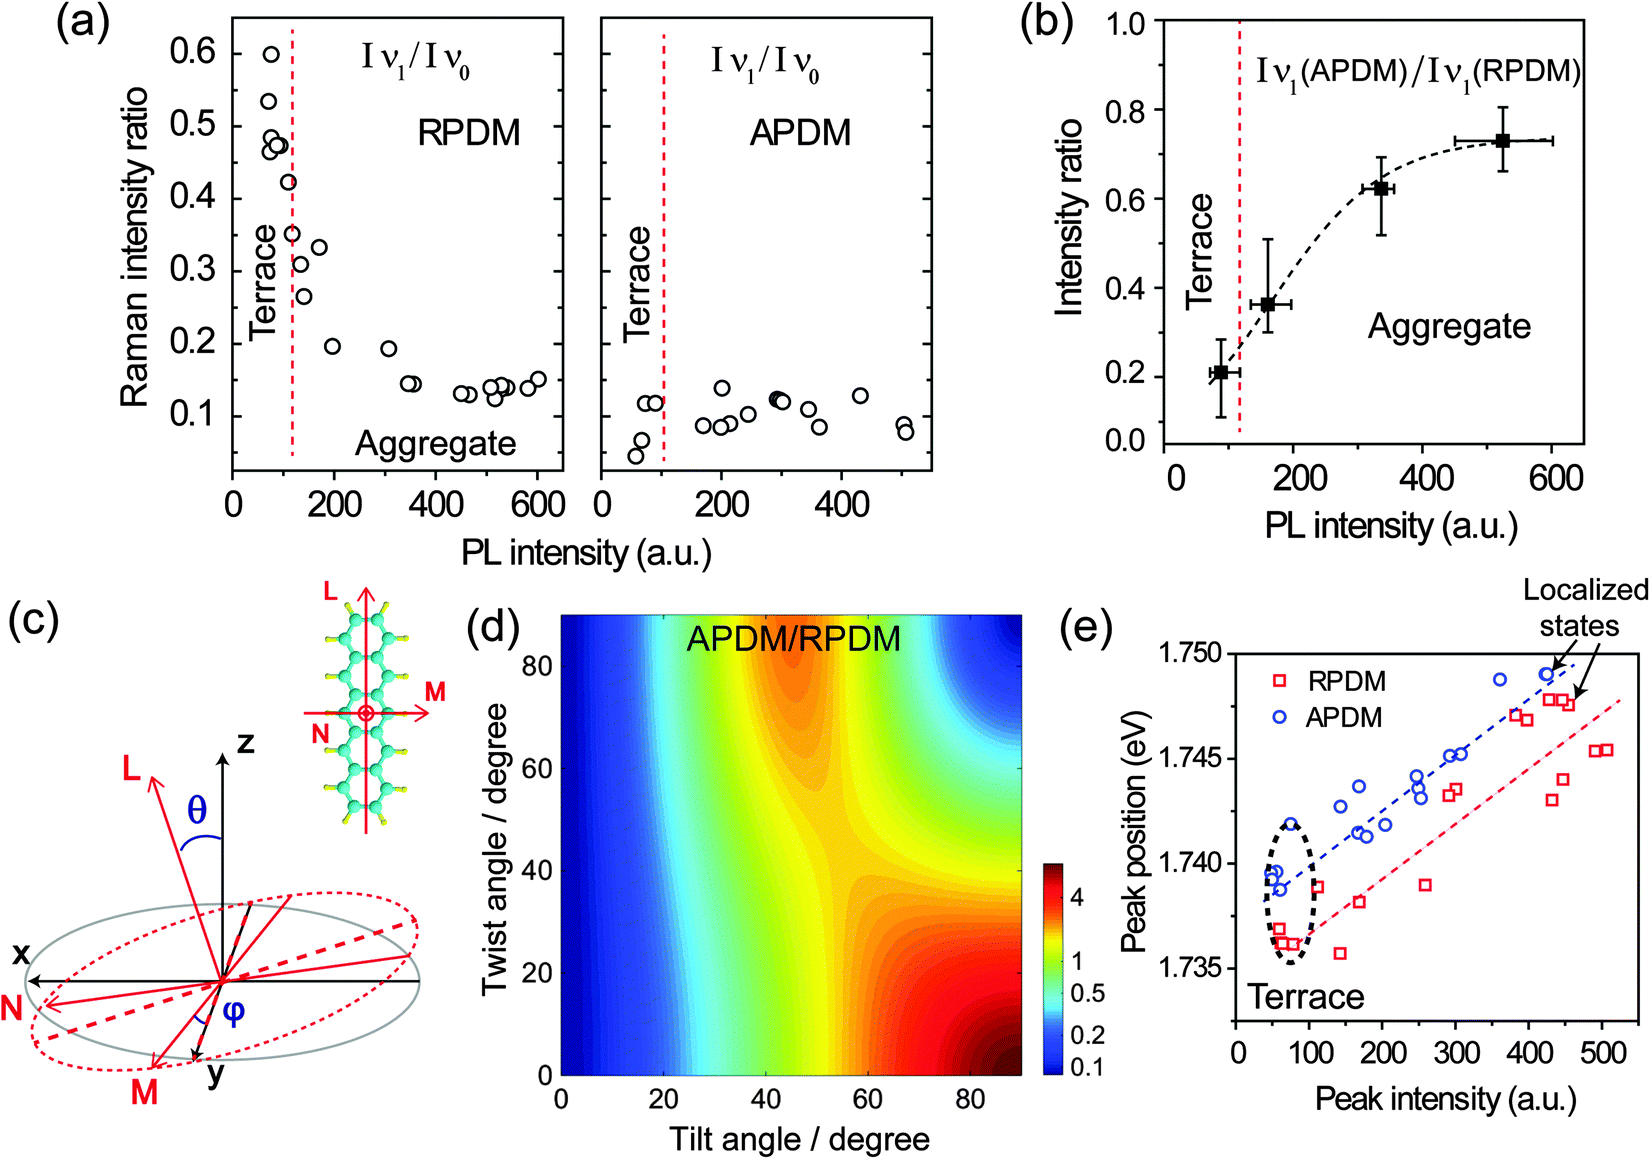 | ||
| Fig. 5 (a) Intensity ratios of Raman peaks ν1vs. ν0 at different locations excited by an APDM and RPDM, respectively. The red dashed lines differentiate the experimental results taken from the terraces and aggregates. (b) Intensity ratios of the Raman B3g mode ν1 (IAPDM/IRPDM) recorded from the terraces and aggregates. The dashed line is obtained by fitting the data in (a). (c) Illustration of the tilt angle θ and the twist angle ϕ. PFP molecule is designed with the coordinate system (lmn). l and m denote the long and short molecular axis, respectively. n denotes the direction perpendicular to the lm plane. (d) Calculated intensity ratio IAPDM/IRPDM of the B3g mode ν1 (in a logarithmic scale) as the function of the tilt angle and the twist angle. (e) Plots of PL peak positions against their intensities for the excitation with APDM (blue circle) and RPDM (red square), respectively. The dashed lines are guides to the eye. | ||
The Raman intensity of a certain mode is expressed by the Raman polarizability tensor (αxyz), the electric field vector of the excitation (Ee) and scattered radiation (Es) as50
| I ∝ |ETsαxyzEe|2 |
the excitation intensity (Ix, Iy, Iz) for the radial and azimuthal modes and the detection parameters (A, B)28,49 over the scattering cone, the Raman intensity of B3g mode of PFP molecule which has a tilt angle θ and twist angle ϕ with respect to the substrate normal (Fig. 5(c)) can be calculated as in eqn (1):28
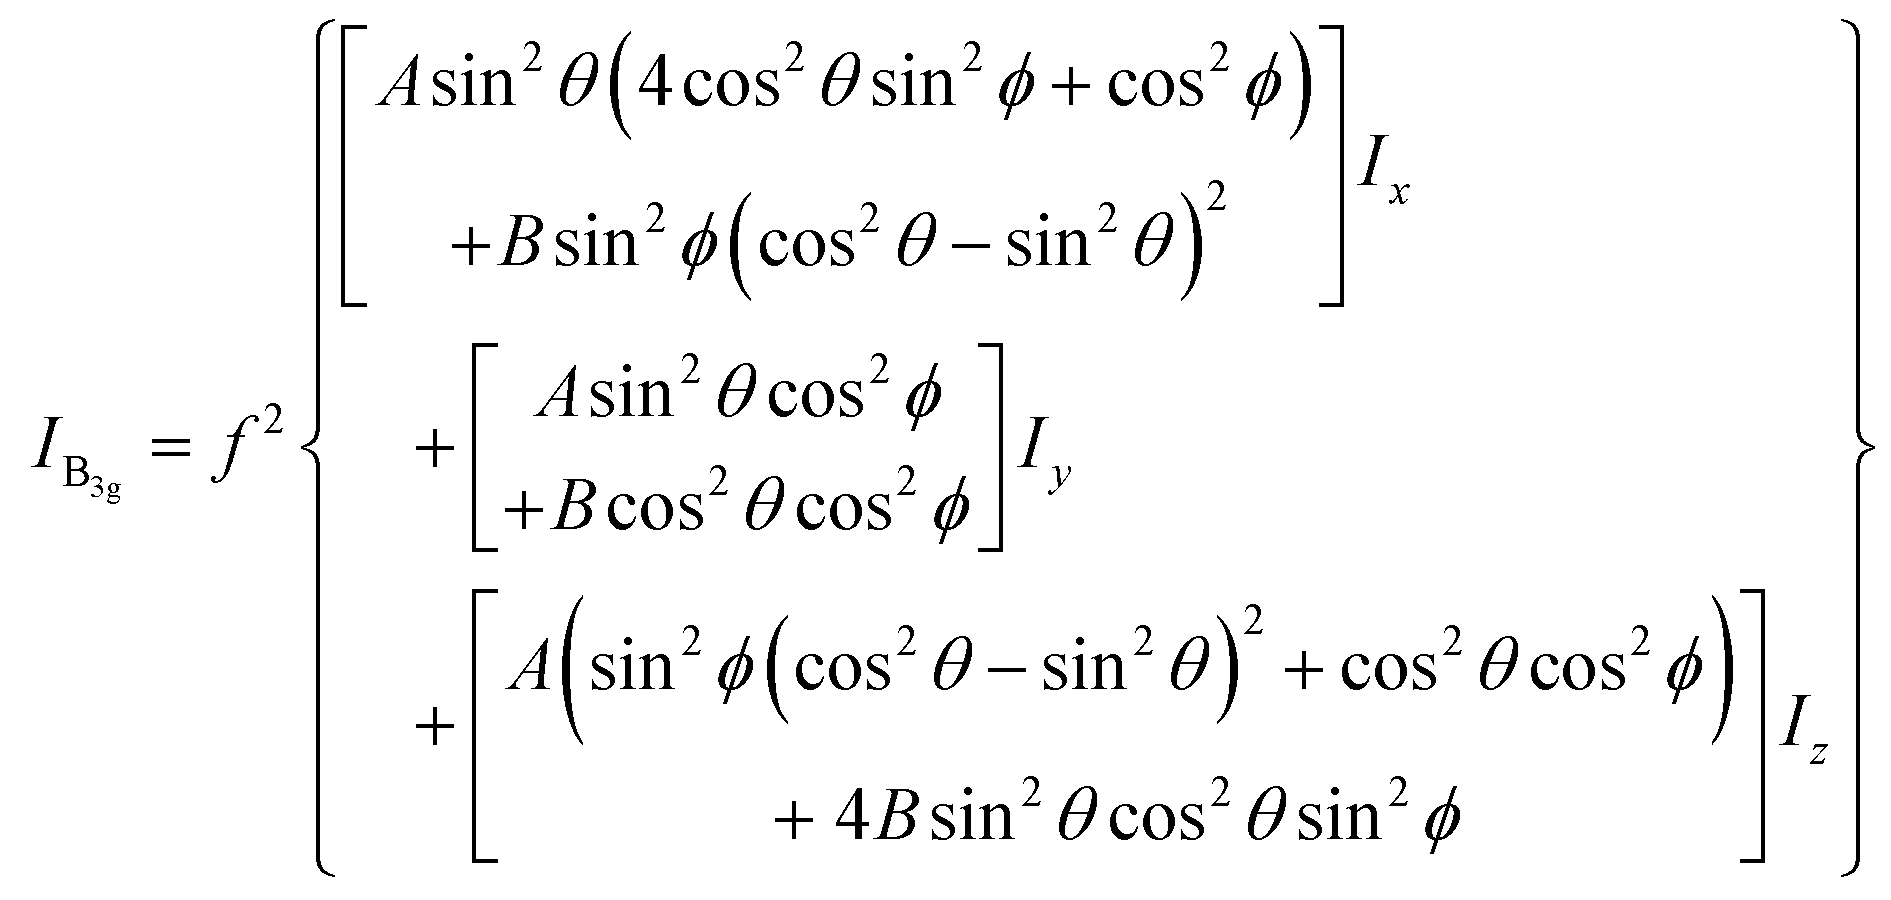 | (1) |
Besides the Raman intensity ratio changes, we observe also shifts of the main PL peak for different morphologies. To provide a complete description of the behaviour, Fig. 5(e) shows the main PL emission peak, which is obtained from the spectral fitting, against the intensity at different locations in the PFP film excited with both laser modes, respectively. The peak positions and spectral widths of the other two Gaussian curves for fitting the spectral shoulders were fixed during the fitting for all different locations. For the locations where the PL intensity increases from about 60k counts to 500k counts, we observe that the PL peak position shifts by about 10 meV to higher photon energy for both laser modes. Therefore, in general the PL emission from the PFP aggregates has higher photon energy than that from the PFP terrace. This blue-shift cannot be attributed to the film thickness-dependent HOMO–LUMO transition energies of the PFP film, where a red-shift of the absorption spectrum with increasing thickness has been reported.23 Other possibilities may be considered, for example that the change in the molecular orientation at the aggregates and the terraces induces different dipole moments coupling schemes, either a H- or J-aggregate like transition53 or PL emission from strained unit cells induced by the different local polymorph.
Confocal spectroscopy only allowed us to investigate how PL- and Raman-spectra vary at different locations with diffraction-limited optical resolution. To optically resolve molecular terraces and the details of the aggregates, we employ near-field optical microscopy and spectroscopy to push the optical resolution down to the nanometer regime. Hence, for all near-field optical measurements a sharp gold-tip is centered in the focal volume of a RPDM for an efficient plasmon excitation. Fig. 6(a) and (b) show the simultaneously recorded topography and near-field optical images of an area with a PFP aggregate. In the topographic image (Fig. 6(a)), we observe that the PFP aggregate has a width of about 100 nm and a height of about 120 nm. The corresponding near-field optical image (Fig. 6(b)) shows intense optical signals. According to the discussion based on the confocal Raman and PL spectra, the PFP molecules orient more parallel to the substrate plane in aggregates than those in the PFP terraces. As the main transition dipole moment lies along the short molecular axis,22 for PFP aggregates one would find a substantial component in the direction perpendicular to the substrate plane, which makes an efficient coupling to the tip plasmon and hence a bright near-field excited PL-signal possible.
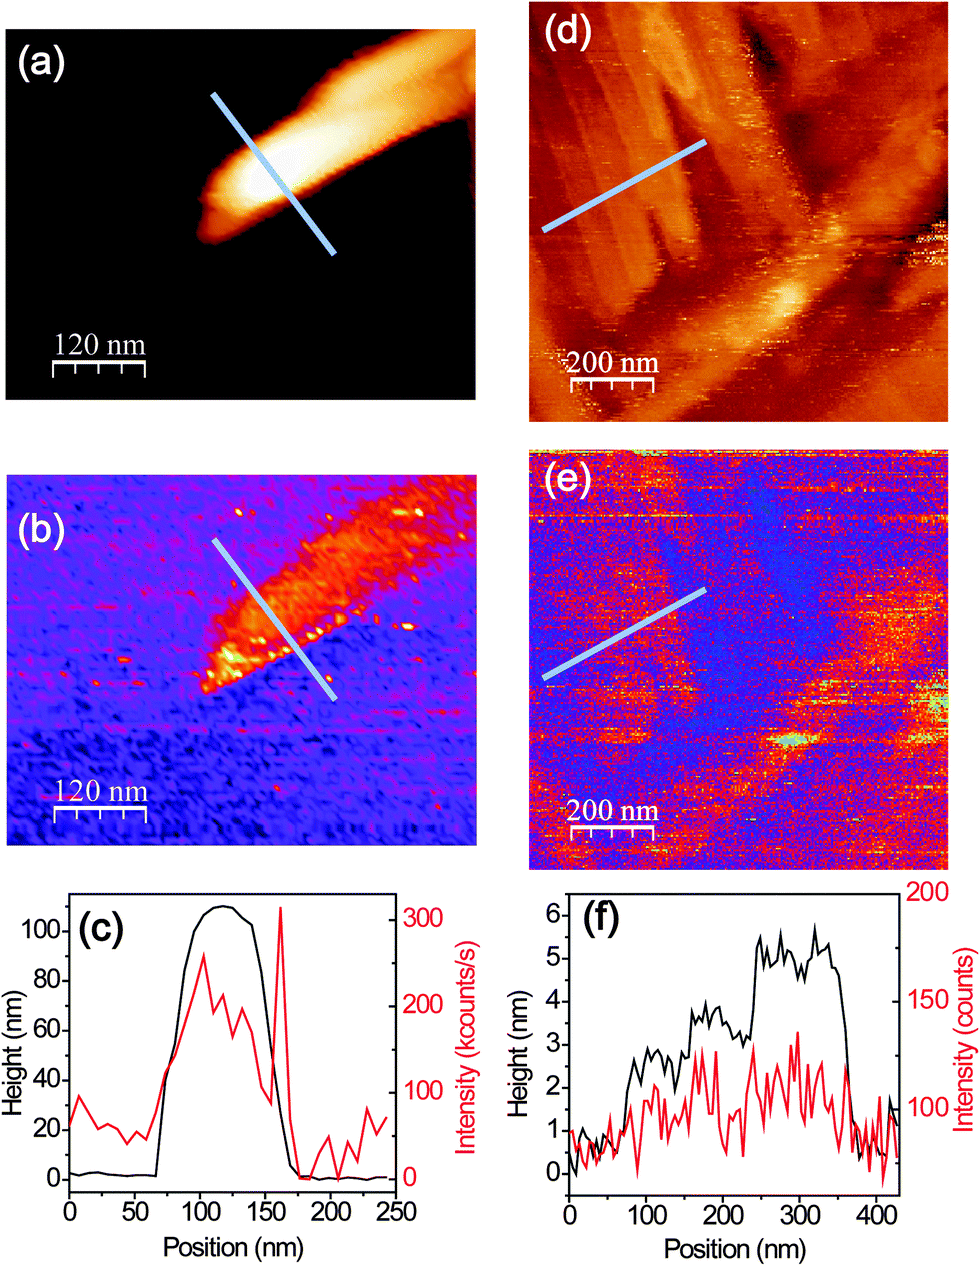 | ||
| Fig. 6 (a and b) Topographic and the corresponding optical images of a PFP aggregate. (c) Topographic (black curve) and optical (red curve) line profiles along the blues lines indicated in (a) and (b). (d and e) Topographic and the corresponding optical images of the PFP terraces. (f) Topographic (black curve) and optical (red curve) line profiles along the blues lines indicated in (d) and (e). Acquisition time for each data point is 10 ms. | ||
Fig. 6(d) and (e) show the topography and the simultaneously recorded near-field optical images of an area where PFP terraces with single molecular steps are clearly resolved. The near-field optical images show optical contrast from different layers of the molecules. To demonstrate the correlation quantitatively, Fig. 6(f) shows the topographic height and optical intensity profile along one line, the position of which is indicated in Fig. 6(d) and (e). Along this line the corresponding optical intensity increases from about 60 counts to 115 counts on average (130 counts at the maximum), while the height of the PFP terrace increases by only 5 nm.
The near-field optical spectra from the PFP aggregate and the molecular terraces are shown in Fig. 7. The near-field spectrum consists of sharp Raman peaks, a PL background from the molecules and also a contribution from the gold tip. In Fig. 7 the spectra from the gold tips alone are shown as grey lines. It should be noted that two different tips are used for the measurements. The PL spectra of the gold tips are fitted by single Lorentzian curves as indicated by the red lines in Fig. 7. Similar to the analysis for the confocal spectra, the PL background of the PFP molecules is fitted by three Gaussian curves (blue lines). After the subtraction of PL background, Raman peaks from the PFP aggregate and PFP molecular terrace are shown in Fig. 7(c) and (d), respectively. Again, we analyse the intensity ratio of Raman modes Iν1/Iν0 and the main PL peak position. From the PFP molecular terrace to the PFP aggregate, the ratio of the Raman modes ν1 against ν0 decreases from 0.69 to 0.15, while the spectral maximum of the main PL peak shifts from 1.74 eV to 1.75 eV. These near-field experimental results agree well with the tendency demonstrated in Fig. 5(a) however with a much higher topographical and optical resolutions. In Fig. 7(e), the interactions between a gold tip and the different locations in a PFP film, at the terrace and at the aggregate, are shown. For PFP molecules in the terraces, the main transition dipole moment is relatively parallel to the substrate plane leading to a low PL signal.22 In the molecular aggregate, the transition dipole moment orients more perpendicular to the substrate plane. The localized plasmon oscillation at the tip apex as excited by a RPDM is directed along the tip axis leading to an optical near-field under the tip apex which is mainly oriented perpendicular to the substrate plane. Hence it couples less efficiently with the molecular transition dipole moments in the molecular terraces as compared to the aggregates. Therefore, even though the PL intensity contrast is clearly visible from several molecular layers in the terraces (Fig. 6(d)–(f)), a large contrast can be observed in the near-field excited PL signal between the aggregates and the terraces (Fig. 6(a)–(c)).
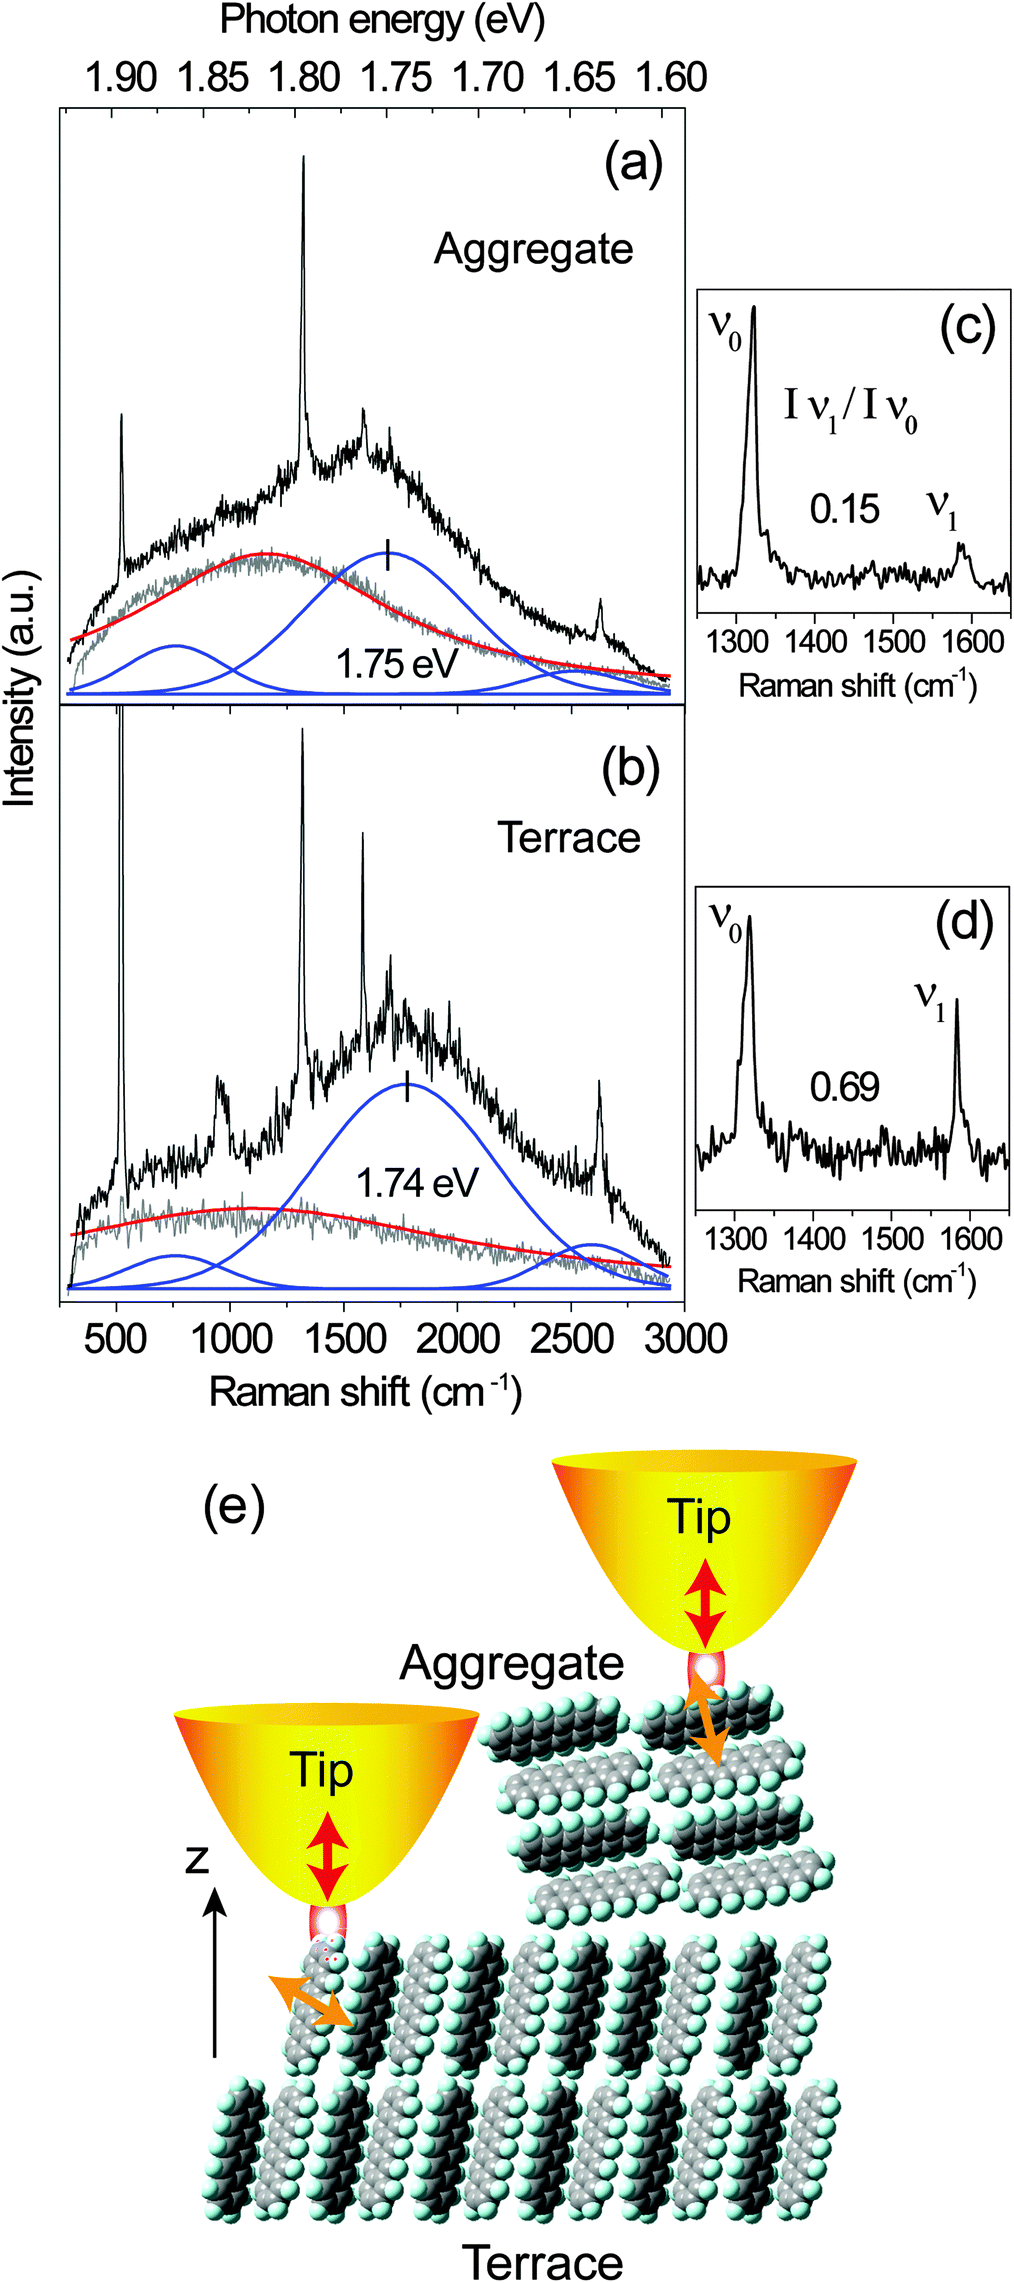 | ||
| Fig. 7 (a and b) Near-field (PL and Raman) spectra recorded from the large aggregate and the molecular terrace showing in Fig. 6(a) and (b), respectively. The grey and red lines indicate the raw and fitted PL spectra of the gold tips alone. The PL of the PFP is fitted by a superposition of three blue bands at about 1.64 eV, 1.74 eV and 1.86 eV, respectively. (c and d) Raman spectra after the subtraction of the PL background from the spectra shown in (a) and (b), respectively. (e) Sketch of the orientation of the PFP molecules forming terraces and aggregates. The transition dipole moment (yellow arrows) orients along the short molecular axis which interacts with the optical near-field under the tip-apex (red arrows) for the excitation with RPDM. | ||
Experimental
For the excitation a He–Ne laser at λ = 632.8 nm is used. The PL and Raman signals from the focal volume are collected by a parabolic mirror (numerical aperture of 0.998 in air) and are directed though two narrow band filters (in total 12 optical density) for blocking the laser line. The size (full width at the half maximum) of the diffraction limited spot (radial mode) on the sample is about 280 nm for the excitation with the 632.8 nm laser. The optical signals can be detected either by an avalanche photodiode for pixel by pixel photon counting as the sample is scanned through the laser focus; or by a spectrograph equipped with a liquid N2 cooled CCD camera for recording spectra at a fixed sample position. The spectral resolution is about 2 cm−1. For the near-field optical measurement a sharp gold tip electrochemically etched from an Au wire (diameter of 100 μm) is carefully positioned in the diffraction-limited excitation focus. A shear-force feed-back is used to station the gold tip above the sample surface at a distance of about 3 nm. This tip is used as an optical antenna to create a highly confined, and enhanced optical near-field for the excitation; and at the same time to enhance the Stokes-shifted emission/scattering from the tip-sample gap to the far-field. Topographic and near-field optical images can be obtained simultaneously by raster scanning the sample with the tip staying stationary inside the laser focus. The PFP thin films with an average thickness of 20 nm were grown on silicon wafers covered with a native oxide layer (thickness ≈ 2 nm) at a constant substrate temperature of 30 °C under ultrahigh vacuum conditions by organic molecule beam deposition (OMBD) similar to previous studies54–56 and characterized thoroughly by complementary methods (XRD, AFM).Conclusions
In conclusion, two distinct morphologies, ordered PFP molecular terraces and PFP aggregates are observed in PFP thin films. Based on the confocal polarization-dependent spectroscopy with RPDM, we observe a decreasing (from 0.6 to 0.15) intensity ratio of the B3g mode (at 1581 cm−1) against the Ag mode (at 1316 cm−1) recorded from the molecular terraces to the aggregates. It indicates that the PFP molecules orient more parallel to the substrate in the aggregates, whilst more upright in the molecular terrace. This conclusion is further confirmed by the near-field measurements with clear identification of aggregate and terrace areas and their corresponding Raman peak analysis. Furthermore, localized excitations, which could arise from either structural defects or localized excitons, appear at the aggregates and form well-defined bright dipole patterns when the sample is raster scanned through the focal field of an APDM or RPDM. We find that the PL peak position of the main electronic transition in the terraces is blue-shifted by about 10 meV with respect to the aggregates. With the tip-enhanced near-field optical approach, we are able to push the optical resolution to sub-diffraction limit. Clear optical contrast from a single or a few PFP molecule layers is observed. Near-field spectra further confirm the blue-shift of the PL peak and the decrease of the intensity ratio of the Raman modes from the PFP molecular terraces to the large aggregates. Combined with cylindrical vector beams, our confocal and near-field PL and Raman microscopy and spectroscopy provide sensitive methods to study the morphology, the orientation and the intermolecular interaction in thin molecular films.Acknowledgements
The authors thank Reinhard Scholz for the scientific discussion and Kai Braun for improving the shear-force scanning tip runner. Financial support by the Projektförderung für Nachwuchswissenschaftler/Innen University of Tübingen and the DFG (grant ME1600/5-3, BR4869/1-1 and SCHR700/20-1) is gratefully acknowledged.References
- W. Brütting and C. Adachi, Physics of organic semiconductors, VCH-Wiley, Weinheim, Germany, 2012 Search PubMed.
- Y. Sakamoto, T. Suzuki, M. Kobayashi, Y. Gao, Y. Fukai, Y. Inoue, F. Sato and S. Tokito, J. Am. Chem. Soc., 2004, 126, 8138 CrossRef CAS PubMed.
- I. Salzmann, S. Duhm, G. Heimel, J. P. Rabe, N. Koch, M. Oehzelt, Y. Sakamoto and T. Suzuki, Langmuir, 2008, 24, 7294 CrossRef CAS PubMed.
- T. Breuer and G. Witte, Phys. Rev. B: Condens. Matter Mater. Phys., 2011, 83, 155428 CrossRef.
- A. Hinderhofer and F. Schreiber, ChemPhysChem, 2012, 13, 628 CrossRef CAS PubMed.
- S. Duhm, S. Hosoumi, I. Salzmann, A. Gerlach, M. Oehzelt, B. Wedl, T. L. Lee, F. Schreiber, N. Koch, N. Ueno and S. Kera, Phys. Rev. B: Condens. Matter Mater. Phys., 2010, 81, 045418 CrossRef.
- B. Milián-Medina, S. Varghese, R. Ragni, H. Boerner, E. Ortí, G. M. Farinola and J. Gierschner, J. Chem. Phys., 2011, 135, 124509 CrossRef PubMed.
- Y. Inoue, Y. Sakamoto, T. Suzuki, M. Kobayashi, Y. Gao and S. Tokito, Jpn. J. Appl. Phys., 2005, 44, 3663 CrossRef CAS.
- Y. Sakamoto, T. Suzuki, M. Kobayashi, Y. Gao, Y. Inoue and S. Tokito, Mol. Cryst. Liq. Cryst., 2006, 444, 225 CrossRef CAS.
- S.-T. Pham, Y. Kawasugi and H. Tada, Appl. Phys. Lett., 2013, 103, 143301 CrossRef.
- K. Kolata, T. Breuer, G. Witte and S. Chatterjee, ACS Nano, 2014, 8, 7377 CrossRef CAS PubMed.
- I. Salzmann, S. Duhm, R. Opitz, R. L. Johnson, J. P. Rabe and N. Koch, J. Appl. Phys., 2008, 104, 114518 CrossRef.
- S. D. Ha, J. Meyer and A. Kahn, Phys. Rev. B: Condens. Matter Mater. Phys., 2010, 82, 155434 CrossRef.
- C. Frank, J. Novak, A. Gerlach, G. Ligorio, K. Broch, A. Hinderhofer, A. Aufderheide, R. Banerjee, R. Nervo and F. Schreiber, J. Appl. Phys., 2013, 114, 043515 CrossRef.
- K. Broch, A. Gerlach, C. Lorch, J. Dieterle, J. Novak, A. Hinderhofer and F. Schreiber, J. Chem. Phys., 2013, 139, 174709 CrossRef CAS PubMed.
- K. Broch, C. Buerker, J. Dieterle, S. Krause, A. Gerlach and F. Schreiber, Phys. Status Solidi RRL, 2013, 7, 1084 CrossRef CAS.
- K. Broch, A. Aufderheide, L. Raimondo, A. Sassella, A. Gerlach and F. Schreiber, J. Phys. Chem. C, 2013, 117, 13952 CAS.
- I. Salzmann, A. Moser, M. Oehzelt, T. Breuer, X. Feng, Z.-Y. Juang, D. Nabok, R. G. Della Valle, S. Duhm, G. Heimel, A. Brillante, E. Venuti, I. Bilotti, C. Christodoulou, J. Frisch, P. Puschnig, C. Draxl, G. Witte, K. Muellen and N. Koch, ACS Nano, 2012, 6, 10874 CrossRef CAS PubMed.
- G. B. Piland and C. J. Bardeen, J. Phys. Chem. Lett., 2015, 6, 1841 CrossRef CAS PubMed.
- S. Kowarik, A. Gerlach, A. Hinderhofer, S. Milita, F. Borgatti, F. Zontone, T. Suzuki, F. Biscarini and F. Schreiber, Phys. Status Solidi RRL, 2008, 2, 120 CrossRef CAS.
- S. Kowarik, K. Broch, A. Hinderhofer, A. Schwartzberg, J. O. Ossó, D. Kilcoyne, F. Schreiber and S. R. Leone, J. Phys. Chem. C, 2010, 114, 13061 CAS.
- A. Hinderhofer, U. Heinemeyer, A. Gerlach, S. Kowarik, R. M. J. Jacobs, Y. Sakamoto, T. Suzuki and F. Schreiber, J. Chem. Phys., 2007, 127, 194705 CrossRef PubMed.
- U. Heinemeyer, K. Broch, A. Hinderhofer, M. Kytka, R. Scholz, A. Gerlach and F. Schreiber, Phys. Rev. Lett., 2010, 104, 257401 CrossRef CAS PubMed.
- N. J. Hestand, H. Yamagata, B. Xu, D. Sun, Y. Zhong, A. R. Harutyunyan, G. Chen, H.-L. Dai, Y. Rao and F. C. Spano, J. Phys. Chem. C, 2015, 119, 22137 CAS.
- F. Anger, J. O. Osso, U. Heinemeyer, K. Broch, R. Scholz, A. Gerlach and F. Schreiber, J. Chem. Phys., 2012, 136, 054701 CrossRef CAS PubMed.
- C. Westermeier, A. Cernescu, S. Amarie, C. Liewald, F. Keilmann and B. Nickel, Nat. Commun., 2014, 5, 4101 CAS.
- K. Seto and Y. Furukawa, J. Raman Spectrosc., 2012, 43, 2015 CrossRef CAS.
- T. Mino, Y. Saito, H. Yoshida, S. Kawata and P. Verma, J. Raman Spectrosc., 2012, 43, 2029 CrossRef CAS.
- F. Cerdeira, M. Garriga, M. I. Alonso, J. O. Osso, F. Schreiber, H. Dosch and M. Cardona, J. Raman Spectrosc., 2013, 44, 597 CrossRef CAS.
- X. Wang, K. Broch, R. Scholz, F. Schreiber, A. J. Meixner and D. Zhang, J. Phys. Chem. Lett., 2014, 5, 1048 CrossRef CAS PubMed.
- A. Hartschuh, Angew. Chem., Int. Ed., 2008, 47, 8178 CrossRef CAS PubMed.
- C. Neacsu, S. Berweger and M. Raschke, Nanobiotechnology, 2007, 3, 172 CrossRef CAS.
- D. Zhang, U. Heinemeyer, C. Stanciu, M. Sackrow, K. Braun, L. E. Hennemann, X. Wang, R. Scholz, F. Schreiber and A. J. Meixner, Phys. Rev. Lett., 2010, 104, 056601 CrossRef CAS PubMed.
- S. Berweger, C. C. Neacsu, Y. B. Mao, H. J. Zhou, S. S. Wong and M. B. Raschke, Nat. Nanotechnol., 2009, 4, 496 CrossRef CAS PubMed.
- C. Chen, N. Hayazawa and S. Kawata, Nat. Commun., 2014, 5, 3312 Search PubMed.
- A. Hartschuh, E. J. Sanchez, X. S. Xie and L. Novotny, Phys. Rev. Lett., 2003, 90, 095503 CrossRef PubMed.
- J. Steidtner and B. Pettinger, Phys. Rev. Lett., 2008, 100, 236101 CrossRef PubMed.
- R. Zhang, Y. Zhang, Z. C. Dong, S. Jiang, C. Zhang, L. G. Chen, L. Zhang, Y. Liao, J. Aizpurua, Y. Luo, J. L. Yang and J. G. Hou, Nature, 2013, 498, 82 CrossRef CAS PubMed.
- W. H. Zhang, B. S. Yeo, T. Schmid and R. Zenobi, J. Phys. Chem. C, 2007, 111, 1733 CAS.
- P. C. Sevinc, X. Wang, Y. M. Wang, D. Zhang, A. J. Meixner and H. P. Lu, Nano Lett., 2011, 11, 1490 CrossRef CAS PubMed.
- P. Anger, A. Feltz, T. Berghaus and A. J. Meixner, J. Microsc., 2003, 209, 162 CrossRef CAS PubMed.
- M. Sackrow, C. Stanciu, M. A. Lieb and A. J. Meixner, ChemPhysChem, 2008, 9, 316 CrossRef CAS PubMed.
- X. Wang, D. Zhang, K. Braun, H. J. Egelhaaf, C. J. Brabec and A. J. Meixner, Adv. Funct. Mater., 2010, 20, 492 CrossRef CAS.
- X. Wang, H. Azimi, H. G. Mack, M. Morana, H. J. Egelhaaf, A. J. Meixner and D. Zhang, Small, 2011, 7, 2793 CrossRef CAS PubMed.
- J. Stadler, C. Stanciu, C. Stupperich and A. J. Meixner, Opt. Lett., 2008, 33, 681 CrossRef CAS PubMed.
- T. Zuchner, A. V. Failla and A. J. Meixner, Angew. Chem., Int. Ed., 2011, 50, 5274 CrossRef PubMed.
- T. Zuchner, A. V. Failla, A. Hartschuh and A. J. Meixner, J. Microsc., 2008, 229, 337 CrossRef CAS PubMed.
- K. Fujii, C. Himcinschi, M. Toader, S. Kera, D. R. T. Zahn and N. Ueno, J. Electron. Spectrosc. Relat. Phenom., 2009, 174, 65 CrossRef CAS.
- R. Loudon, Adv. Phys., 1964, 13, 423 CrossRef CAS.
- G. Turrell, J. Raman Spectrosc., 1984, 15, 103 CrossRef CAS.
- M. A. Lieb and A. J. Meixner, Opt. Express, 2001, 8, 458 CAS.
- C. Debus, M. A. Lieb, A. Drechsler and A. J. Meixner, J. Microsc., 2003, 210, 203 CrossRef CAS PubMed.
- K. Kolata, PhD thesis, Universität Marburg, 2014.
- F. Schreiber, Phys. Status Solidi A, 2004, 201, 1037 CrossRef CAS.
- S. Kowarik, A. Gerlach and F. Schreiber, J. Phys.: Condens. Matter, 2008, 20, 184005 CrossRef.
- K. Broch, U. Heinemeyer, A. Hinderhofer, F. Anger, R. Scholz, A. Gerlach and F. Schreiber, Phys. Rev. B: Condens. Matter Mater. Phys., 2011, 83, 245307 CrossRef.
| This journal is © the Owner Societies 2016 |