
 Open Access Article
 This Open Access Article is licensed under a
 Creative Commons Attribution 3.0 Unported Licence
Evaluating the solid electrolyte interphase formed on silicon electrodes: a comparison of ex situ X-ray photoelectron spectroscopy and in situ neutron reflectometry†
T. M.
Fears‡
*a,
M.
Doucet
*b,
J. F.
Browning
*c,
J. K. S.
Baldwin
d,
J. G.
Winiarz
a,
H.
Kaiser
e,
H.
Taub
f,
R. L.
Sacci
 g and
G. M.
Veith
*g
g and
G. M.
Veith
*g
aDepartment of Chemistry, Missouri University of Science and Technology, 400 W. 11th St., Rolla, MO 65409, USA. E-mail: fears1@llnl.gov
bNeutron Data Analysis and Visualization Division, Oak Ridge National Laboratory, 1 Bethel Valley Rd., Oak Ridge, TN 37831, USA. E-mail: doucetm@ornl.gov
cChemical and Engineering Materials Division, Oak Ridge National Laboratory, 1 Bethel Valley Rd., Oak Ridge, TN 37831, USA. E-mail: browningjf@ornl.gov
dMaterials Science and Technology Division, Los Alamos National Laboratory, Los Alamos, NM 87545, USA
eUniversity of Missouri Research Reactor, University of Missouri, 1513 Research Park Dr., Columbia, MO 65211, USA
fDepartment of Physics and Astronomy, University of Missouri, Columbia, MO 65211, USA
gMaterials Science and Technology Division, Oak Ridge National Laboratory, 1 Bethel Valley Rd., Oak Ridge, TN 37831, USA. E-mail: veithgm@ornl.gov
First published on 15th April 2016
Abstract
This work details the in situ characterization of the interface between a silicon electrode and an electrolyte using a linear fluorinated solvent molecule, 0.1 M lithium bis(trifluoromethanesulfonyl)imide (LiTFSI) in deuterated dimethyl perfluoroglutarate (d6-PF5M2) (1.87 × 10⁻² mS cm−1). The solid electrolyte interphase (SEI) composition and thickness determined via in situ neutron reflectometry (NR) and ex situ X-ray photoelectron spectroscopy (XPS) were compared. The data show that SEI expansion and contraction (breathing) during electrochemical cycling were observed via both techniques; however, ex situ XPS suggests that the SEI thickness increases during Si lithiation and decreases during delithiation, while in situ NR suggests the opposite. The most likely cause of this discrepancy is the selective removal of SEI components (top 20 nm of the SEI) during the electrode rinse process, which is required to remove the electrolyte residue prior to ex situ analysis, demonstrating the necessity of performing SEI characterization in situ.
1. Introduction
The solid electrolyte interphase (SEI) is a protective solid barrier that forms on the surface of a lithium-ion battery operating outside the stability range of an electrolyte; particularly at the anode where during a lithiation reaction the Li metal reduces the liquid electrolyte forming a solid mixture of inorganic and organic components.1–3 The SEI is an integral, yet under-characterized component of Li-ion batteries. If the reaction does not proceed properly, the electrolyte will continue to react causing a reduction in cell capacity and reduce ion transport to the battery electrode. In addition, a poor interfacial layer will result in electrical contact, shorting, within the cell leading to an increased risk in fire or other catastrophic events. A good barrier layer prevents additional electrolyte decomposition. Furthermore, the SEI prevents the exfoliation of the anode material during cycling.1–3 To optimize battery performance and predict better electrolyte chemistries for more ideal SEI formation reactions, a detailed study of the relationship between SEI composition and properties is required. This is particularly important for more advanced, higher capacity anodes like silicon (>3000 mA h g−1 theoretical capacity versus ∼330 mA h g−1 for conventional graphite) which provide an opportunity to obtain higher gravimetric capacities but have large volume changes which pulverize the material exposing new surfaces which require the formation of additional SEI components.3The SEI is typically a 5–50 nm layer on 1–100 μm particles, so the SEI is only a low compositional fraction and must be analyzed using surface-sensitive techniques or grown on high-surface-area materials to obtain sufficient signal intensity.1,3–9 The most common methods of characterizing SEIs, e.g. X-ray photoelectron spectroscopy (XPS), infrared absorption spectroscopy (IR), and nuclear magnetic resonance spectroscopy (NMR), involve disassembling cycled Li-ion cells and often rinsing the electrode of interest to remove an excess of electrolyte before analysis.1,3,9,10 These preparation steps potentially remove soluble SEI components and expose the electrode to environmental contaminants.10,11In situ characterization avoids such effects and has the potential to monitor transient and dynamic interactions.10–20
For this study, neutron reflectometry (NR) was chosen to investigate the SEI formed on a Si thin film, as it possesses several advantages over other methods. X-ray and neutron reflectometry are interface-sensitive techniques,1,21–26 unlike diffraction or nuclear magnetic resonance, and interrogate a macroscopic sample size, unlike electron microscopy. Neutrons are deeply penetrating and sensitive to light elements (H and Li),12,16,18,25–28 unlike X-rays, making NR particularly suited for the characterization of SEIs and electrodes in Li-ion batteries.12,16,18,25–28 A specialized cell has been developed at the Oak Ridge National Laboratory for use on a Liquids Reflectometer (Spallation Neutron Source, Beam Line 4B) for performing NR on thin films during electrochemical cycling. Analysis of these data provides information on the thickness, roughness, and composition of various layers within the battery.25 Prior work has revealed the formation of a 17 to 25 nm SEI layer in ethylene carbonate/dimethyl carbonate (EC/DMC) electrolytes whose composition and thickness change with cycling.26 Other in situ NR studies have shown the formation of a 5.5 nm reaction layer on TiO2,29 a 20 nm thick layer that forms at the electrode/electrolyte interface on LiFePO4,30 and a 7 nm electrochemical SEI layer that is formed only upon delithiation, though the extent of lithiation was not clear.21 More recently, we demonstrated the formation of a 3.3 nm Li-rich layer at open circuit voltage on the high voltage cathode LiMn1.5Ni0.5O4 which changed with charging to become a F-rich layer with a similar thickness24 while others have focused on electrolyte decomposition over Cu metal as a function of potential.22
One commonality of all these prior studies is the use of carbonate based solvents given their importance to battery technology; however the neutron scattering properties of these carbonate molecules are not optimal for in situ neutron studies. For example, hydrogen (1H) possesses a large, incoherent neutron scattering cross-section (80.26 barns (b)), so the presence of a hydrogenous material in an electrochemical cell can contribute significantly to the background signal in elastic neutron scattering techniques like NR or powder diffraction. In addition, for these NR studies one wants an electrolyte with a high scattering length density (SLD) to provide maximal contrast; when possible, the isotopic substitution of deuterium (2H) for naturally abundant H (99.99% 1H) is carried out to increase the SLD, as 2H has a positive scattering length (6.67 fm) and a small incoherent cross-section (2.05 b) while 1H has a negative scattering length (−3.74 fm) and a large incoherent scattering cross-section. Commercially available deuterated carbonates are also only of moderate (99%) purity,26 leading to electrochemical side reactions which can result in an unintentional modification of electrodes and SEI chemistry. An alternative approach to obtaining an appropriate electrolyte involves the use of fluorinated solvents which have high SLDs and low incoherent scattering cross-sections due to the F atoms (5.65 fm, 0.0008 b) and can be prepared at high (>99.9%) purity.31 In addition, fluorinated solvents and additives have a number of other advantageous properties for Li-ion battery electrolytes: high oxidation potential, low flammability, and attractive SEI characteristics.1,4,8,32–34 The use in this work of a simple fluorinated electrolyte serves to aid in understanding the role of fluorinated additives and solvents in the formation and final properties of SEIs formed in next-generation electrolytes which utilize such components.
To investigate potential fluorinated electrolyte solvents, d6-dimethyl perfluoroglutarate was synthesized with high (≥99.9%) purity and used as a low-scattering electrolyte solvent for in situ NR. The electrochemical properties of a series of perfluorocarboxylate ester based electrolytes have been previously reported along with an in-depth ex situ chemical characterization of the SEI formed on Si electrodes via ex situ XPS.31 This study further investigates the SEI formed by dimethyl perfluoroglutarate using in situ NR for comparison with ex situ XPS. The relationship between the state-of-charge (SOC) of the Si electrode and the SEI composition and thickness differs when analyzed via ex situ XPS and in situ NR, demonstrating the importance of in situ characterization.
2. Materials and methods
All reagents were used as received unless otherwise noted. Those used in Li-ion battery cells were stored in a dry Ar-filled glovebox (<5.0 ppm O2, <100 ppb H2O) prior to cell fabrication.2.1 Perfluorocarboxylic acid esterification
Dimethyl perfluoroglutarate (PF5M2) was synthesized as reported previously via the esterification of perfluoroglutaric acid (Exfluor, 98%) using methanol (MeOH) (Sigma-Aldrich, ≥99.8%) or deuterated methanol (99.8% D, Fisher Scientific) to produce protiated and deuterated solvents as necessary. As-distilled esters were dried by storing over 3A molecular sieves (Alfa Aesar) in an Ar-filled glovebox for two weeks.1H (400 MHz) nuclear magnetic resonance (NMR) and 13C (100 MHz) NMR with inverse-gated 1H decoupling were performed on a Varian Unity Inova and used to verify ester synthesis. Purity was determined using the integral of the CH3 peak in the 1H spectrum of the ester and trace MeOH, the only detectable impurity (ester: 4.0 ppm in 1H and 54.2 ppm in 13C vs. tetramethylsilane (TMS); MeOH: 3.3 ppm and 3.6 ppm in 1H and 48.6 ppm in 13C vs. TMS).
2.2 Fabrication of an electrochemical cell for in situ neutron reflectometry
The thin-film working electrode was deposited by DC magnetron sputtering and evaporation from commercially available targets, Cu (99.99% – Kurt J. Lesker) and Si (99.99% – Kurt J. Lesker), in an in-house sputtering system. Base pressures were below 5 × 10⁻⁸ Torr before Cu sputter deposition and the target to substrate distances were 5 cm. Rates were measured using a quartz crystal microbalance. The Cu films were deposited by DC sputtering at an applied power of 300 W, at 3 mTorr Ar (99.9995%, Air Liquide) for 2 min. The amorphous Si films were deposited by thermal evaporation in a chamber with a base pressure less than 5 × 10⁻⁹ Torr. The samples were not exposed to air between depositions. 50 mm-diameter, 10 mm-thick single-crystal Si substrates were obtained from the Institute of Electronic Materials Technology, Warszawa, Poland.Ti0.68Zr0.32 alloy (subsequently referred to as TiZr) was selected as the Li current collector for two reasons: (1) TiZr is a null (SLD = 0, incoherent) scatterer of neutrons, eliminating the possibility of interfering diffraction peaks in the NR pattern and (2) TiZr does not react chemically or electrochemically with Li. A machined 50 mm-diameter, 1 cm-thick TiZr substrate was cleaned successively in water and isopropanol sonication baths and dried at 120 °C for 2 days. The Li counter electrode (2.9 cm diameter) was prepared using 3/4′′-wide Li-foil (Alfa Aesar), which was scraped clean and pressed onto the TiZr substrate in a dry Ar-filled glovebox.
Wires were attached to the Si and TiZr plates (prior to Li deposition) using silver epoxy (Illinois Tool Works) which were allowed to dry overnight. Silver epoxy was placed on the edge of the Si wafer to come into contact with Cu, which was spilled around the wafer during deposition. The epoxy never came into contact with the electrolyte. Electrodes and 0.1 M LiTFSI in the d6-PF5M2 electrolyte were sealed under dry Ar and transferred to a He-filled glovebox (H2O < 1 ppm; O2 < 7 ppm) located at the beam line for on-site cell assembly.
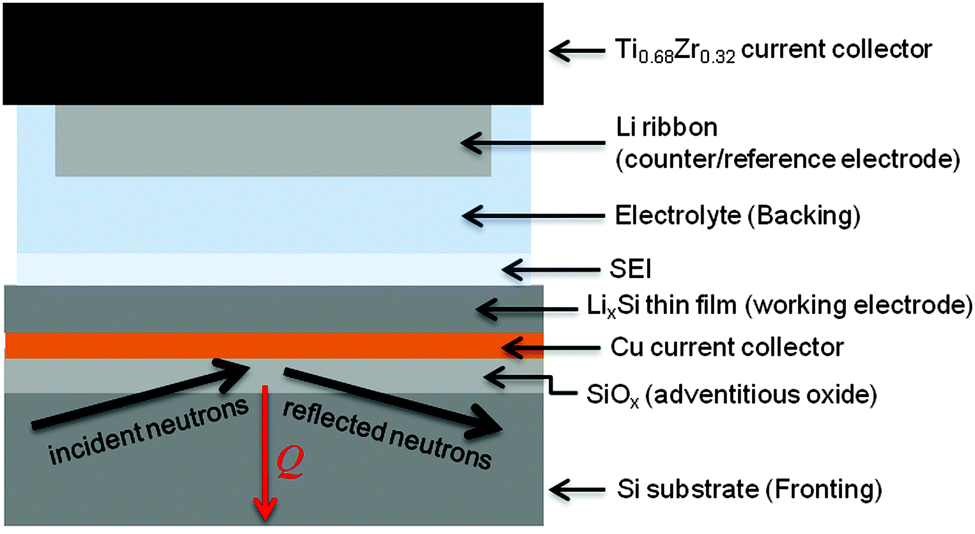
The in situ electrochemical cell for NR was assembled using a specially developed apparatus as previously reported.24–26 The electrodes were separated by a 48 mm diameter Teflon-coated Viton O-ring with a 0.8 mm cross-sectional diameter. The total cell volume was ∼2.5 mL, depending on the amount of Li on the TiZr. This volume was filled with the electrolyte using ports in the TiZr current collector, which were subsequently sealed with Teflon plugs. A diagram of the assembled cell and NR geometry is shown in Fig. 1.
 | ||
| Fig. 1 Experimental geometry for collecting NR data. | ||
2.3 In situ electrochemistry and neutron reflectometry
Electrochemistry was controlled using a Biologic VSP potentiostat. Due to the high resistance of the in situ cell, galvanostatic cycling was not possible, so the cell was cycled using a hybrid galvanostatic-potentiostatic protocol. Electrodes were driven galvanostatically (375 μA) to the desired potential and held potentiostatically for 30 min. The cell was then allowed to equilibrate in the open-circuit state for 30 min prior to NR data collection. Voltages were reported with respect to the Li metal counter electrode (Li/Li+).NR measurements were carried out on a Liquids Reflectometer (LR, Beam Line 4B) at the Spallation Neutron Source (SNS) at Oak Ridge National Laboratory. The LR is a horizontal-geometry instrument which uses the time-of-flight technique with an effective single bandwidth of 3.5 Å at an accelerator pulse frequency of 60 Hz. NR measurements on the assembled cell were carried out in the inverted geometry, using the Si substrate as the incident medium, in order to eliminate anomalous scattering from any potential bubble formation at the top surface of the cell. NR was performed on the as-fabricated electrode in the traditional geometry, with air as the incident medium, in order to determine the initial multilayer parameters prior to any chemical interaction with the electrolyte. For these measurements, neutrons of wavelengths 2.5 Å to 17 Å together with four angles of incidence, θ = 0.60°, 0.69°, 1.37°, and 2.71°, provided a wave vector transfer (Q) range extending from 0.008 Å−1 to 0.22 Å−1. An incident beam slit was adjusted for each angle in order to maintain a constant footprint on the sample.
Reflected neutrons are collected in a two-dimensional position sensitive detector. These data are processed using the Mantid data analysis framework to obtain the reflectivity profile.35 The background intensity from incoherent and inelastic scattering is determined from the off-specular intensity and subtracted from the specular intensity (ESI,† Fig. S1). The final reflectivity is obtained by absolutely normalizing the resulting intensity using attenuation parameters experimentally determined from an uncoated single-crystal Si substrate.
2.4 Fitting of neutron reflectometry data
Modeling of the neutron reflectivity data was done using the Motofit program.27 Due to the difficulty in background subtraction at low signal intensity, fitting was only performed up to Q = 0.1 Å−1. The details of the analysis, including the estimation of the uncertainties, can be found in a previous study.26 Model constraints were added to analysis described in the reference stated above using the well-defined relationship between the LixSi alloy stoichiometry and the unit cell volume,36 | (1) |
 | (2) |
2.5 Ex situ characterization
Si thin-film electrodes were prepared via radio-frequency (RF) magnetron sputtering using an undoped Si target under Ar at 7.5 mTorr and 90 W RF power. The deposition rate was determined to be 8 nm min−1 using a quartz crystal microbalance (Inficon). Si was deposited for 10 min onto a rough electrochemical-grade Cu foil (Oak-Mitsui). The Si films were then cut into either 13 mm- or 8 mm-diameter electrodes as necessary.The effect of cycling on electrolyte composition was investigated via ex situ NMR. Cycled electrolytes were prepared by galvanostatically (10 μA) discharging electrolytes for 18 h in a two-electrode Swagelok-type cell with an 8 mm Si thin-film working electrode and a Li counter electrode and ∼1 mL protiated or deuterated electrolytes. Two layers of a 0.14 mm-thick PEEK mesh (McMaster Carr) were used as a separator in order to ensure a large electrolyte volume for analysis. Swagelok cells were disassembled in a dry Ar glovebox and ∼0.75 mL of each cycled and uncycled electrolyte was transferred to a 5 mm NMR tube. The tubes were then sealed with a polypropylene cap followed by placing a thin bead of epoxy (Loctite Hysol 1C) on the lip of the polypropylene cap for air-tightness before removing from the glovebox. 1H (400 MHz), 13C (101 MHz) with inverse-gated 1H decoupling, 19F (376 MHz), and 7Li (155 MHz) NMR were carried out on a Bruker Avance III spectrometer. 1H spectra were referenced to the most intense impurity signal (1.35 ppm vs. TMS). 13C and 19F spectra were referenced to the most intense CF2 peak (109.43 ppm vs. TMS and −119.60 ppm vs. CFCl3, respectively). These secondary references were chosen in order to avoid isotopically induced shifts from deuteration on the CH3 signal (0.04 ppm in 1H and 0.70 ppm in 13C). Due to the absence of an accurate (<0.01 ppm) secondary standard, 7Li peaks were set to 0 ppm and are only used to demonstrate changes in peak width and intensity with cycling.
The atomic composition of the SEI formed on Si thin-film electrodes was characterized as a function of SOC via ex situ XPS. CR2023 stainless steel coin cells (Pred Materials) were prepared using Li ribbons, porous polypropylene separators (Treopore) wetted with an electrolyte, and 13 mm Si thin-film electrodes. Coin cells were galvanostatically cycled at 10 μA, corresponding to an approximate cycling rate of C/10 (fully discharged in 10 h), on a Maccor 4000 battery cycler and stopped at specific potentials related to observed electrochemical reactions. Cycled coin cells were then transferred into a dry Ar-filled glovebox for decrimping. Electrodes were rinsed with 2 mL of DMC (Aldrich, 99.9%) to remove an excess of electrolyte, dried under vacuum, and sectioned for ex situ analysis of insoluble SEI components. Electrodes were transferred from the glovebox to the XPS sample stage under vacuum in a specially developed transfer chamber to prevent decomposition upon exposure to air. XPS data were collected on a PHI 3056 with an Al anode source operating at 15 kV and 350 mA. High-resolution spectra were collected using a pass energy of 5.85 eV with 0.05 eV steps. Peak fitting and quantitative elemental analysis were performed using the PHI Multipak analysis suite and standard sensitivity factors. Binding energies were referenced to the C 1s C–H peak (284.8 eV).
3. Results and discussion
This work investigates the SEI formation over an amorphous silicon electrode material. In a “full-cell” configuration, balanced cathode-anode capacities, the silicon would be the anode with a potential of about 0.2 V (vs. Li/Li+). In this study the cell is run in a “half-cell” configuration where there is an excess of Li species from a pure Li foil and the reported potential is relative to the standard Li/Li+ potential (∼3.05 V vs. SHE).13C and 1H NMR revealed that both protiated and deuterated esters were of much higher purity (>99.9 mole%) than commercially available deuterated carbonates typically used for in situ neutron scattering studies;26 however these solvents had little solubility for most Li salts. The exception was LiTFSI, which is able to dissolve up to 0.1 M, resulting in an ionic conductivity of 1.87 × 10⁻² mS cm−1, far too low for use in a standard composite battery formulation but sufficient for experimental investigation. Although, given the reduction potential of the electrolyte it may be a good additive for other electrolyte formulations and can also serve as a model to provide insight into the chemistry of more conventional fluorinated electrolytes. Analysis of off-specular scattering and diffuse scattering profiles (ESI,† Fig. S1 and S2) demonstrates that perfluorocarboxylates have small scattering cross-sections, suggesting that these solvents may be useful for developing in situ neutron scattering studies.
3.1 In situ interface characterization using neutron reflectometry
Previous results enabled us to identify regions of interest for in situ NR studies.31 The differential capacity (dQC/dV) curve for the first cycle of a Si thin-film coin cell cycled galvanostatically at 10 μA is shown in Fig. 2. The major electrochemical reactions that take place during the first lithiation of Si thin-film electrodes with a 0.1 M LiTFSI in the PF5M2 electrolyte are as follows: SEI formation, ∼1.0 V (Fig. 2, green); adventitious oxide lithiation, 0.48 V (orange); irreversible Si lithiation feature, 0.26 V (blue); first lithiation step, 0.21 V (red); second lithiation step, <0.07 V (red); and delithiation, 0.40 V and 0.54 V (red).31 Furthermore, additional coin cells were cycled to 0.6 V, 0.4 V, 0.2 V, 0.07 V, and 2.5 V (Fig. 2, black arrows) for ex situ XPS investigations to support the NR investigation of the SEI chemistry. A detailed analysis of the chemical composition and evolution of the SEI as determined via ex situ XPS is discussed elsewhere.31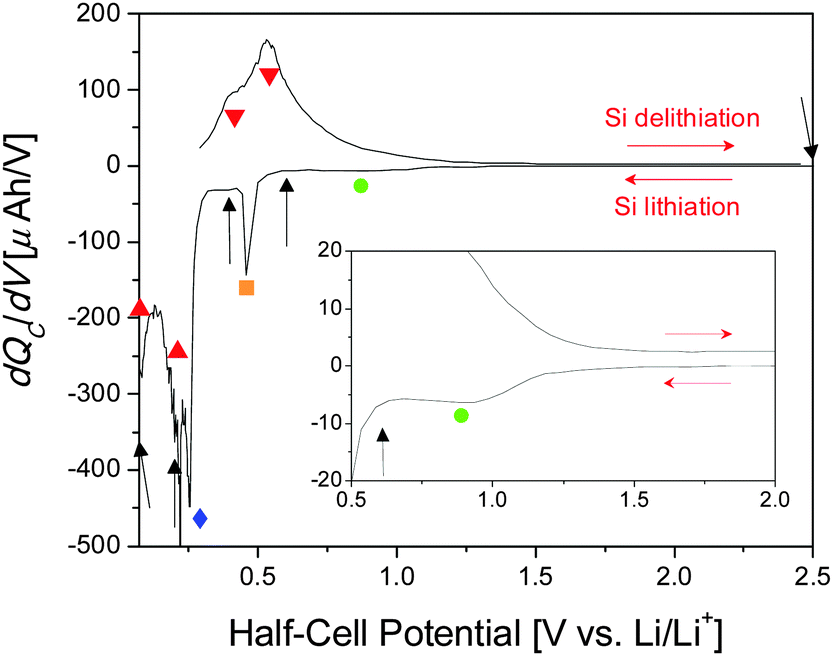 | ||
| Fig. 2 Differential capacity curve for the first cycle of a Si thin-film half-cell used for ex situ analysis. Black arrows mark stopping potentials for ex situ XPS. Shapes mark identified electrochemical reactions: SEI formation (green ●), SiO2 lithiation (orange ■), irreversible lithiation (blue ◆), Si lithiation (red ▲), and Si delithiation (red ▼). | ||
Fig. 3 shows the voltage and current profiles for the electrode used in the in situ NR cell as a function of time. The NR data were collected during the rest steps for the voltage and current collection. While the cycling of battery materials is typically performed galvanostatically (constant current), the high resistance of the electrode used in the NR cell (>1 kΩ) resulted in a large iR loss which made stopping at predetermined states of charge difficult. For this reason, a hybrid galvanostatic-potentiostatic (constant voltage) protocol was utilized. Holding the electrode at a predetermined potential allowed the current to decay thereby mitigating the iR loss and allowing for comparison with a traditional cell with a lower resistance, i.e. a coin cell. After the potentiostatic hold, an additional relaxation step was performed at open circuit to allow for cell equilibration, e.g. Li redistribution, to prevent compositional changes from occurring during NR data collection. Even though the cell was allowed to relax at open circuit for 30 min prior to the collection of NR data, continued potential relaxation during NR data collection is apparent; however, this relaxation is relatively small, implying that any additional changes in the electrode and SEI are minimal and acceptable. Furthermore, as our goal was to characterize the SEI structure small changes in Li–Si chemistry will not influence the SEI chemistry significantly.
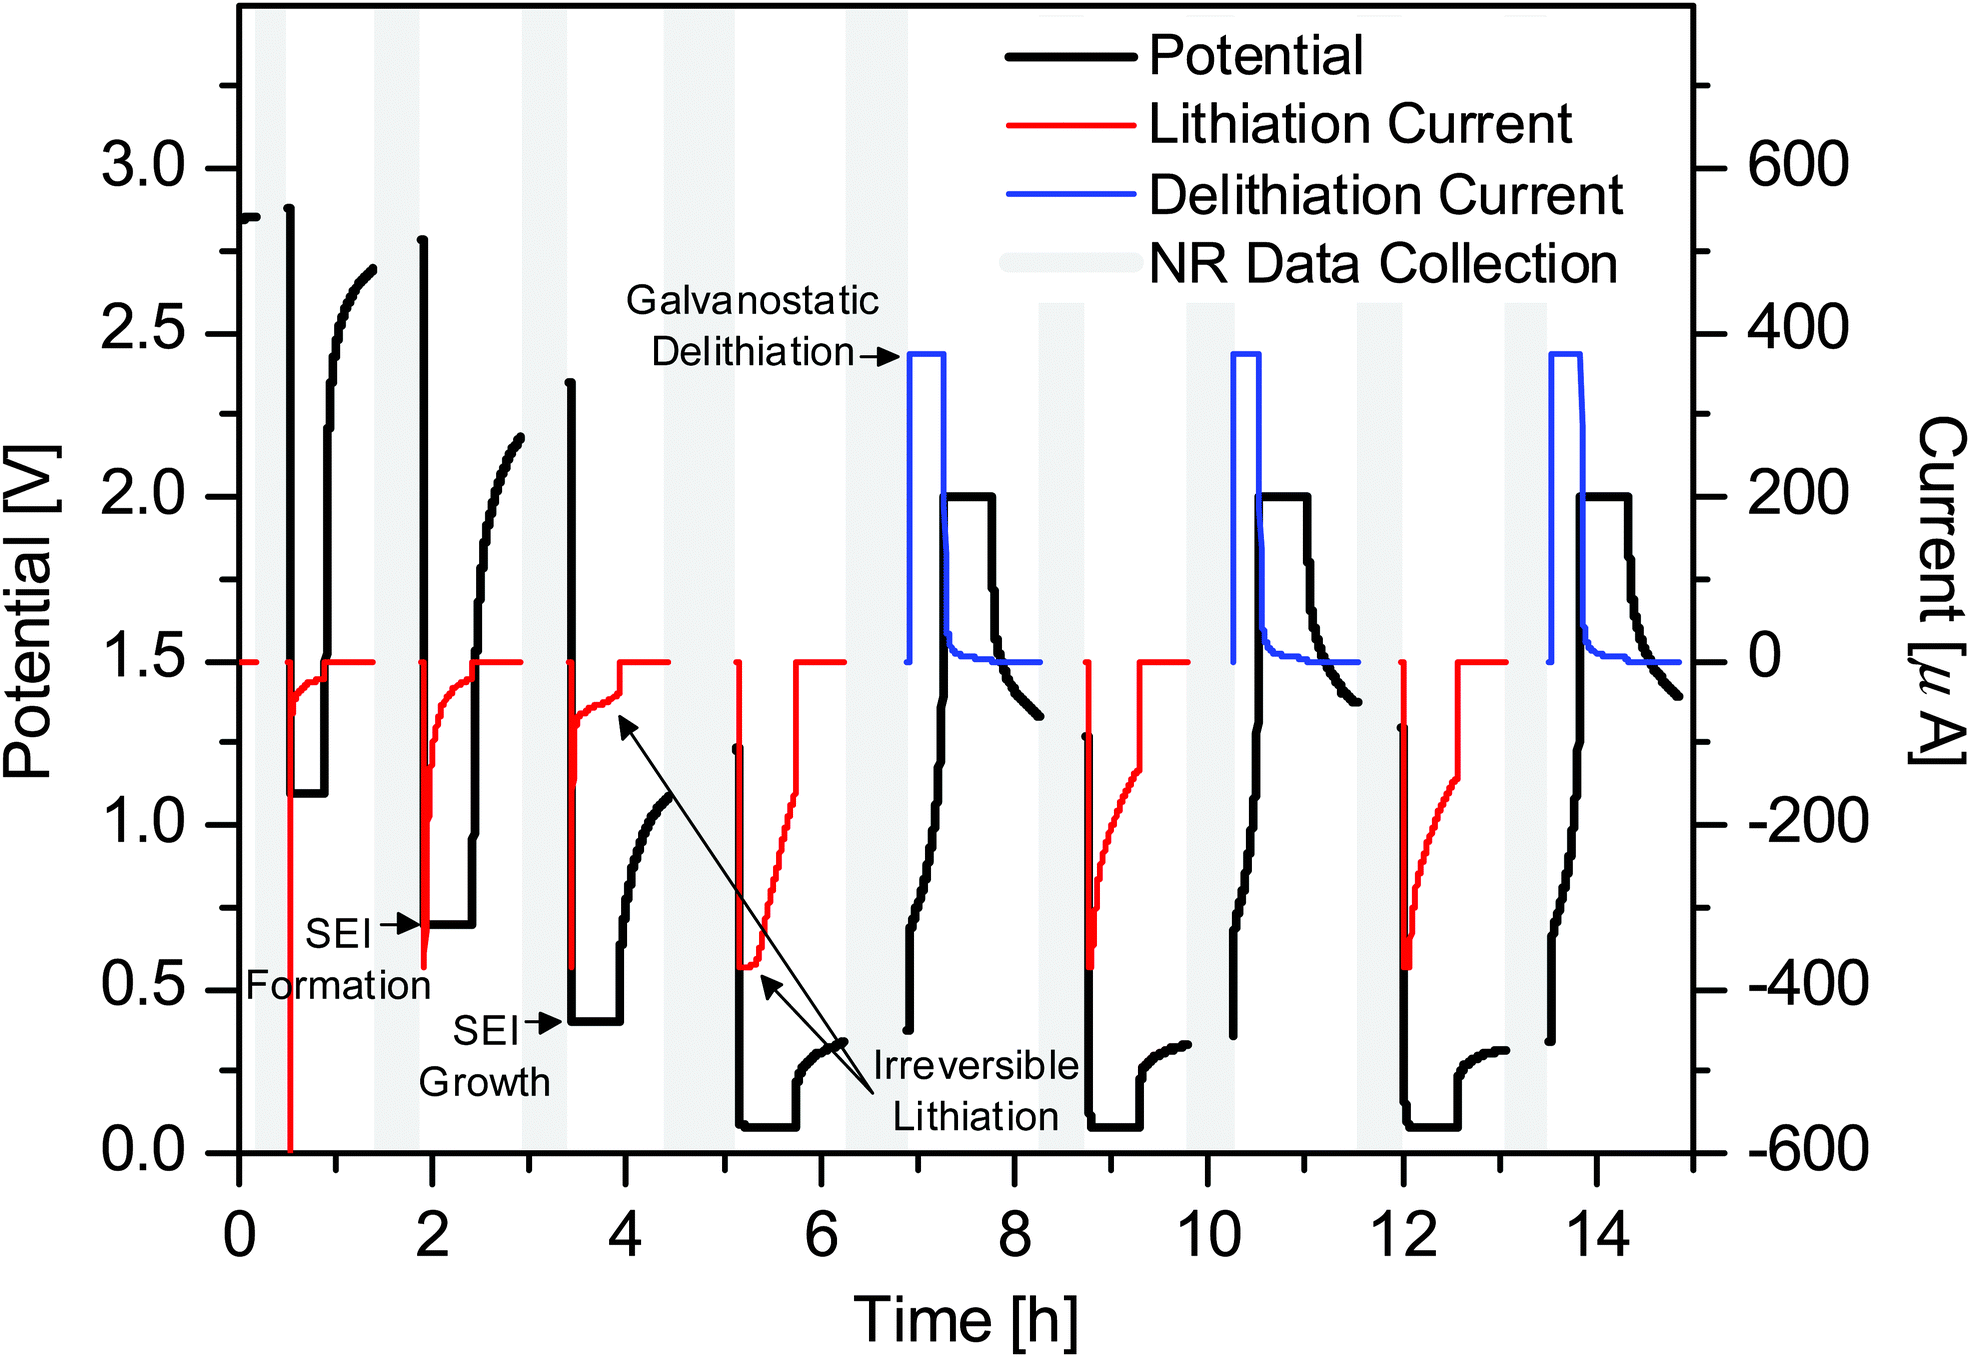 | ||
| Fig. 3 Electrochemical data for in situ NR cells. NR data were collected during the gaps (grey). The voltage profile is shown in black while the current profile is shown in red (lithiation) and blue (delithiation). | ||
3.2 Neutron reflectometry
The in situ electrode used in this study was initially measured in air in order to determine the thickness of the Si working electrode, Cu current collector, and adventitious oxide layers before any chemical or electrochemical reactions took place. It was determined that the Si electrode and copper current collectors were 48.3 and 7.4 nm thick, respectively, and that there was a 2.3 nm SiO2 layer between the single-crystal Si substrate and the Cu current collector (ESI,† Table S1). Adding a SiO2 layer on the surface of the Si electrode in the model did not improve the fit quality, so it is assumed that any adventitious oxide on the surface of the electrode is negligible or contrast matched to the electrolyte. This is confirmed by the XPS studies discussed below. Neutron reflectivity curves obtained for the electrode at different cell potentials and the corresponding fits to the data fits are shown in Fig. 4A–I. From these data one can see no change in the OCV and 1.1 V data indicating no change in the Si electrode stoichiometry and no clear formation of a condensed surface layer or SEI reaction product. Furthermore, analysis of the in-air (not shown) and OCV NR profiles indicates that no changes occur to the electrode upon exposure to the electrolyte.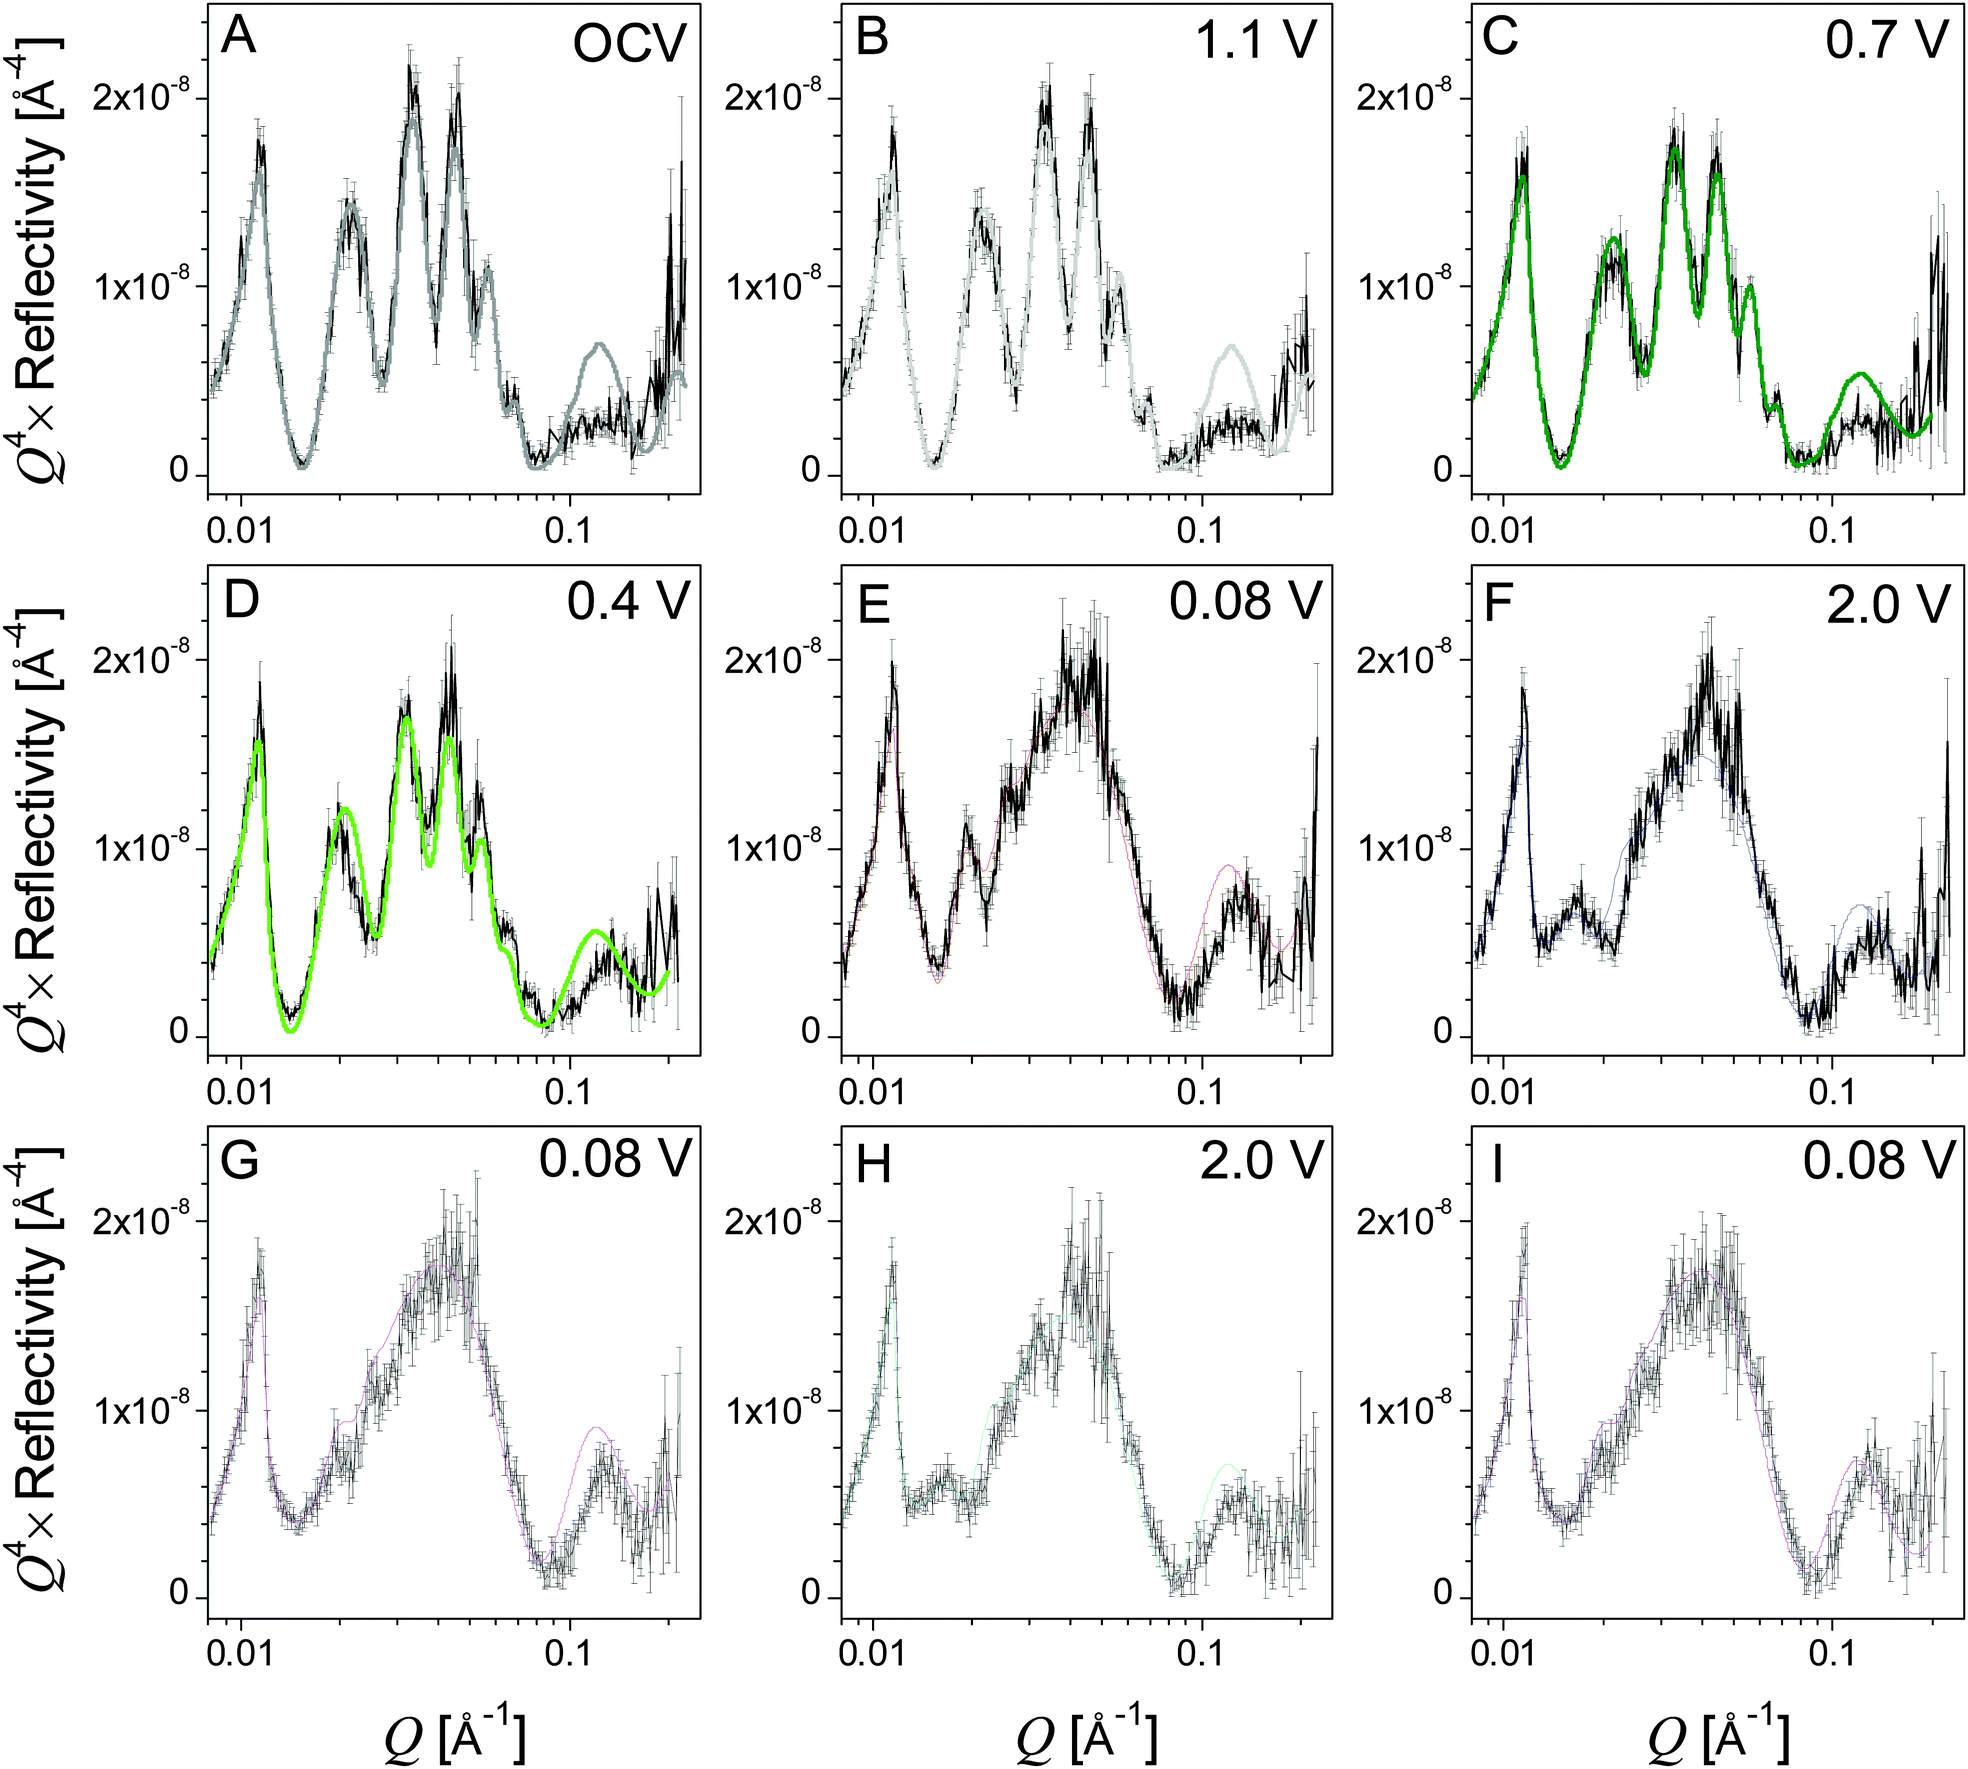 | ||
| Fig. 4 NR data (black points) and fits (colored lines) in order of collection (A–I). | ||
However, there are subtle but clear differences in the reflectometry profile at high Q upon reaching 0.7 V, where we see evidence for SEI formation in the electrochemical data (Fig. 2). Fitting this profile revealed a minor expansion of the Si layer (48.3 to 48.9 nm) due to slight lithiation and the formation of a 14.4 nm surface reaction layer attributed to the SEI. Fig. 5 shows a representation of SLD as a function of distance from the Cu/Si interface determined from the fits to the NR data. The SEI layer is indicated by the arrows at the inflection point in the curve. This layer does not appear as a distinct well defined heterostructure. Instead it appears to be a diffuse layer between the silicon anode and the bulk electrolyte. Removing this layer from the structural models prevents obtaining good fits of the data, and the poor sensitivity to the layer chemistry is reflected in the errors. The large errors are due to the large roughness parameters, which prevent us from seeing a well-defined layer in the SLD profile. It should be noted that a roughness parameter in the model does not allow us to differentiate between a surface roughness and compositional gradients. Fig. 5 and Table 1 show that the SEI has a refined SLD of 4.5 which is lower than the SLD of the electrolyte (4.8 × 10⁻⁶ Å−2). This lower SLD has to be due to the formation of a phase with slightly higher Li content than the bulk electrolyte or a film made from the electrolyte but with a lower density than the electrolyte. Given that a significant decrease in density with solid formation is unlikely and additional evidence of Li in the SEI layer (discussed below), this reduction in SLD is attributed to an increase in the Li content of the SEI. Upon continued lithiation (0.4 V) we see a further loss in the structure within the NR data consistent with an increased Li–Si ratio and a slight thickening of the SEI layer (14.4 to 16.7 nm), Fig. 5.
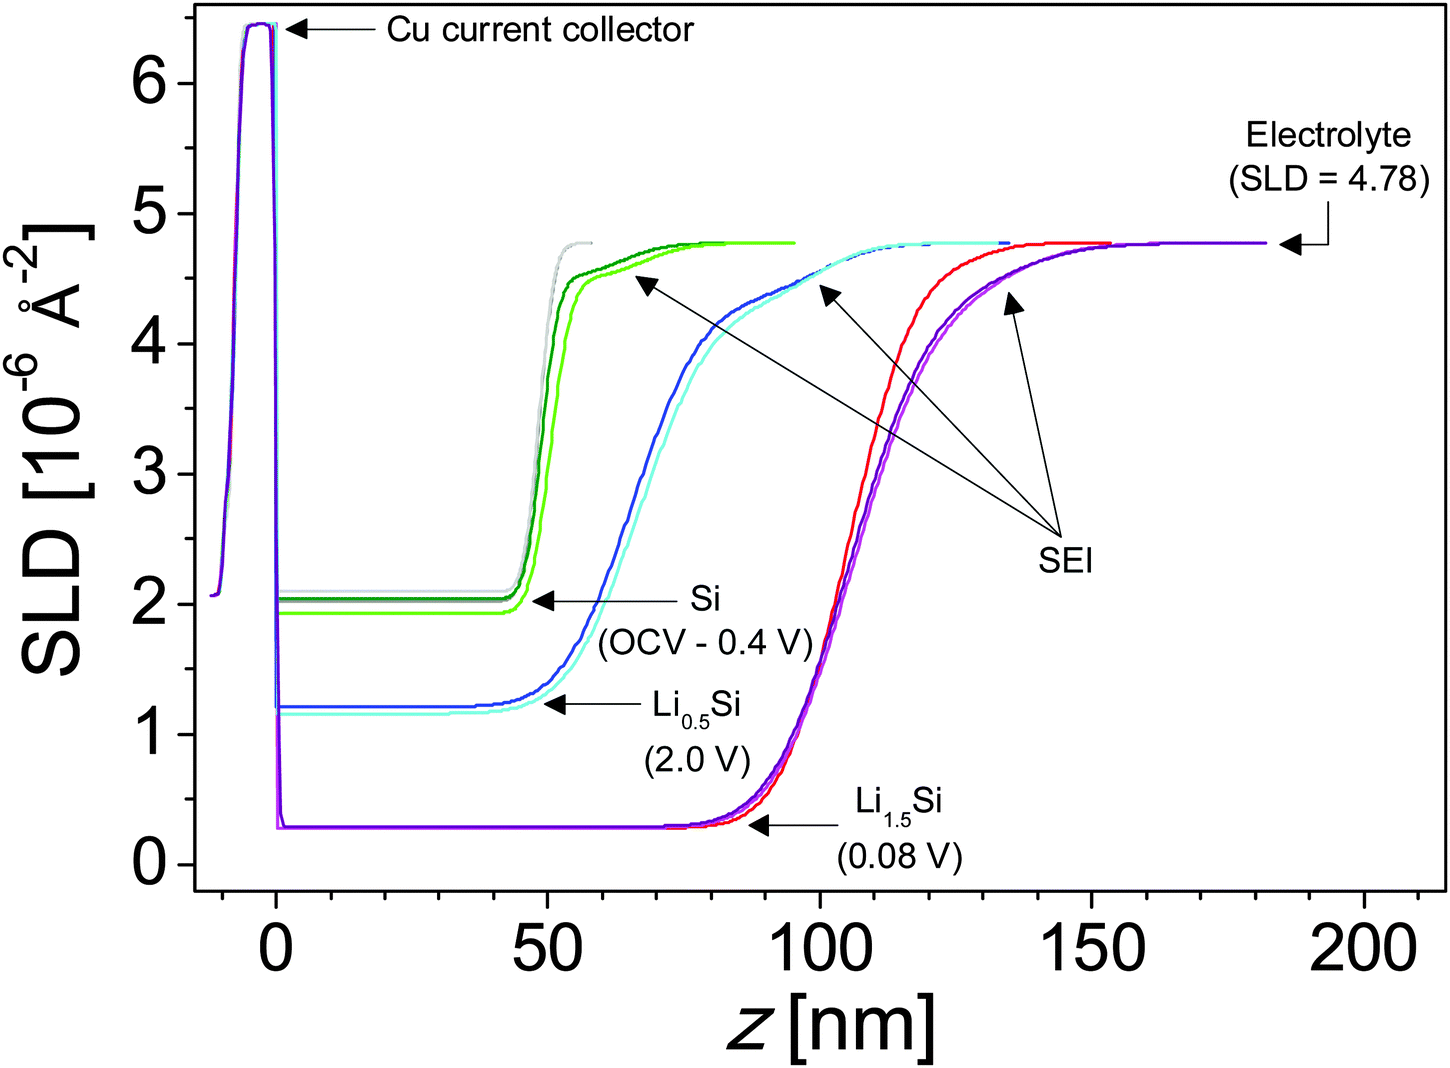 | ||
| Fig. 5 SLD profiles representing the tabulated fit parameters (Table 1). Colors match the corresponding fits from Fig. 7. Major layers are labeled. | ||
| Potentiostatic voltage | Si Electrode thickness [nm] | Li/Si | SEI thickness [nm] | SEI SLD [10−6 Å−2] | χ2 |
|---|---|---|---|---|---|
| In air | 48.3 ± 0.1 | 2.2 | |||
| OCV | 48.4 ± 0.1 | 0.00 | 2.0 | ||
| 1.1 V | 48.3 ± 0.1 | 0.00 | 1.8 | ||
| 0.7 V | 48.9 ± 0.1 | 0.01 | 14.4 ± 3.2 | 4.5 ± 0.1 | 2.3 |
| 0.4 V | 50.5 ± 0.5 | 0.06 | 16.7 ± 6.4 | 4.5 ± 0.2 | 7.0 |
| 0.08 V | 106.0 ± 0.3 | 1.53 | 26.6 ± 2.1 | 4.7 ± 0.1 | 2.9 |
| 2.0 V | 65.4 ± 1.1 | 0.45 | 34.2 ± 7.2 | 4.3 ± 0.3 | 4.1 |
| 0.08 V | 105.9 ± 0.7 | 1.53 | 27.3 ± 2.3 | 4.3 ± 0.1 | 3.0 |
| 2.0 V | 66.9 ± 0.6 | 0.49 | 32.2 ± 1.5 | 4.3 ± 0.1 | 3.2 |
| 0.08 V | 105.5 ± 0.7 | 1.52 | 28.6 ± 4.0 | 4.3 ± 0.1 | 3.9 |
Upon further lithiation (0.08 V) we see a significant change in the NR data due to the growth of the Li–Si electrode layer (50.5 to 106 nm) and the further increase in the SEI thickness (16.7 to 26.6 nm). The SLD of the Si-layer decreases from 2.07 × 10⁻⁶ Å−2 to 0.28 × 10⁻⁶ Å−2 due to the incorporation of low-SLD Li. Eqn 1 and 2 indicate that lithiation of the electrode results in the alloy Li1.5Si, well below the full lithiation capacity of Li3.75Si. Furthermore, delithiation of the electrode does not go to completion, resulting in an electrode composition of Li0.45Si, suggesting that a significant portion of the Si lithiation capacity is irreversible.
To confirm that the Li/Si ratio determined via NR is consistent with the electrochemical results we compared the reversible Li/Si ratio from NR to the reversible electrochemical capacity of the cell. If the entire electrode area within the O-ring (18 cm2, 4.8 cm diameter) was lithiated uniformly, the observed reversible electrochemical capacity (142 μA h) indicates that the electrode has a reversible Li capacity of 0.69 Li per Si. This is significantly lower than the changes in electrode thickness from NR (eqn (1)) which suggests that the electrode has a reversible capacity of ∼1.0 Li per Si. Since the Li metal electrode (∼2.9 cm diameter) is smaller than the Si electrode lithiation of the Si appears to occur primarily under the Li counter electrode. A comparison of the Li/Si ratio determined via NR and in situ charge and discharge capacities suggest an effective Si electrode area of ∼10 cm2 (3.6 cm diameter), close to the size of the Li counter electrode yet still significantly larger than the NR footprint (4 mm × 2 mm centered on the Si electrode/Li counter electrode). Since the electrode area that contains the NR footprint is centered on the Li counter electrode and much smaller, it is expected to be uniformly lithiated. While a significant portion of the Si electrode does not participate in electrochemical lithiation, Li diffusion from the active area during both electrochemical lithiation and relaxation contributes to lithiation of the inactive area. As long as the Li/Si ratio in the inactive area lies below ∼0.45, Li diffusion will contribute to the irreversible lithiation capacity.
Since the NR cell is not operated under galvanostatic conditions (Fig. 3), it cannot be directly compared to a standard coin cell using differential capacity curves (Fig. 2). Due to the differences in the iR drop between the NR and coin cells the recorded voltage for the states of charge was slightly different from that designed in the experiment. However, the compositions and state of charge are close enough to enable comparisons between the NR and the XPS data.
As noted previously the SEI thickness increased from 16.7 to 26.6 nm when lithiated to Li1.5Si. Interestingly, the SLD of the SEI increased from 4.5 to 4.7 × 10⁻⁶ Å−2. Since ex situ XPS indicates that Li content increases during the first lithiation (Section 3.3), which is expected to decrease SLD, this increase in SLD could be due to a densification of the SEI or an increase in high scattering length nuclei like C, O, F, or 2H, which is not captured via XPS. A large (>66%) increase in SEI porosity (filled with high-SLD electrolyte) could also explain this change; however, we are unaware of any mechanism which would induce such a sudden and significant increase in porosity and further find this explanation unlikely in a period when both in situ NR and ex situ XPS indicate SEI growth, from 14.4 ± 3.2 nm to 26.6 ± 2.1 nm (NR) and 5.3 ± 2.3 nm to 7.9 ± 3.4 nm (XPS – discussed below).
Upon delithiation the electrode thickness reduces significantly (106 to 65.4 nm) indicating an electrode composition of Li0.45Si. Interestingly, the thickness of the SEI increases further to 34.2 nm with a corresponding decrease in the SLD to 4.3 ± 0.3 × 10⁻⁶ Å−2 indicating an increase in Li content or a decrease in SEI density. Since ex situ XPS indicates that Li content is decreasing (Section 3.3) during this stage, the change in SLD is most likely due to a densification (increase in Nd) of the SEI. Upon a second lithiation (Li1.5Si) the SEI layer contracts significantly (34.2 to 27.3 nm) while maintaining the SEI SLD. A similar expansion and contraction are observed with additional cycling. This swelling and contracting has been previously observed via in situ NR studies on the SEI formed in traditional carbonate electrolytes.26 The degree of swelling and contraction decreases with additional cycling—a 6.9 nm difference after the first cycle and a 3.6 nm difference after the second cycle—suggesting that the SEI is approaching an equilibrium state. If this contraction and swelling is due in part to changes in the atomic density of the SEI, the lack of corresponding changes in the SLD of the SEI indicates that compositional changes occur in concert with and counteracting the effects of changes in atomic density. The most likely compositional difference is the Li content. Increasing the density of the SEI (contraction) increases the SLD while increasing the Li content reduces the SLD. If the changes in SEI thickness are indicative of changes in atomic density and changes in the SLD are indicative of changes in the Li content of the SEI, the SEI on the Si electrode in the lithiated state (Li1.5Si) has both a higher atomic density and higher Li content than the SEI on the Si electrode in the delithiated state (Li0.5Si).
3.3 Ex situ X-ray photoelectron spectroscopy
Most of the community's understanding of SEI chemistry comes from traditional ex situ methods like X-ray photoelectron spectroscopy. To understand how the SEI chemistry determined via NR compares with traditional XPS studies a detailed analysis of previously collected XPS data was performed to estimate layer thicknesses and compositions. The published XPS data indicate that the SEI chemistry in the PF5M2 electrolytes is very similar to a standard EC/DMC based electrolyte.31 Indeed, the SEI was shown to contain LiF and Li2CO3 type components as well as organic carbonates (C 1s: CO3, 289 eV; O 1s: C![[double bond, length as m-dash]](https://www.rsc.org/images/entities/char_e001.gif) O, 532 eV, and C–O, 533 eV), carboxylates (C 1s: CO2, 289 eV; O 1s: CO and C–O), ethers/esters (C 1s: CO, 285.5 eV; O 1s: C–O), and fluorides (C 1s: CF, 287 eV; F1s: CF 689 eV) in similar concentrations. For this work we turned our attention to the Si 2p spectra collected for the samples, which were not previously discussed in great detail. The Si 2p signal intensity can be used to estimate the layer thickness using the following equation:
O, 532 eV, and C–O, 533 eV), carboxylates (C 1s: CO2, 289 eV; O 1s: CO and C–O), ethers/esters (C 1s: CO, 285.5 eV; O 1s: C–O), and fluorides (C 1s: CF, 287 eV; F1s: CF 689 eV) in similar concentrations. For this work we turned our attention to the Si 2p spectra collected for the samples, which were not previously discussed in great detail. The Si 2p signal intensity can be used to estimate the layer thickness using the following equation: | (3) |
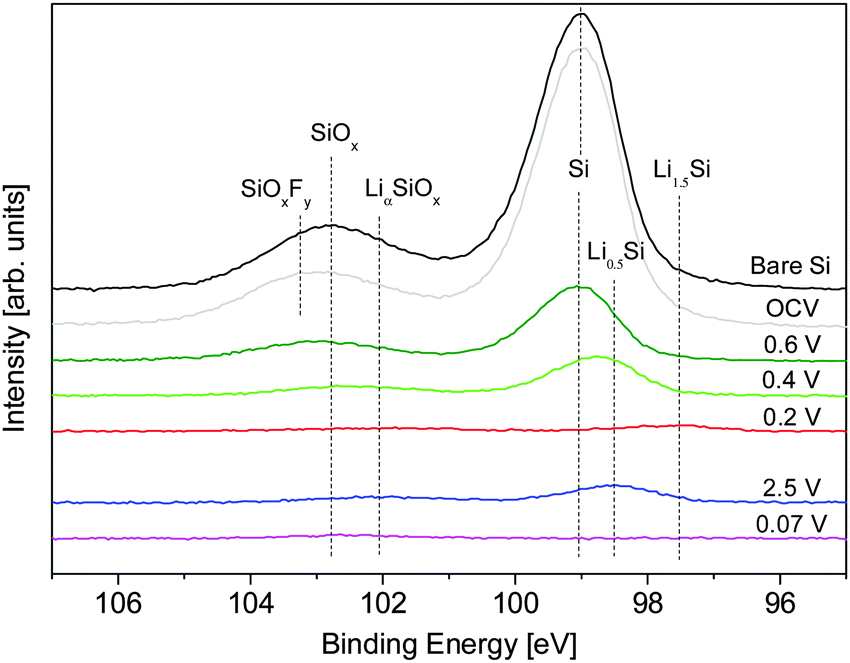 | ||
| Fig. 6 Ex situ Si 2p XPS spectra used to calculate the SEI thickness using eqn (3). Spectra colored to match those of the closest SLD profile determined from NR. | ||
For an accurate determination of the SEI thickness, changes in the thickness and Nd(Si) of layers 2 and 3 must be taken into account. Fortunately, the reactions in these layers are relatively well-defined in the literature and electrochemically well-separated.3,9,31,39 At 0.5 V, the adventitious oxide (layer 2) undergoes irreversible lithiation (4e− + 4Li+ + SiO2 → 2LiO2 + Si) and is assumed to form an intimate mixture of LiO2 and Si, both of which have well-known densities. At lower voltages (<0.3 V) lithiation of the Si (xe− + xLi+ + Si → LixSi) in layers 2 and 3 begins to occur, where Nd(Si) can be determined from eqn (1). Based on the NR results, x ≈ 1.5 for 0.2 V, x = 3.75 for 0.07 V, and x = 0.5 for 2.5 V. Although the differential capacity curves indicate that the electrode does not reach full lithiation (Li3.75Si) at 0.07 V, assuming full lithiation underestimates SEI thickness and represents the most conservative estimate and is sufficient for analysis. The thickness, composition, and Nd(Si) for each layer as a function of SOC are summarized in Table 2.
| Potential | Layer 1 (SEI) | Layer 2 (SiO2) | Layer 3 (Si) | |||||
|---|---|---|---|---|---|---|---|---|
| Integrated intensity [arb. units] | Thickness [nm] | SLD Nd = Li2CO3 (EC, LiF) [10−6 Å−2] | Composition | Thickness [nm] | Nd (Si) [nm−3] | Composition | Nd (Si) [nm−3] | |
| Bare Si | 98.70 | SiO2 | 1.9 ± 0.8 | 26.54 | Si | 49.94 | ||
| OCV | 96.79 | SiO2 | 1.9 ± 0.8 | 26.54 | Si | 49.94 | ||
| 0.6 V | 26.40 | 4.5 ± 1.9 | 4.6 (4.0, 5.4) | SiO2 | 1.9 ± 0.8 | 26.54 | Si | 49.94 |
| 0.4 V | 14.62 | 5.3 ± 2.3 | 4.4 (3.9, 5.3) | Li2O + Si | 3.5 ± 1.5 | 14.43 | Si | 49.94 |
| 0.2 V | 3.45 | 8.0 ± 3.4 | 3.4 (3.1, 4.1) | Li2O + Li1.5Si | 4.6 ± 2.0 | 10.69 | Li1.5Si | 23.09 |
| 0.07 V | 3.4 (3.0, 4.0) | Li2O + Li3.75Si | ||||||
| 2.5 V | 6.93 | 6.9 ± 3.0 | 4.1 (3.6, 4.9) | Li2O + Li0.5Si | 3.9 ± 1.7 | 12.97 | Li0.5Si | 35.99 |
| 0.07 V | 0.83 | 12.5 ± 5.4 | 3.9 (3.4, 4.6) | Li2O + Li3.75Si | 5.0 ± 2.2 | 7.84 | Li3.75Si | 12.78 |
Only layer 1 (SEI) contains information that is not defined a priori for this analysis so only the properties of that layer can be determined. Ex situ XPS shows that the SEI forms electrochemically above 0.6 V (4.5 ± 1.9 nm) followed by continued growth during SiO2 (0.4 V, 5.3 ± 2.3 nm) and Si (0.2 V, 7.9 ± 3.4) lithiation. A Si signal for the first full lithiation (0.07 V) could not be collected, so it is not possible to determine an SEI thickness for this state; however, given the low reduction stability of the fluorinated electrolyte,1,31–33 it is likely that the thickness of the SEI in this state is greater than that in the 0.2 V state. The SEI then shrinks during delithiation (2.5 V, 6.9 ± 3.0 nm) and swells during the second lithiation.
To aid in further discussion, the results from the XPS (Table 2) and NR (Table 1) analysis discussed above are summarized graphically in Fig. 8, which compares the thickness and SLD of the SEI as determined via ex situ XPS (Fig. 8A and C) and in situ NR (Fig. 8B and D). In both cases it can be seen that the SEI layer grows in thickness with lithiation (to 0.2 V) but the magnitude of the increase differs by nearly 10 nm with the SEI layer being thicker when measured in situ. This difference in SEI thickness increases to nearly 20 nm after fully lithiating and delithiating the electrode. Furthermore, upon cycling between lithiated and delithiated states we notice a divergent behavior. Specifically, the SEI swelling observed during lithiation measured via NR appears to be the opposite for the XPS which shows the SEI layer contracting. Upon lithiation the NR-measured SEI thickness decreases by ∼6 nm while the XPS-measured thickness increases by ∼4 nm.
We now turn our attention to the compositions estimated from the XPS studies and analysis of the SLD values. After correcting for (attenuated) O and Li signals from the Si and SiO2 layer, the SLD of the SEI can be estimated directly from the atomic composition determined via XPS (excluding hydrogen) (Fig. 7) using eqn (1). Estimating the SLD from the XPS composition requires an assumption of the average atomic density (Nd) of the SEI. For this purpose, a range of model Nd was chosen: high density (LiF), moderate density (Li2CO3), and low density (EC). Since the actual Nd of the SEI is unknown changes in the SLD of the SEI will be discussed according to the changes in the atomic composition that most influenced that change. Specifically, changes in C (6.65 fm) and Li (−1.90 fm) content of the SEI will drastically affect the predicted SLD, while changes in F and O ratios (5.65 fm and 5.80 fm, respectively) will not have a significant effect on the SLD of the SEI. H in the form of 2H (6.67 fm), which is not detected via XPS but may be present in the SEI, would tend to increase the SLD. The XPS-derived SLD of the SEI at 0.6 V (22.1 at% Li) is 4.6 × 10⁻⁶ Å−2 while at 0.4 V (23.8 at% Li) the SLDxps is 4.4 × 10⁻⁶ Å−2. These values are similar to the SLDs measured using NR (Fig. 8C and D). After further lithiation the XPS-derived SLD of the SEI at 0.2 V (34.9 at% Li) is 3.4 × 10⁻⁶ Å−2 while the SLD of the 0.07 V data (35.2 at% Li) is 3.4 × 10⁻⁶ Å−2. These calculated SLDs are significantly lower than what was measured via NR, even given the large uncertainty in the electron mean free path. This apparent decrease in the SLD has to be due to extra Li in the washed sample or the removal of C, O, F, and D components during washing, given their large SLDs. Delithiation of the electrode causes the SLD to increase as the Li content drops (2.5 V, 4.1 × 10⁻⁶ Å−2, 27.2% Li). The SLD then drops again as the Li content increases during lithiation (0.07 V, 3.9 × 10⁻⁶ Å−2, 29.8% Li). These values are much closer to the SLDs determined via NR, indicating that the compositions from ex situ XPS and in situ NR are approaching unity.
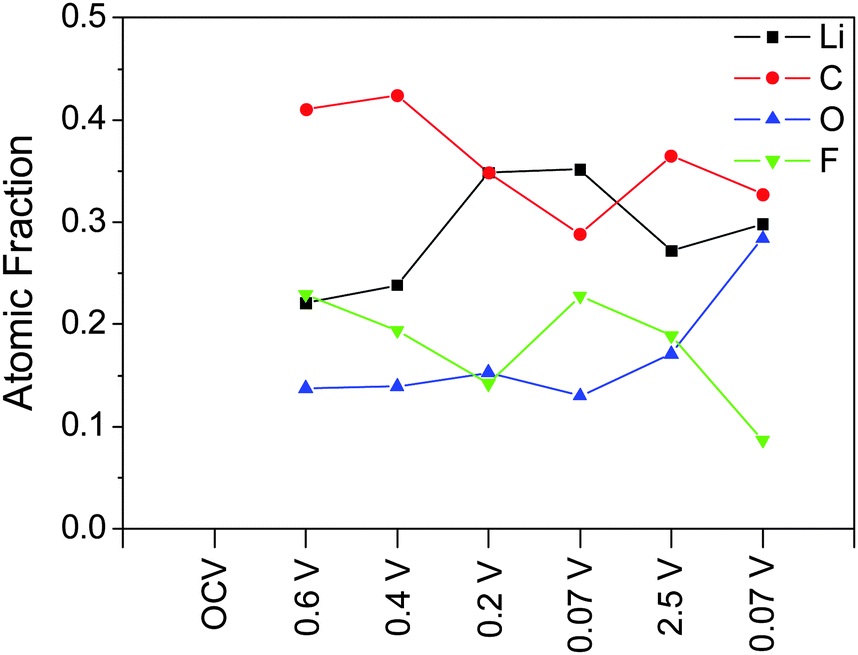 | ||
| Fig. 7 Atomic compositions of the SEI determined from XPS and used to estimate SLD. | ||
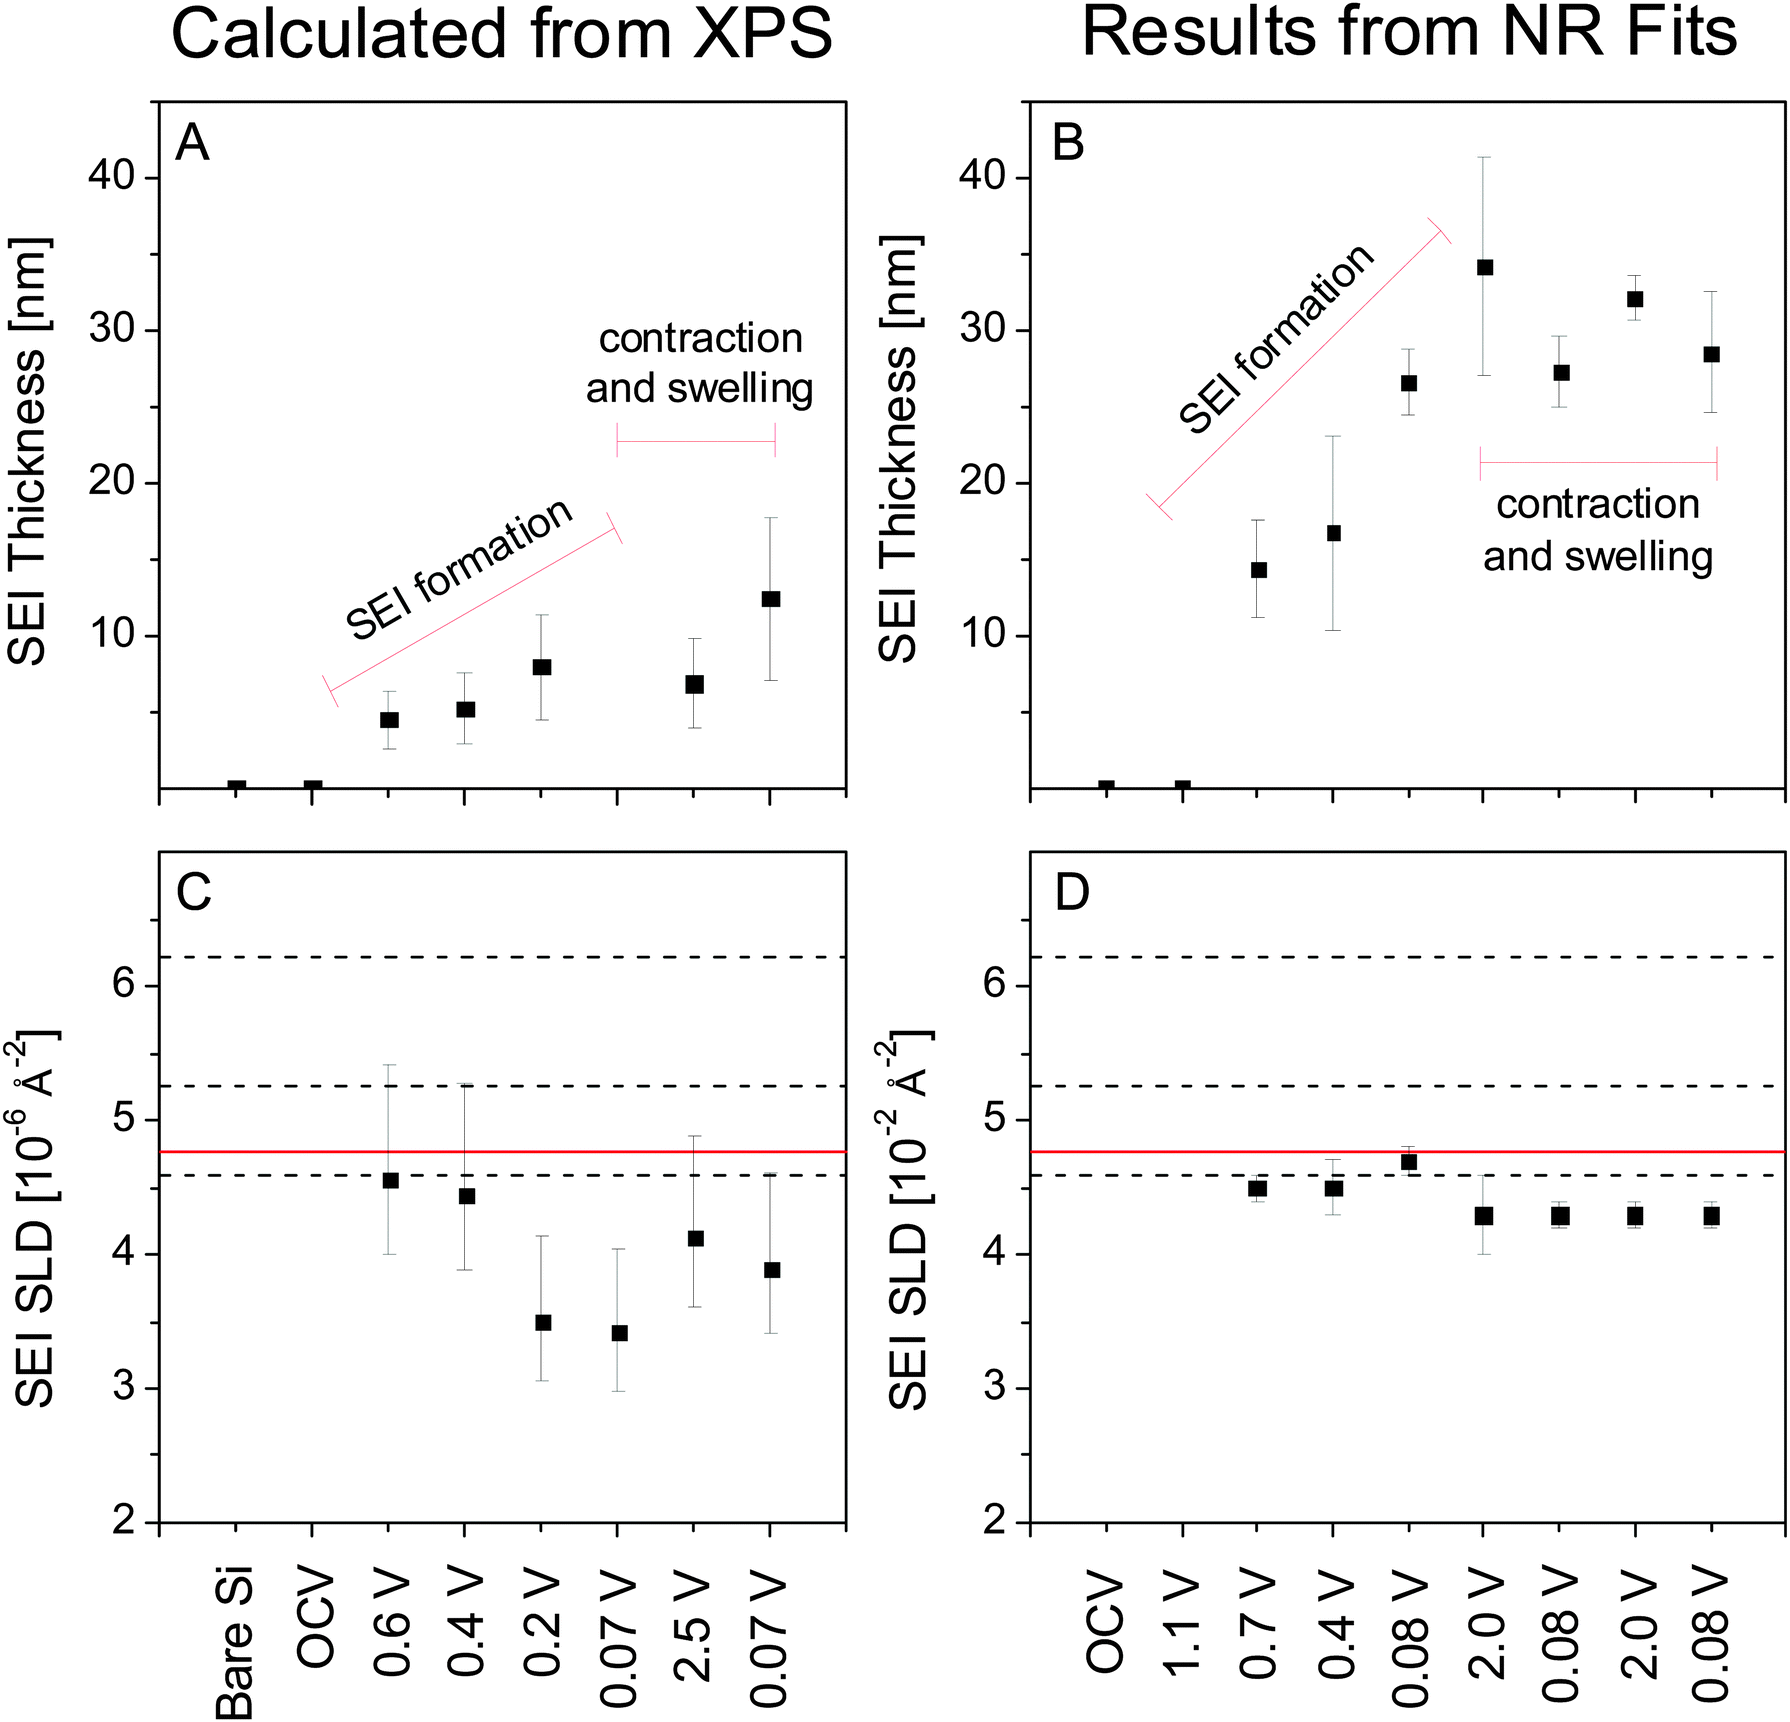 | ||
| Fig. 8 SEI thickness and SLD as determined via ex situ XPS (A and C) and in situ NR (B and D). The black dashed lines in C and D indicate the expected SLD for lithium perfluoroglutarate (Section 3.4) at the atomic density of LiF (upper), Li2CO3 (middle), and EC (lower). The solid red line indicates the SLD of the electrolyte. | ||
The results summarized in Fig. 8 indicate significant differences in the SEI chemistry measured by ex situ and in situ methods. The differences in composition and thickness are likely correlated and originate from three potential causes: (1) the lack of hydrogen sensitivity in XPS, (2) differences in porosity caused by drying the SEI prior to ex situ analysis, and (3) the removal of SEI components during DMC washing prior to ex situ analysis.
It is possible that SLDs calculated from XPS are low due to the insensitivity of XPS to H, which, in the form of 2H (6.67 fm), has a higher scattering length than O (5.80 fm), F (5.65 fm), C (6.65 fm), and Li (−1.90 fm). However, the low hydrogen content of the electrolyte makes this possibility unlikely, and neglecting the hydrogen content fails to explain the observed differences in SEI thickness.
Another possibility is that SEI porosity, which would be present only in the in situ cell, is responsible for this discrepancy. Assuming that these pores are filled with the electrolyte, only for the lowest model density [Nd(SEI) = Nd(EC)] can physically reasonable values of porosity be calculated. Even then, reconciling these values would require 40% to 70% porosity in most of the cases to obtain the SLD observed via NR, much higher than what previous studies suggest.10,40,41 Since this porosity would collapse entirely during drying, prior to collecting XPS data, the thicknesses determined from NR should be 1.7 to 3.3 times as thick as that determined via XPS. While this possibility is not explicitly contradicted by the data, it is on the extreme edge of plausibility. For the SEI formed at the end of the first discharge, these values jump to 90–99% porosity and 10 to 100 times swelling. Though a thickness measurement from XPS is not available for this state, it is highly unlikely that an SEI of 0.3 nm to 4.1 nm would be observed. Changes in porosity are also unable to explain why swelling and contracting of the SEI occur during opposite steps when observed through XPS or NR. For these reasons, it is unlikely that porosity of the SEI measured in situ is the sole source of the differences between the SEI thickness and the SLD measured via XPS or NR.
The third possibility is that rinsing the electrodes prior to XPS, necessary to remove excess electrolyte, dissolves certain components of the SEI. The washing of components from the SEI layer would be consistent with a change in Li/2H content. Specifically, at the initial stages of SEI formation (0.7–0.4 V) a uniform Li-organic layer may have formed which is easy to remove by washing. At 0.2–0.07 V a denser inorganic/organic heterolayer forms. The organic layer can be washed away easily leaving a more inorganic layer comprised of LiF, Li2CO3, etc. This layer would result in the low SLD predicted from fitting the XPS. The differences in the SEI thicknesses must therefore be due to different ratios of inorganic and removable organic components. At higher voltages there are more organic components forming a thicker layer which are dissolved during washing to leave a thin inorganic layer, explaining the observed XPS and NR data, Fig. 8. Combining in situ atomic force microscopy and ex situ XPS, Cresce et al. have shown that the SEI formed in a carbonate electrolyte (1.32 M LiTFSI in EC) on highly oriented pyrolytic graphite (HOPG) is composed of a hard, primarily inorganic layer on the electrode surface and a soft, organic layer on top of that. Rinsing the HOPG electrode after cycling was shown to remove the soft outer layer of the SEI and leave a layer rich in inorganic carbonates and fluorides.10 Those results are consistent with the differences observed in this study between ex situ XPS and in situ NR. The inner, thin Li-rich (low SLD) layer is observed in XPS after washing away the outer, thick organic layer (high SLD) that is observed in NR.
3.4 Ex situ nuclear magnetic resonance
We tested explicitly for the formation of species which were soluble in PF5M2, in which most Li salts are not very soluble, and found only minute compositional changes in the electrolyte after cycling. Li salts and organic monomers that are part of the SEI are likely to be much more soluble in DMC, leaving only high molecular weight polymers and highly insoluble Li salts, e.g. LiF, Li2O, and Li2CO3, to be detected after washing. NMR was carried out on the electrolyte before and after cycling in order to determine to what extent soluble electrochemical byproducts were formed during cycling. Based on previous observations in this system using infrared absorption spectroscopy31 and related electrochemistry accepted in the literature,1 we contend that the most likely explanation of these minute compositional changes are due to the electrochemical formation of dilithium perfluoroglutarate (PF5Li2) from PF5M2. (Due to the limits of the experiment and ester lability, the presence of lithium methyl perfluoroglutarate (PF5MLi) is assumed, though not explicitly discussed.)Multinuclear NMR (Fig. 9) of deuterated and protiated electrolytes shows that only subtle changes occur during cycling. Major signals belong to PF5M2 [1H: 1.0 (singlet); 13C: 15.0 (singlet), 109.4 (triplet of triplets), 111.2 (triplet of quintets), 160.2 (multiplet); 19F: −125.2 (singlet), −119.6 (singlet)] and TFSI− [13C: 120.6 (quartet); 19F: −80.8 (singlet)]. The chemical shift of the CH3 group in the deuterated electrolytes is slightly different from that of the protiated electrolyte (4.00 ppm vs. 4.04 ppm in 1H and 54.34 (septet) vs. 55.04 ppm (singlet) in 13C). The deuterated electrolytes have a relatively intense peak at 3.85 ppm in the 1H spectrum which is attributed to d3-MeOH formed by hydrolysis of d6-PF5M2 by trace H2O impurities. The corresponding peak in the protiated electrolytes is obscured by the 1H–13C satellite. The signal for the CH3 of MeOH (1H: 3.6 ppm) appears in the protiated electrolytes but not in the deuterated electrolytes, consistent with the low proportion (<0.6%) of C1H2H2 in the deuterated electrolyte.
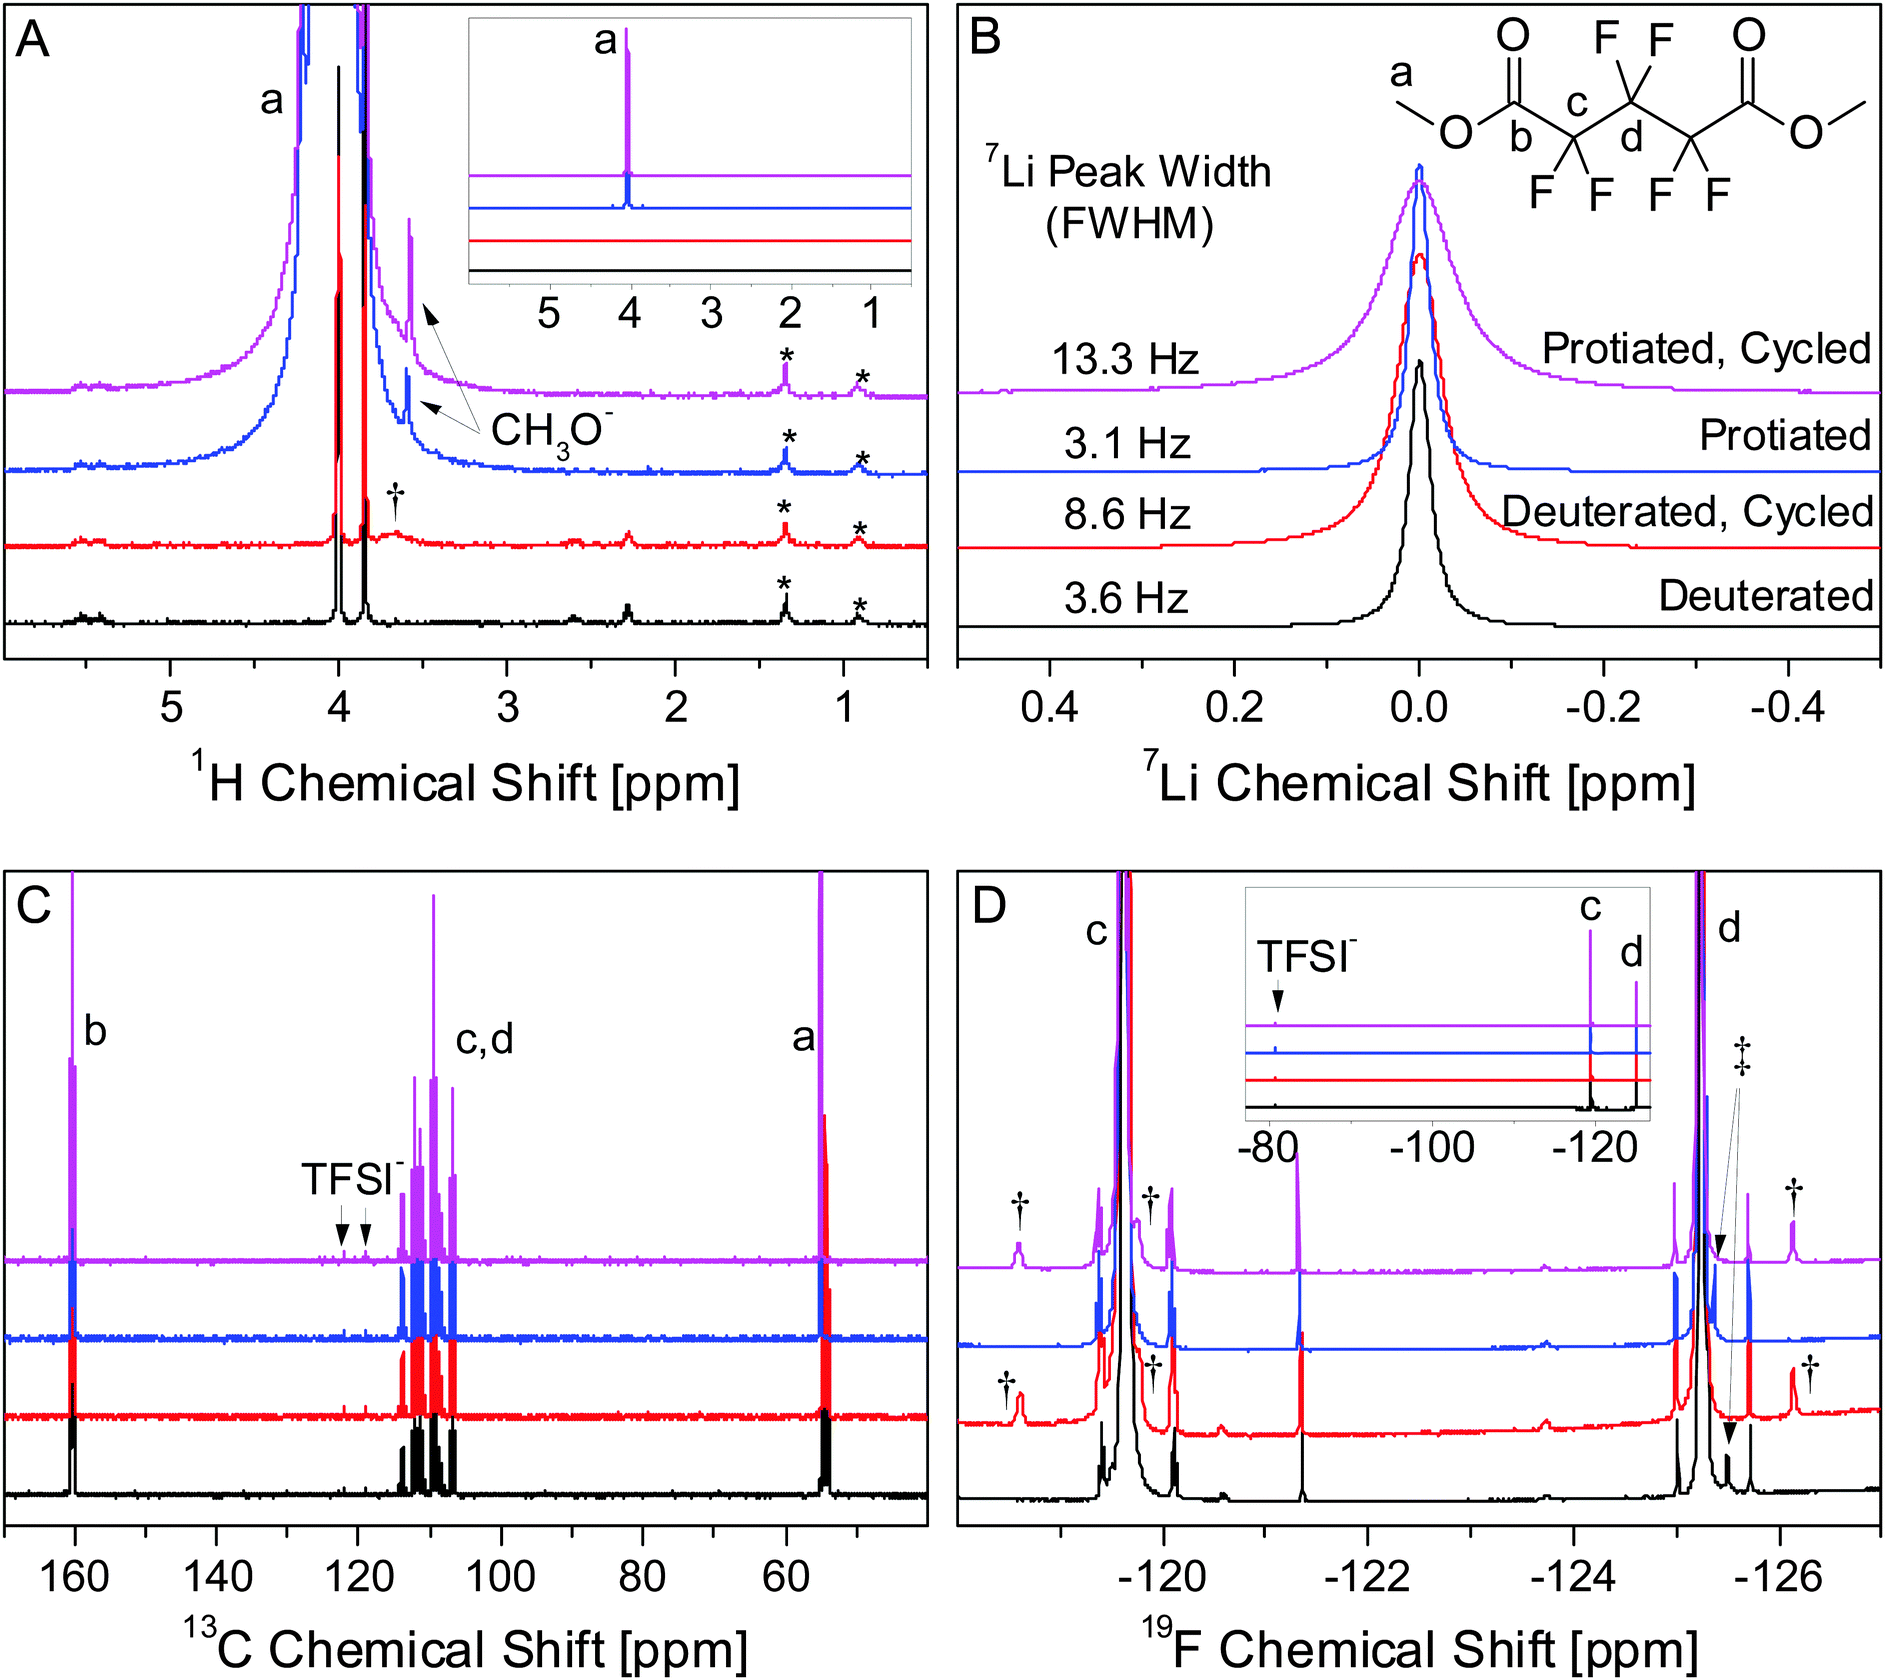 | ||
| Fig. 9 1H (A), 7Li (B), 13C (C), and 19F (D) NMR spectra of deuterated and protiated electrolytes before and after cycling. Peaks corresponding to PF5M2 (a–d) and the TFSI− anion are labelled. The insets in 1H and 19F spectra are 1/1000× scale to show the full intensity of PF5M2 and TFSI− peaks. Signals unique to the cycled (†) and uncycled (‡) electrolytes as well as signals attributed to volatile species in the epoxy sealant (*) are labelled. | ||
Additional signals are of low intensity (<0.1% of primary peaks), illustrating the necessity of using neat (no deuterated solvent) electrolytes during analysis in order to observe impurities and electrochemically formed compounds. All species unique to cycled and uncycled electrolytes appear in both protiated and deuterated electrolytes. The broad peak at 3.7 ppm in the 1H spectrum (Fig. 9A, †) of the cycled, deuterated electrolyte does not show a corresponding intense peak in the protiated electrolyte, suggesting that this peak may be due to an adventitious 1H source, likely ambient H2O, whose chemical shift is highly environment-dependent.42,43 Adventitious sources of H have 1H signals that are independent of the level of deuteration of the electrolyte, unlike any hydrogenous species formed from the electrolyte during cycling.
The most significant difference between the cycled and uncycled electrolytes is the intensity and the width of the 7Li signal (Fig. 9B). The changes in peak width for the protiated (3.1 Hz → 13.3 Hz) and deuterated (3.6 Hz → 8.6 Hz) electrolytes with cycling are consistent with the formation of PF5Li2, which would reduce symmetry around the quadrupolar 7Li nuclear, increasing the relaxation rate and the peak width. The intensity of the 7Li signal increases by 18% for the protiated electrolyte and by 28% for the deuterated electrolyte. Though it is difficult to integrate the 19F signals, due to the overlap of intense nearby peaks, the differences in the intensity changes in the 7Li signal are qualitatively consistent with the differences in the intensity of the 19F peaks (Fig. 9D, †) in the protiated and deuterated electrolytes. If due solely to the electrochemical formation of PF5Li2, a 28% increase in the 7Li signal (0.1 M) would correspond to the formation of 14 mM PF5Li2. The appearance of 19F signals (†) with ∼0.003 times the intensity of the primary PF5M2 (5.5 M) peaks at similar chemical shifts is consistent with the formation of PF5Li2. This observation is further evidence that PF5Li2 is the primary soluble product formed during electrochemical cycling. It is, however, unclear whether the differences in the 7Li spectrum between the protiated and deuterated electrolytes are due to slight differences in the electrochemical discharge conditions, e.g. electrolyte volume and cell resistance, or chemical differences caused by an isotopic effect, e.g. PF5Li2 solubility.
It is difficult to identify the specific species formed during cycling solely from the chemical shifts in one-dimensional NMR data; though it is clear that only a small number of species (at relatively low concentrations) are formed. Since all other impurity signals present in the uncycled electrolyte except for one (Fig. 9D, ‡) are also present in the cycled electrolyte at roughly the same concentrations, these impurities are most likely electrochemically inert and do not affect SEI formation or composition. Based on the above analysis, PF5Li2 is the only soluble species formed during electrochemical cycling. Using eqn (2), the SLD of the electrolyte is expected to change from 4.78 × 10⁻⁶ Å−2 to 4.77 × 10⁻⁶ Å−2 after discharging the cell. NR is not sensitive to such a small change in the electrolyte SLD, so it is assumed to remain constant during cycling. Additionally, this analysis does not eliminate the possibility of species formed that are soluble in DMC and would be removed during washing prior to ex situ XPS.
4. Conclusions
This study provides direct evidence for the contention that rinsing electrodes prior to ex situ characterization modifies the SEI, leading to potentially fallacious conclusions about the function, composition, and optimization of SEIs. NR indicates that the PF5M2 electrolyte forms a diffuse SEI that is 32 ± 8 nm thick. This result is consistent with the generally theorized—albeit broad—range for a typical SEI thickness of one to hundreds of nm1,10 and similar to previous NR measurements of the thickness of the SEI formed in EC/DMC electrolytes.26 Both in situ NR and ex situ XPS indicate that the SEI swells and contracts during cycling. NR indicates that the SEI contracts by up to 22% during lithiation and swells during delithiation, slowly approaching an equilibrium thickness. XPS suggests the opposite, up to 45% contraction during delithiation and swelling during lithiation. XPS also underestimates the SLD of the SEI by up to 25% and underestimates the thickness of the SEI by a factor of 3 to 4. The origin of these differences is the removal of weakly bound surface species on the SEI which is about 20 nm thick.Acknowledgements
Student support and materials for ester synthesis and scattering profiles are provided by the U.S. National Science Foundation under Grant No. DGE-1069091. Student support for the electrochemical, XPS, and ATR-IR studies performed at Oak Ridge National Laboratory provided by the U.S. Department of Energy, Office of Science, Office of Workforce Development for Teachers and Scientists, Office of Science Graduate Student Research (SCGSR) program is acknowledged. The SCGSR program is administered by the Oak Ridge Institute for Science and Education for the DOE under contract number DE-AC05-06OR23100. The equipment, materials and technical guidance at ORNL, was supported by the Materials Sciences and Engineering Division, Office of Basic Energy Sciences, U.S. Department of Energy under contract with UT-Battelle, LLC (GMV – XPS, ATR-IR, electrochemical) and the Fluid Interface Reactions, Structures, and Transport (FIRST) Center, an Energy Frontier Research Center funded by the U.S. Department of Energy, Office of Science, Office of Basic Energy Sciences (RLS – Conductivity, ATR-IR). Neutron reflectometry measurements were carried out on the Liquids Reflectometer at the Spallation Neutron Source which is sponsored by the Scientific User Facilities Division, Office of Basic Energy Sciences, U.S. Department of Energy (J. F. B., M. D., Data collection and analysis). Sample preparation (J. K. B.) was performed at the Center for Integrated Nanotechnologies, an Office of Science User Facility operated for the U.S. Department of Energy (DOE) Office of Science. Los Alamos National Laboratory, an affirmative action equal opportunity employer, is operated by Los Alamos National Security, LLC, for the National Nuclear Security Administration of the U.S. Department of Energy under contract DE-AC52-06NA25396. This manuscript has been authored by UT-Battelle, LLC under Contract No. DEAC05-00OR22725 with the U.S. Department of Energy. By accepting this article, the publisher acknowledges that the United States Government retains a nonexclusive, paid-up, irrevocable, worldwide license to publish or reproduce the published form of this manuscript, or allow others to do so, for United States Government purposes. The Department of Energy will provide public access to these results of federally sponsored research in accordance with the DOE Public Access Plan (http://energy.gov/downloads/doe-public-access-plan). T. M. F. would like to thank Dr C. Sotiriou-Leventis for help in formulating the perfluorocarboxylate ester synthesis.References
- K. Xu, Chem. Rev., 2014, 114, 11503–11618 CrossRef CAS PubMed.
- N. Leifer, M. C. Smart, G. K. S. Prakash, L. Gonzalez, L. Sanchez, K. A. Smith, P. Bhalla, C. P. Grey and S. G. Greenbaum, J. Electrochem. Soc., 2011, 158, A471 CrossRef CAS.
- B. Philippe, R. Dedryvère, J. Allouche, F. Lindgren, M. Gorgoi, H. Rensmo, D. Gonbeau and K. Edström, Chem. Mater., 2012, 24, 1107–1115 CrossRef CAS.
- H. Q. Pham, K. M. Nam, E. H. Hwang, Y. G. Kwon, H. M. Jung and S. W. Song, J. Electrochem. Soc., 2014, 161, A2002–A2011 CrossRef CAS.
- P. Verma, P. Maire and P. Novák, Electrochim. Acta, 2010, 55, 6332–6341 CrossRef CAS.
- K. C. Klavetter, S. M. Wood, Y.-M. Lin, J. L. Snider, N. C. Davy, A. M. Chockla, D. K. Romanovicz, B. A. Korgel, J.-W. Lee, A. Heller and C. B. Mullins, J. Power Sources, 2013, 238, 123–136 CrossRef CAS.
- C. K. Chan, R. Ruffo, S. S. Hong and Y. Cui, J. Power Sources, 2009, 189, 1132–1140 CrossRef CAS.
- X. Chen, X. Li, D. Mei, J. Feng, M. Y. Hu, J. Hu, M. Engelhard, J. Zheng, W. Xu, J. Xiao, J. Liu and J.-G. Zhang, ChemSusChem, 2014, 7, 549–554 CrossRef CAS PubMed.
- B. Philippe, R. Dedryvère, M. Gorgoi, H. Rensmo, D. Gonbeau and K. Edström, Chem. Mater., 2013, 25, 394–404 CrossRef CAS.
- A. v. Cresce, S. M. Russell, D. R. Baker, K. J. Gaskell and K. Xu, Nano Lett., 2014, 14, 1405–1412 CrossRef CAS PubMed.
- K. Edström and M. Herranen, J. Electrochem. Soc., 2000, 147, 3628–3632 CrossRef.
- O. Dolotko, A. Senyshyn, M. J. Mühlbauer, K. Nikolowski and H. Ehrenberg, J. Power Sources, 2014, 255, 197–203 CrossRef CAS.
- M. T. McDowell, S. W. Lee, J. T. Harris, B. A. Korgel, C. Wang, W. D. Nix and Y. Cui, Nano Lett., 2013, 13, 758–764 CrossRef CAS PubMed.
- L. Zhou, M. Leskes, A. J. Ilott, N. M. Trease and C. P. Grey, J. Magn. Reson., 2013, 234, 44–57 CrossRef CAS PubMed.
- P. Novák, D. Goers, L. Hardwick, M. Holzapfel, W. Scheifele, J. Ufheil and A. Würsig, J. Power Sources, 2005, 146, 15–20 CrossRef.
- M. Bianchini, E. Suard, L. Croguennec and C. Masquelier, J. Phys. Chem. C, 2014, 118, 25947–25955 CAS.
- I. A. Bobrikov, A. M. Balagurov, C.-W. Hu, C.-H. Lee, T.-Y. Chen, S. Deleg and D. A. Balagurov, J. Power Sources, 2014, 258, 356–364 CrossRef CAS.
- H. Liu, C. R. Fell, K. An, L. Cai and Y. S. Meng, J. Power Sources, 2013, 240, 772–778 CrossRef CAS.
- M. Roberts, J. J. Biendicho, S. Hull, P. Beran, T. Gustafsson, G. Svensson and K. Edström, J. Power Sources, 2013, 226, 249–255 CrossRef CAS.
- X.-L. Wang, K. An, L. Cai, Z. Feng, S. E. Nagler, C. Daniel, K. J. Rhodes, A. D. Stoica, H. D. Skorpenske, C. Liang, W. Zhang, J. Kim, Y. Qi and S. J. Harris, Sci. Rep., 2012, 2, 747 Search PubMed.
- B. Jerliu, L. Dorrer, E. Huger, G. Borchardt, R. Steitz, U. Geckle, V. Oberst, M. Bruns, O. Schneider and H. Schmidt, Phys. Chem. Chem. Phys., 2013, 15, 7777–7784 RSC.
- J. E. Owejan, J. P. Owejan, S. C. DeCaluwe and J. A. Dura, Chem. Mater., 2012, 24, 2133–2140 CrossRef CAS.
- M. Hirayama, N. Sonoyama, T. Abe, M. Minoura, M. Ito, D. Mori, A. Yamada, R. Kanno, T. Terashima, M. Takano, K. Tamura and J. i. Mizuki, J. Power Sources, 2007, 168, 493–500 CrossRef CAS.
- J. F. Browning, L. Baggetto, K. L. Jungjohann, Y. Wang, W. E. Tenhaeff, J. K. Keum, D. L. Wood and G. M. Veith, ACS Appl. Mater. Interfaces, 2014, 6, 18569–18576 CAS.
- G. M. Veith, L. Baggetto, R. L. Sacci, R. R. Unocic, W. E. Tenhaeff and J. F. Browning, Chem. Commun., 2014, 50, 3081–3084 RSC.
- G. M. Veith, M. Doucet, J. K. Baldwin, R. L. Sacci, T. M. Fears, Y. Wang and J. F. Browning, J. Phys. Chem. C, 2015, 119, 20339–20349 CAS.
- A. Nelson, J. Appl. Cryst., 2006, 39, 273–276 CrossRef CAS.
- T. Heitmann and W. Montfrooij, Practical Neutron Scattering at a Steady State Source, Mizzou Media – University BookStores, 2012 Search PubMed.
- M. Wagemaker, R. van de Krol and A. A. van Well, Physica B: Cond. Mat., 2003, 336, 124–129 CrossRef CAS.
- M. Hirayama, M. Yonemura, K. Suzuki, N. Torikai, H. Smith, E. Watkinsand, J. Majewski and R. Kanno, Denki Kagaku, 2010, 78, 413–415 CAS.
- T. M. Fears, R. L. Sacci, J. G. Winiarz, H. Kaiser, H. Taub and G. M. Veith, J. Power Sources, 2015, 299, 434–442 CrossRef CAS.
- L. Hu, Z. Xue, K. Amine and Z. Zhang, J. Electrochem. Soc., 2014, 161, A1777–A1781 CrossRef.
- Z. Zhang, L. Hu, H. Wu, W. Weng, M. Koh, P. C. Redfern, L. A. Curtiss and K. Amine, Energy & Environmental Science, 2013, 6, 1806 CAS.
- T. Böttcher, B. Duda, N. Kalinovich, O. Kazakova, M. Ponomarenko, K. Vlasov, M. Winter and G. V. Röschenthaler, Prog. Solid State Chem., 2014, 42, 202–217 CrossRef.
- O. Arnold, J. C. Bilheux, J. M. Borreguero, A. Buts, S. I. Campbell, L. Chapon, M. Doucet, N. Draper, R. Ferraz Leal, M. A. Gigg, V. E. Lynch, A. Markvardsen, D. J. Mikkelson, R. L. Mikkelson, R. Miller, K. Palmen, P. Parker, G. Passos, T. G. Perring, P. F. Peterson, S. Ren, M. A. Reuter, A. T. Savici, J. W. Taylor, R. J. Taylor, R. Tolchenov, W. Zhou and J. Zikovsky, Nuclear Instruments and Methods in Physics Research Section A: Accelerators, Spectrometers, Detectors and Associated Equipment, 2014, 764, 156–166 CrossRef CAS.
- V. L. Chevrier and J. R. Dahn, J. Electrochem. Soc., 2009, 156, A454–A458 CrossRef CAS.
- S. Tanuma, C. J. Powell and D. R. Penn, Surf. Interface Anal., 2005, 37, 1–14 CrossRef CAS.
- S. Tanuma, C. J. Powell and D. R. Penn, Surf. Interface Anal., 2011, 43, 689–713 CrossRef CAS.
- P. R. Abel, Y.-M. Lin, H. Celio, A. Heller and C. B. Mullins, ACS Nano, 2012, 6, 2506–2516 CrossRef CAS PubMed.
- P. Lu and S. J. Harris, Electrochem. Commun., 2011, 13, 1035–1037 CrossRef CAS.
- S. Shi, P. Lu, Z. Liu, Y. Qi, L. G. Hector, H. Li and S. J. Harris, J. Am. Chem. Soc., 2012, 134, 15476–15487 CrossRef CAS PubMed.
- H. E. Gottlieb, V. Kotlyar and A. Nudelman, J. Org. Chem., 1997, 62, 7512–7515 CrossRef CAS PubMed.
- G. R. Fulmer, A. J. M. Miller, N. H. Sherden, H. E. Gottlieb, A. Nudelman, B. M. Stoltz, J. E. Bercaw and K. I. Goldberg, Organometallics, 2010, 29, 2176–2179 CrossRef CAS.
Footnotes |
| † Electronic supplementary information (ESI) available. See DOI: 10.1039/c6cp00978f |
| ‡ U.S. Department of Energy, Office of Science Graduate Student Research Program Fellow, Oak Ridge National Laboratory. |
| This journal is © the Owner Societies 2016 |