 Open Access Article
Creative Commons Attribution 3.0 Unported Licence
Phase stability of the nanolaminates V2Ga2C and (Mo1−xVx)2Ga2C from first-principles calculations†
A.
Thore
*a,
M.
Dahlqvist
a,
B.
Alling
ab and
J.
Rosen
a
aDepartment of Physics, Chemistry, and Biology, Thin Film Physics Division, Linköping University, SE-581 83 Linköping, Sweden. E-mail: andth@ifm.liu.se; madah@ifm.liu.se; bjoal@ifm.liu.se; johro@ifm.liu.se; Tel: +46 70 3212109
bMax-Planck-Institut für Eisenforschung GmbH, D-402 37 Düsseldorf, Germany
First published on 20th April 2016
Abstract
We here use first-principles calculations to investigate the phase stability of the hypothetical laminated material V2Ga2C and the related alloy (Mo1−xVx)2Ga2C, the latter for a potential parent material for synthesis of (Mo1−xVx)2C, a new two-dimensional material in the family of so called MXenes. We predict that V2Ga2C is thermodynamically stable with respect to all identified competing phases in the ternary V–Ga–C phase diagram. We further calculate the stability of ordered and disordered configurations of Mo and V in (Mo1−xVx)2Ga2C and predict that ordered (Mo1−xVx)2Ga2C for x ≤ 0.25 is stable, with an order–disorder transition temperature of ∼1000 K. Furthermore, (Mo1−xVx)2Ga2C for x = 0.5 and x ≥ 0.75 is suggested to be stable, but only for disordered Mo–V configurations, and only at elevated temperatures. We have also investigated the electronic and elastic properties of V2Ga2C; the calculated bulk, shear, and Young's modulus are 141, 94, and 230 GPa, respectively.
I. Introduction
In a recent paper by Hu et al.,1 the discovery of a new crystalline phase, Mo2Ga2C, was reported, suggested to be the first member of a family of hitherto unknown materials closely related to the Mn+1AXn (MAX) phase family. The latter consists of a large number of hexagonal, layered materials based on a transition metal (M), an A-group element (A) and C or N (X), which display a combination of metallic and ceramic properties.2 The structure of Mo2Ga2C has been further investigated by Lai et al., who used a combination of theoretical calculations and experimental measurements to determine the structure, showing that the phase is indeed very similar to the MAX phase Mo2GaC, with C atoms residing between the Mo layers in an octahedral position and the Ga atoms being stacked in a simple hexagonal arrangement.3Mo2GaC and Mo2Ga2C have been synthesized in bulk as well as thin film form;1,3–5 however, only the latter material has been converted to Mo2C, a so called MXene.6 Experimental results strongly suggest that Mo2GaC, to date the only known Mo-containing ternary MAX phase, cannot be used for this purpose,6,7 even though MXenes, which comprise a class of two-dimensional materials, are typically obtained from MAX phases through selective etching of the A layer. The properties of Mo2C remains to be explored, although the first report on the topic suggests that it exhibits 2D superconductivity, based on the observation that the critical magnetic field is significantly increased when the field direction with respect to the plane of the film is changed from perpendicular to parallel.8
To form a solid solution of two elements on a sublattice – in particular elements with different numbers of valence electrons – opens up for the possibility of tailoring the physical properties, something which has previously been demonstrated for quaternary MAX phases. For example, incorporation of 20 at% of V on the M sublattice of Ti2AlC leads to improvements in Vicker's hardness, flexural strength, and shear strength.9 Motivated by this we here investigate and predict the phase stability as well as the electronic and elastic properties of a new M2A2X phase (or 221 phase) with a single element on the M sublattice, V2Ga2C. We further investigate the stability of a 221 alloy (Mo1−xVx)2Ga2C for different Mo1−xVx concentrations.
Apart from the possibility of tuning of properties in (Mo1−xVx)2Ga2C for different stoichiometries, synthesis of this phase would provide a promising experimental pathway for realizing 2D (Mo1−xVx)2C, a hypothetical new MXene alloy. While it is possible to obtain V2C by etching away the Al layer in the MAX phase V2AlC, the requirement of Mo2Ga2C for synthesis of Mo2C suggests that the parent phase for (Mo1−xVx)2C is (Mo1−xVx)2Ga2C, and not the corresponding MAX phase alloy. The here presented results predict that the new phases V2Ga2C as well as (Mo1−xVx)2Ga2C are stable.
II. Calculation details
All calculations were carried out within the framework of density functional theory (DFT),10 as implemented in the Vienna ab initio simulation package (VASP),11–14 using the Perdew–Burke–Ernzerhof generalized gradient approximation (PBE-GGA) as the exchange–correlation energy functional.15 The plane wave cutoff energy for the structural relaxations was set to 400 eV, and Monkhorst–Pack grids were used for the Brillouin zone samplings. The free energy convergence criterion for all pure phases was 0.1 meV per atom, whereas for the alloy it was chosen to be 0.5 meV per atom due to the requirement of large supercells (4 × 4 × 1, containing 160 atoms). The dynamical matrix of V2Ga2C was calculated using Γ-centered density functional perturbation theory (DFPT), and the phonon dispersion was extracted with the help of the PHONOPY software package.16,17All phase stability predictions in this work are based on a method for convex hull construction developed by Dahlqvist et al. which combines first-principles calculations with a linear optimization procedure (the simplex algorithm).18 This method has previously been successfully used to predict the existence of several MAX phases,19–21 and it also reproduces the stability of several already synthesized MAX phases, as well as the stability of Mo2Ga2C.3,22
For disordered (Mo1−xVx)2Ga2C, the supercells were created using the special quasirandom structure (SQS) methodology developed by Zunger et al.23 The same approach was used for competing phases that were alloyed on one or more sublattices, and/or contained vacancies. For ordered (Mo1−xVx)2Ga2C, the enthalpies of a number of different, manually constructed M sublattice configurations were calculated and compared, all of which are listed in Table S2 in ESI.†
The enthalpy of formation of V2Ga2C and ordered (Mo1−xVx)2Ga2C, which was calculated through the linear optimization procedure described in ref. 22, can be expressed as
| ΔHcp = H221 − Hcp, | (1) |
 | (2) |
For the disordered 221 alloy and phases with vacancies, the enthalpy is replaced at finite temperature T by the Gibbs free energy,
| G = H − TSc, | (3) |
 | (4) |
Lastly, the elastic properties of V2Ga2C were obtained using the method described by Fast et al.,24 where five elastic constants C11, C12, C13, C33, and C44 are obtained by first distorting the lattice in a stepwise fashion, then calculating the energy of each distortion step, given by
 | (5) |
III. Results and discussion
A. Phase stability
The topmost and bottom row of Table 1 contain the formation enthalpies, the lattice parameters, and the respective sets of most competing phases at 0 K for the hypothetical phase V2Ga2C and the recently synthesized nanolaminate Mo2Ga2C.1 The crystal structure of these phases is shown in Fig. 1. Out of a large number of considered competing phases (see Table S1 in ESI†), the set of most competing phases with respect to V2Ga2C is found to consist of two experimentally verified phases, the MAX phase V2GaC and the rhombohedral binary phase V8Ga41, and the hypothetical phase V3Ga2C2. The latter belongs to the same space group as V2Ga2C (P63/mmc), but contains two V6C octahedra between each Ga bilayer instead of one, similar to a MAX phase with a 312 stoichiometry.| Phase | Set of most competing phases (0 K) | Lattice parameter (0 K) | ΔHcp (meV per atom) | ||||
|---|---|---|---|---|---|---|---|
| Ordered | SQS | Ordered | SQS | ||||
| a (Å) | c (Å) | a (Å) | c (Å) | ||||
| a Ref. 3. | |||||||
| Mo2Ga2C | Mo3Ga, MoGa4, MoC | 3.064a | 18.153a | −9a | |||
| (Mo0.75V0.25)2Ga2C | (Mo0.5V0.5)2GaC, Mo2Ga2C, MoGa4, C | 3.028 | 18.256 | 3.034 | 18.134 | −3.7 | 13.3 |
| (Mo0.5V0.5)2Ga2C | (Mo0.5V0.5)2GaC, (Mo0.75V0.25)2Ga2C, V6C5, MoGa4 | 3.003 | 18.062 | 3.001 | 18.077 | 18.3 | 22.4 |
| (Mo0.25V0.75)2Ga2C | (Mo0.25V0.75)2GaC, V2GaC, V6C5, MoGa4 | 2.957 | 18.092 | 2.975 | 17.978 | 13.3 | 23.8 |
| V2Ga2C | V3Ga2C2, V2GaC, V8Ga41 | 2.946 | 17.861 | −0.6 | |||
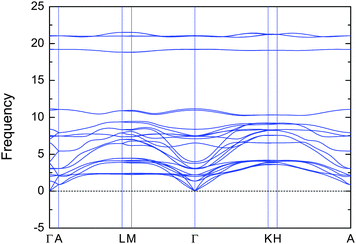
Both V2Ga2C and Mo2Ga2C fulfill the criterion that ΔHcp < 0, although the formation enthalpy of −0.6 meV per atom for V2Ga2C is close to zero and could therefore hypothetically become positive if temperature dependent effects such as lattice vibrations are also included in the calculations. However, in a recent study we showed that, for the structurally closely related MAX phase Ti2AlC, the temperature dependent effects cancel each other out.25 Further, as shown in Fig. 2, the phonon dispersion indicates that V2Ga2C is dynamically stable as there are no imaginary frequencies and thus no imaginary phonon modes present. The phase also fulfills the three criteria for mechanical stability,26 which for a hexagonal phase are the inequalities C44 > 0, C11 > |C21|, and (C11 + C12)C33 > 2C132. The values of the elastic constants can be found in Section IIIC, Table 3.
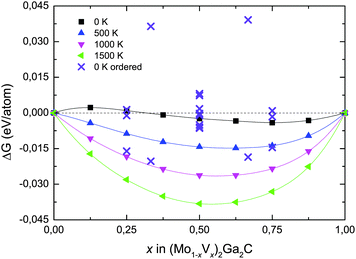
We have also investigated the phase stability of the quaternary alloy (Mo1−xVx)2Ga2C. Fig. 3 shows the isostructural Gibbs free energy of formation (as defined in eqn (1), with G221 substituted for H221) for chemically disordered (Mo1−xVx)2Ga2C with respect to the two the end members Mo2Ga2C and V2Ga2C, for temperatures ranging from 0 to 1500 K. Also included in the figure are the formation enthalpies for chemically ordered (Mo1−xVx)2Ga2C, for a number of different V concentrations x on the M sublattice. A common feature of all identified lowest-energy ordered configurations of (Mo1−xVx)2Ga2C is that the Mo and V atoms segregate into single element M layers. As shown in Fig. 4, the preferred M layer sequence for x = 0.25 and x = 0.5 is 6Mo2V and MoVMoV, respectively. The sequences for the other considered concentrations are 2Mo4V2Mo4V (x = 0.33), 4Mo2V4Mo2V (x = 0.67), and 2Mo6V (x = 0.75). Ordered (Mo1−xVx)2Ga2C outcompetes both a linear combination of Mo2Ga2C and V2Ga2C and the disordered alloy for temperatures up to 1000 K. Above these temperatures, disordered (Mo1−xVx)2Ga2C is thermodynamically favored due to a significant configurational entropy contribution to the free energy.
 | ||
| Fig. 4 The identified lowest-energy configurations of ordered (Mo1−xVx)2Ga2C for x = 0.5 (left) and x = 0.25 (right). | ||
The picture changes significantly when all known competing phases (∼70, see Table S1 in ESI†) in the quaternary Mo–V–Ga–C phase diagram, together with hypothetical phases such as the binary phase MoGa4 (based on the existing, related cubic phase CrGa4), are included in the calculations. As seen in Table 1 for V concentrations x = 0.25, 0.5, and 0.75, the respective sets of most competing phases at 0 K are comprised of ternaries, binaries, and, for x = 0.25, pure carbon (graphite), which increases the formation enthalpies for both the ordered and disordered alloy. At 0 K only ordered (Mo0.75V0.25)2Ga2C is now stable, with ΔHcp = −3.7 meV per atom.
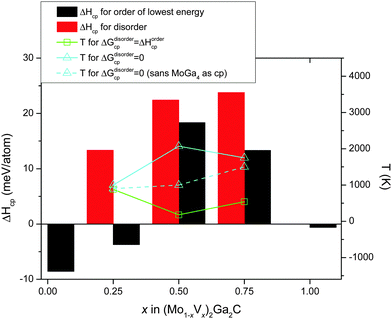
Fig. 5 combines all 0 K data in Table 1 with a superimposed line indicating Tdisorder (green open squares, right hand axis), i.e., the temperature at which the condition ΔGdisordercp = ΔHordercp is fulfilled and a disordered Mo/V solid solution on the M sublattice becomes energetically favorable (this notation was first introduced in ref. 27). Also indicated in the figure is TΔGcp=0 (solid line, teal open triangles), where ΔGdisordercp = 0, the temperature at which the disordered alloy first becomes stable with respect to its set of most competing phases. For x = 0.5 and 0.75, only disordered (Mo1−xVx)2Ga2C is indicated as potentially stable at elevated temperatures, with TΔGcp=0 ≈ 2100 and 1750 K, respectively. For x = 0.25, on the other hand, both ordered and disordered (Mo1−xVx)2Ga2C is stable, with Tdisorder ≈ 880 K, and TΔGcp=0 ≈ 1000 K. Since common bulk synthesis temperatures are 1200–1600 °C (1473–1873 K), these results thus suggest that synthesis of the disordered quaternary alloy (Mo1−xVx)2Ga2C should at least be possible for x ≤ 0.25 and x ≥ 0.75. For the former concentration range, it might be possible to synthesize an ordered configuration at temperatures below 880 K.
It should be noted that for all three V concentrations, MoGa4 (a phase not to be confused with Mo6Ga31, which has almost the same stoichiometry, but a different structure) is one of the most competing phases not only at 0 K, but also at and above TΔGcp=0. This is a binary phase which has, to the best of our knowledge, not yet been experimentally verified. This might be because of a lack of trying, or because it does not form readily. If the latter is the case, the experimental window for synthesizing disordered (Mo1−xVx)2Ga2C (which would then be a metastable phase) expands significantly, with possible synthesis temperatures for x = 0.25, 0.5, and 0.75 starting at around 900, 1000, and 1500 K, respectively. These temperatures are indicated by the teal dashed line in Fig. 5.
Table 1 shows that the a and c lattice parameters decrease more or less linearly with a decreasing amount of Mo. The a parameter obeys Vegard's law quite closely, while this is not apparent for the c parameter. Finally, the differences between corresponding parameters for the ordered and the disordered alloy are quite small.
B. Electronic properties of V2Ga2C
Fig. 6 shows the electronic band structure and the total and atomic densities of states (tDOS and aDOS, respectively) for V2Ga2C and V2GaC. The band structure of V2Ga2C exhibits considerable anisotropy around the Fermi level, with several band crossings in the A–L, M–Γ, Γ–K, and H–A reciprocal space directions, but none in the Γ–A, L–M, and K–H directions. Band structure anisotropy, which together with electron–phonon coupling anisotropy28 is often an indicator of anisotropic conductive properties, is a common feature of MAX phases, including V2GaC and the 221 phase Mo2Ga2C.3,29,30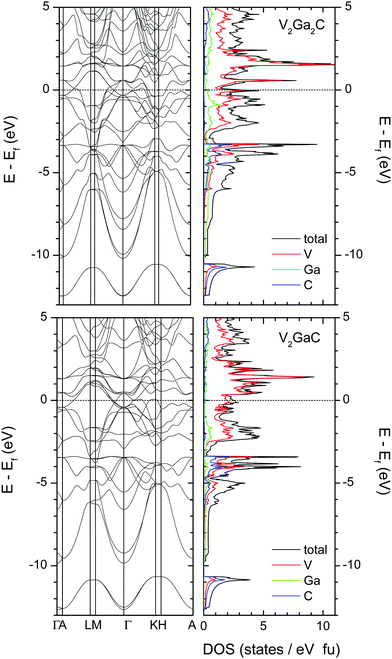 | ||
| Fig. 6 Electronic band structure and total and atomic densities of states for V2Ga2C (top left and right panels) and V2GaC (bottom panels). The dashed lines indicate the location of the Fermi level. | ||
Qualitatively, the tDOS and aDOS for V2Ga2C are very similar compared to V2GaC. The states around EF in both phases are mostly dominated by V electrons (more specifically V 3d electrons). Evidence of V–C and weak V–Ga bonding is seen at around −3.5 eV, where there is overlap between the V, Ga, and C peaks; slightly stronger V–Ga bonds should be expected in the intervals from −2 eV to −1 eV, where more Ga states are present in both V2Ga2C and V2GaC.
A Bader charge analysis has been carried out in order to investigate the charge transfer in V2Ga2C, which is a consequence of the differences in electronegativity between the constituting elements (1.6 for V and Ga; 2.5 for C).31 As seen in Table 2, a charge of 0.5 e is transferred from the [V2C] blocks to the Ga layers, whereas within the [V2C] blocks, 1.73 e is transferred from V2 to C.
| Phase | Partial charge | |||
|---|---|---|---|---|
| V | Mo | Ga | C | |
| V2Ga2C | +1.11 | −0.25 | −1.73 | |
| V2GaC | +1.13 | −0.55 | −1.72 | |
| Mo2Ga2C | +0.74 | −0.04 | −1.38 | |
| Mo2GaC | +0.78 | −0.17 | −1.39 | |
Also listed in Table 2 are the partial charges of the M, A, and X atoms in V2GaC, Mo2Ga2C, and Mo2GaC. The [M2C] → Ga charge transfer is smaller in the 221 phases than in the corresponding MAX phases, as the former contain two Ga atoms per [M2C] block instead of one. However, this fact alone cannot account for the observed difference, since the transferred charge per Ga atom in the 221 phases is less than half the amount of charge transferred in the MAX phases. For V2Ga2C, the discrepancy is 0.05 e (0.5 e vs. 0.55 e), while it is 0.09 e for Mo2Ga2C (0.08 e vs. 0.17 e). These discrepancies are likely caused by differences in the electronic structure, and they may suggest that the ionic components of the bonds between the [M2C] blocks and the Ga layers are slightly weaker in the 221 phases than in the corresponding MAX phases.
C. Elastic properties of V2Ga2C
The Voigt bulk (BV) and Voigt shear modulus (GV) can be calculated from the five elastic constants C11, C12, C13, C33, and C44 discussed in Section II. The moduli are related to these constants as | (6) |
| GV = 115(2C11 + C33 − C12 − 2C13) + 15(2C44 + 12(C11 − C12)). | (7) |
 | (8) |
 | (9) |
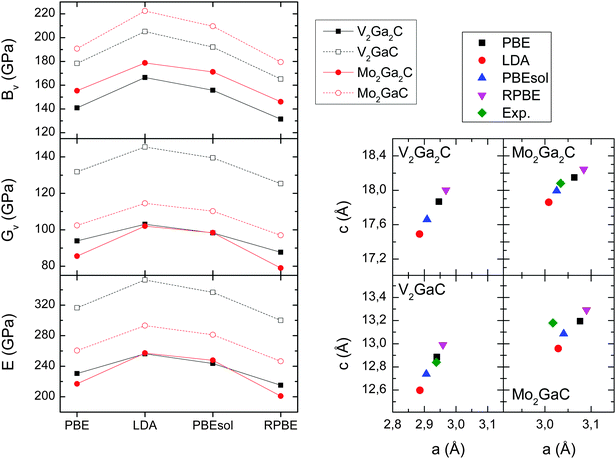 | ||
| Fig. 7 Left panels: Bulk (BV), shear (GV), and Young's moduli (E) for V2Ga2C, V2GaC, Mo2Ga2C, and Mo2GaC for four different exchange–correlation functionals. Right panels: Lattice parameters for the same four exchange–correlation functionals, and experimentally determined lattice parameters taken from ref. 1 (Mo2Ga2C) and ref. 34 (V2GaC, Mo2GaC). | ||
In Table 3 we list the five elastic constants, the three moduli, and the Poisson's ratios (eqn (9)) for V2Ga2C, V2GaC, Mo2Ga2C, and Mo2GaC, all obtained from calculations using the PBE exchange–correlation functional. As is seen in the table, V2Ga2C has similar moduli compared to Mo2Ga2C, but they are significantly lower (20–30%) than for V2GaC. A decrease in the moduli is also observed for Mo2Ga2C compared to Mo2GaC, as first reported in ref. 3.
| Phase | C 11 | C 12 | C 13 | C 33 | C 44 | B V | G V | E | ν |
|---|---|---|---|---|---|---|---|---|---|
| V2Ga2C | 262 | 64 | 69 | 345 | 76 | 141 | 94 | 230 | 0.23 |
| V2GaC | 331 | 70 | 116 | 298 | 139 | 178 | 132 | 316 | 0.21 |
| Mo2Ga2C | 244 | 62 | 108 | 341 | 78 | 154 | 86 | 218 | 0.26 |
| Mo2GaC | 294 | 96 | 161 | 289 | 126 | 190 | 101 | 257 | 0.28 |
At 0.23, Poisson's ratio for V2Ga2C is 10% greater than for V2GaC, and about 12% smaller than for Mo2Ga2C.
The differences in the elastic properties of the 221 phases compared to the MAX phases can be attributed to the additional Ga layers in the former. Part of the explanation might be a weaker ionic component of the bonds between the [M2C] blocks and Ga layers compared to the MAX phases, which was discussed in Section IIIB. Likely to be more significant, however, are the Ga–Ga bonds along the c axis in the 221 phases, which should be mainly metallic in character and presumably rather weak compared to the vertical V–Ga, V–C, and V–V bonds.
IV. Conclusions
We have calculated the phase stability of V2Ga2C and of the related alloy (Mo1−xVx)2Ga2C for three different V concentrations: x = 0.25, 0.5, and 0.75. The formation enthalpy of V2Ga2C with respect to its set of most competing phases is −0.6 meV per atom, which suggests that it is thermodynamically stable. Furthermore, V2Ga2C was found to be dynamically as well as mechanically stable.For (Mo1−xVx)2Ga2C and x ≤ 0.25, phase stability is indicated both for an ordered and a disordered configuration on the M sublattice, where the latter is stabilized at around 1000 K. Phase stability is further indicated for disordered (Mo1−xVx)2Ga2C for x = 0.5 and x ≥ 0.75, at temperatures of about 2100 and 1750 K, respectively.
We have also investigated the electronic and elastic properties of V2Ga2C. The layered nature of the crystal structure is reflected in the electronic band structure in the form of a distinct anisotropy, which is a possible indicator of anisotropic conductivity. The calculated Voigt bulk modulus is 141 GPa, the Voigt shear modulus 94 GPa, and Young's modulus 230 GPa, which are lower values than for the corresponding MAX phase V2GaC. A Bader analysis shows significant charge transfer within the [V2C] blocks and a smaller transfer between the [V2C] blocks and the Ga layers in both V2Ga2C and the MAX phase counterpart V2GaC. The differences in the elastic moduli between V2Ga2C and V2GaC might be partly explained by a smaller [V2C] → Ga transfer in V2Ga2C, but we speculate that the most important factor is weak interlayer bonding between the Ga layers in this phase.
Acknowledgements
Funding of this research was provided by the European Research Council under the European Community Seventh Framework Program (FP7/2007–2013)/ERC Grant agreement no. [258509]. J. Rosen acknowledges funding from the Swedish Research Council (VR), from the Knut and Alice Wallenberg (KAW) Fellowship program, and from the SSF synergy grant FUNCASE. B. A. acknowledges financial support by the Swedish Research Council (VR) through grant no. 621-2011-4417 and no. 330-2014-6336 and Marie Sklodowska Curie Actions, Cofund, Project INCA 600398. The calculations were carried out using supercomputer resources provided by the Swedish National Infrastructure for Computing (SNIC) at the National Supercomputer Centre (NSC), and the High Performance Computer Center North (HPC2N).References
- C. Hu, C. C. Lai, Q. Tao, J. Lu, J. Halim, L. Sun, J. Zhang, J. Yang, B. Anasori, J. Wang, Y. Sakka, L. Hultman, P. Eklund, J. Rosen and M. W. Barsoum, Chem. Commun., 2015, 51, 6560–6563 RSC.
- P. Eklund, M. Beckers, U. Jansson, H. Högberg and L. Hultman, Thin Solid Films, 2010, 518, 1851–1878 CrossRef CAS.
- C. C. Lai, R. Meshkian, M. Dahlqvist, J. Lu, L. Å. Näslund, O. Rivin, E. N. Caspi, O. Ozeri, L. Hultman, P. Eklund, M. W. Barsoum and J. Rosen, Acta Mater., 2015, 99, 157–164 CrossRef CAS.
- R. Meshkian, A. S. Ingason, M. Dahlqvist, A. Petruhins, U. B. Arnalds, F. Magnus, J. Lu and J. Rosen, Phys. Status Solidi RRL, 2015, 9, 197–201 CrossRef CAS.
- L. E. Toth, J. Less-Common Met., 1967, 13, 129–131 CrossRef CAS.
- R. Meshkian, L.-Å. Näslund, J. Halim, J. Lu, M. W. Barsoum and J. Rosen, Scr. Mater., 2015, 108, 147–150 CrossRef CAS.
- M. Naguib, J. Halim, J. Lu, K. M. Cook, L. Hultman, Y. Gogotsi and M. W. Barsoum, J. Am. Chem. Soc., 2013, 135, 15966–15969 CrossRef CAS PubMed.
- C. Xu, L. Wang, Z. Liu, L. Chen, J. Guo, N. Kang, X.-L. Ma, H.-M. Cheng and W. Ren, Nat. Mater., 2015, 14, 1135–1141 CrossRef CAS PubMed.
- F. L. Meng, Y. C. Zhou and J. Y. Wang, Scr. Mater., 2005, 53, 1369–1372 CrossRef CAS.
- P. Hohenberg and W. Kohn, Phys. Rev., 1964, 136, B864–B871 CrossRef.
- G. Kresse and J. Hafner, Phys. Rev. B: Condens. Matter Mater. Phys., 1993, 47, 558–561 CrossRef CAS.
- G. Kresse and J. Hafner, Phys. Rev. B: Condens. Matter Mater. Phys., 1994, 49, 14251–14269 CrossRef CAS.
- G. Kresse and J. Furthmüller, Comput. Mater. Sci., 1996, 6, 15–50 CrossRef CAS.
- G. Kresse and J. Furthmüller, Phys. Rev. B: Condens. Matter Mater. Phys., 1996, 54, 11169–11186 CrossRef CAS.
- J. P. Perdew, K. Burke and M. Ernzerhof, Phys. Rev. Lett., 1996, 77, 3865–3868 CrossRef CAS PubMed.
- X. Gonze and C. Lee, Phys. Rev. B: Condens. Matter Mater. Phys., 1997, 55, 10355–10368 CrossRef CAS.
- A. Togo, F. Oba and I. Tanaka, Phys. Rev. B: Condens. Matter Mater. Phys., 2008, 78, 134106 CrossRef.
- M. Dahlqvist, B. Alling, I. A. Abrikosov and J. Rosén, Phys. Rev. B: Condens. Matter Mater. Phys., 2010, 81, 024111 CrossRef.
- P. Eklund, M. Dahlqvist, O. Tengstrand, L. Hultman, J. Lu, N. Nedfors, U. Jansson and J. Rosén, Phys. Rev. Lett., 2012, 109, 035502 CrossRef PubMed.
- A. S. Ingason, A. Mockute, M. Dahlqvist, F. Magnus, S. Olafsson, U. B. Arnalds, B. Alling, I. A. Abrikosov, B. Hjörvarsson, P. O. Å. Persson and J. Rosen, Phys. Rev. Lett., 2013, 110, 195502 CrossRef CAS PubMed.
- A. Mockute, M. Dahlqvist, J. Emmerlich, L. Hultman, J. M. Schneider, P. O. Å. Persson and J. Rosen, Phys. Rev. B: Condens. Matter Mater. Phys., 2013, 87, 094113 CrossRef.
- M. Dahlqvist, B. Alling and J. Rosén, Phys. Rev. B: Condens. Matter Mater. Phys., 2010, 81, 220102 CrossRef.
- A. Zunger, S. H. Wei, L. G. Ferreira and J. E. Bernard, Phys. Rev. Lett., 1990, 65, 353–356 CrossRef CAS PubMed.
- L. Fast, J. M. Wills, B. Johansson and O. Eriksson, Phys. Rev. B: Condens. Matter Mater. Phys., 1995, 51, 17431–17438 CrossRef CAS.
- A. Thore, M. Dahlqvist, B. Alling and J. Rosén, Comput. Mater. Sci., 2014, 91, 251–257 CrossRef CAS.
- C.-Z. Fan, S.-Y. Zeng, L.-X. Li, Z.-J. Zhan, R.-P. Liu, W.-K. Wang, P. Zhang and Y.-G. Yao, Phys. Rev. B: Condens. Matter Mater. Phys., 2006, 74, 125118 CrossRef.
- M. Dahlqvist and J. Rosen, Phys. Chem. Chem. Phys., 2015, 17, 31810–31821 RSC.
- V. Mauchamp, W. Yu, L. Gence, L. Piraux, T. Cabioc'h, V. Gauthier, P. Eklund and S. Dubois, Phys. Rev. B: Condens. Matter Mater. Phys., 2013, 87, 235105 CrossRef.
- A. Thore, M. Dahlqvist, B. Alling and J. Rosén, J. Appl. Phys., 2014, 116, 103511 CrossRef.
- J. Rosen, M. Dahlqvist, S. I. Simak, D. R. McKenzie and M. M. M. Bilek, Appl. Phys. Lett., 2010, 97, 073103 CrossRef.
- G. Henkelman, A. Arnaldsson and H. Jónsson, Comput. Mater. Sci., 2006, 36, 354–360 CrossRef.
- J. P. Perdew, A. Ruzsinszky, G. I. Csonka, O. A. Vydrov, G. E. Scuseria, L. A. Constantin, X. Zhou and K. Burke, Phys. Rev. Lett., 2008, 100, 136406 CrossRef PubMed.
- B. Hammer, L. B. Hansen and J. K. Nørskov, Phys. Rev. B: Condens. Matter Mater. Phys., 1999, 59, 7413–7421 CrossRef.
- W. Jeitschko, H. Nowotny and F. Benesovsky, Monatsh. Chem., 1963, 94, 672–676 CrossRef CAS.
Footnote |
| † Electronic supplementary information (ESI) available. See DOI: 10.1039/c6cp00802j |
| This journal is © the Owner Societies 2016 |


