
 Open Access Article
 This Open Access Article is licensed under a
 Creative Commons Attribution 3.0 Unported Licence
Connectivity matters – ultrafast isomerization dynamics of bisazobenzene photoswitches†
Chavdar
Slavov
a,
Chong
Yang
b,
Luca
Schweighauser
c,
Chokri
Boumrifak
a,
Andreas
Dreuw
b,
Hermann A.
Wegner
*c and
Josef
Wachtveitl
*a
aInstitute of Physical and Theoretical Chemistry, Goethe University, Max-von-Laue-Str. 7, 60438 Frankfurt am Main, Germany. E-mail: wveitl@theochem.uni-frankfurt.de
bTheoretical and Computational Chemistry, Interdisciplinary Center for Scientific Computing (IWR), University of Heidelberg, Im Neuenheimer Feld 368, 69120 Heidelberg, Germany
cInstitute of Organic Chemistry, Justus-Liebig University Giessen, Heinrich-Buff-Ring 17, 35392 Giessen, Germany. E-mail: Hermann.A.Wegner@org.Chemie.uni-giessen.de
First published on 9th March 2016
Abstract
We have investigated the ultrafast dynamics of o-, m- and p-bisazobenzenes, which represent elementary building blocks for photoswitchable multiazobenzene nanostructures. The connectivity pattern within bisazobenzenes and the ensuing complex interactions between the individual azobenzene units determines the ultrafast dynamics of these compounds and their photochemical properties. While retaining a relatively high E → Z isomerization quantum yield, o-bisazobenzene exhibits a very high thermal relaxation rate (half-life of 1.6 ms). Our theoretical calculations reveal that the geometry allows intramolecular excitonic interaction between the azobenzene units, which is reflected in the femtosecond transient absorption data via the simultaneous bleaching of the two excitonic bands. In contrast, the properties of m-bisazobenzene are very similar to the monomeric azobenzene, with the two units acting nearly independently from each other. The highest degree of π conjugation extending over the two azobenzene units was observed for p-bisazobenzene, which results in strong planarity of the molecule, reduced excited state lifetime and relatively low isomerization quantum yield. Multiphotochromic systems bridge the gap between molecular photoswitches and macroscopic function and thus, understanding the properties of bisazobenzenes opens the way to the design and development of new structures with extensive and versatile applications.
Introduction
Molecular photoswitches can be transformed with light between at least two states with different physicochemical properties (e.g. molecular conformation, absorption spectrum, dipole moment, etc.).1,2 The use of light offers a highly selective, spatiotemporally precise and non-invasive way for control of such systems. Thus, photoswitches are widely applied in fields like bio(chemical) science and technology,3,4 nanotechnology,5–7 nanomedicine,8–10 renewable energy,11,12 to name a few.Azobenzenes (AB) are a major class of photochromic compounds widely employed as photoswitches. Their photochromism is based on the E ↔ Z isomerization of the N![[double bond, length as m-dash]](https://www.rsc.org/images/entities/char_e001.gif) N bond. The isomerization is accompanied by a substantial length change (∼3.4 Å) – a property that has been extensively exploited.13–20 The E-isomer is thermodynamically more stable, whereas the Z-isomer, in addition to the photoinduced isomerization, can undergo also thermal isomerization. The UV-VIS absorption spectrum of E-AB shows a weak n → π* transition band at ∼450 nm (S1 state) and a strong π → π* transition band at ∼315 nm (S2 state).21 The corresponding bands of Z-azobenzene are located at ∼440 nm and 260 nm. Excitation in the S2 state leads to isomerization quantum yields (QYE→Z ∼ 0.13, QYZ→E ∼ 0.23) that are nearly half of the yields measured after S1 excitation (QYE→Z ∼ 0.25, QYZ→E ∼ 0.5), which is a violation of Kasha's rule21,22 and implies the presence of different relaxation pathways.
N bond. The isomerization is accompanied by a substantial length change (∼3.4 Å) – a property that has been extensively exploited.13–20 The E-isomer is thermodynamically more stable, whereas the Z-isomer, in addition to the photoinduced isomerization, can undergo also thermal isomerization. The UV-VIS absorption spectrum of E-AB shows a weak n → π* transition band at ∼450 nm (S1 state) and a strong π → π* transition band at ∼315 nm (S2 state).21 The corresponding bands of Z-azobenzene are located at ∼440 nm and 260 nm. Excitation in the S2 state leads to isomerization quantum yields (QYE→Z ∼ 0.13, QYZ→E ∼ 0.23) that are nearly half of the yields measured after S1 excitation (QYE→Z ∼ 0.25, QYZ→E ∼ 0.5), which is a violation of Kasha's rule21,22 and implies the presence of different relaxation pathways.
 | ||
| Fig. 1 Structures of the investigated compounds. 1 – azobenzene; o-2 – o-bisazobenzene; m-2 – m-bisazobenzene; p-2 – p-bisazobenzene. | ||
The photoinduced E → Z isomerization of AB occurs on the subpicosecond to picosecond timescale after n → π* as well as π → π* excitation. The decay of the S1 state is described by two lifetimes – ∼300–400 fs and 1–3 ps – assigned, correspondingly, to a direct and a diffusive motion from the Franck–Condon region to the conical intersection with the ground state.23–26 An additional ultrashort (∼100 fs) component is observed after π → π* excitation and ascribed to the S2 → S1 transition.26,27 The Z → E photoisomerization is ultrafast with a main lifetime of ∼150 fs and a minor contribution of a ∼1–2 ps lifetime.23,25,26 In both isomerization directions, the internal conversion to the ground state is followed by vibrational cooling dynamics of the hot molecules (10–20 ps lifetime).23,26,28,29 It should be noted that although we follow in the current work the above-described, established interpretation of the time-resolved data for the E → Z isomerization kinetics,23–26 a recent study puts forward a new interpretation where the 10–20 ps component was attributed to the isomerization process, while the shorter lifetimes were linked to excited state dynamics.30
Two isomerization mechanisms are typically discussed for AB: (i) in-plane inversion (one NN–C angle increases to 180°, the C–NN–C dihedral angle remains at 0°) and (ii) rotation (torsion of the NN bond resulting in a change of the C–NN–C dihedral angle to 120°).31 Theoretical calculations give preference to the rotation mechanism for the E ↔ Z isomerization after both n → π* and π → π* excitation.32–37 The lower QYs after π → π* excitation is explained by the presence of an ultrafast internal conversion channel from the S2 state32,33 (potentially involving a crossing with a higher singlet state38–40). The most recent theoretical studies support a modified two-step rotation mechanism, particularly important for isomerization of AB in the condensed phase, where the torsion of the NN bond is followed by rotation of both phenyl rings.36,41–47 Rotation38,48 and inversion49,50 have both been proposed for the mechanism of thermally activated Z → E isomerization.
Although single AB units are well characterized, little is known about the behaviour of connected ABs. The interactions between the individual AB units in multiphotochromic systems offer new properties and thus, such oligoazobenzene derivatives are of great interest for the development of advanced photocontrollable materials. ABs have been introduced into photoresponsive oligomers,51–54 polymers55,56 and other materials.20,57,58 Bis(azo) compounds, in which two ABs share one phenyl ring (Fig. 1), represent one of the elementary building blocks for photoswitchable multiazobenzene nanostructures. Previous studies on m- and p-bis(AB)s showed that the two compounds have different spectral properties and E → Z switching QY.59 Theoretical calculations explain the observed difference by the degree of electronic coupling between the two azo moieties.59,60 In contrast, while m- and p-bis(AB)s were both photoisomerizable, o-bis(AB) surprisingly showed no accumulation of the Z-form.61,62 Clearly, the connectivity pattern of bis(AB)s plays a crucial role in the photochromic properties of these oligoazobenzenes and thus deeper understanding of the photophysics and photochemistry of the building blocks is necessary to achieve intelligent design of complex photoswitchable nanostructures. However, at present, no characterization of the ultrafast reactions of o-, m- and p-bis(AB)s exists. Hence, we have performed femtosecond transient absorption experiments in a pursuit to gain further understanding of the bis(AB)s photochemistry. The study is complemented by theoretical calculations taking into account the solvent environment.
Results and discussion
Synthesis
All three bis(AB)s (Fig. 1) were prepared relying on the Bayer-Mills coupling of the corresponding aniline with nitrosobenzene. In case of o-2, a one-pot procedure starting from 1,2-diaminobenzene developed in the Wegner group was applied.61 The one-pot method was not applicable to access m-2 and p-2, therefore, a three-step procedure was employed. The corresponding nitroanilines were subjected to the Bayer-Mills coupling. After selective reduction of the nitro-group a second Bayer-Mills coupling yielded the desired product (Scheme 1). | ||
| Scheme 1 Synthesis of m-2 and p-2. See ESI† for further details. | ||
Spectroscopic characterization
All three bis(AB) compounds deviate in their stationary absorption spectra from the parent AB (Fig. 2 and Table 1). The π → π* band of the E,E-isomer of m-2 shows a minor red-shift and -broadening (similarly to ref. 59). Under identical irradiation conditions, the spectrum of the UV light induced photostationary state (PSSUV) of m-2 has a more pronounced contribution of the E-isomer than the PSSUV spectrum of AB. Nevertheless, despite the apparently lower E → Z isomerization level, the E-isomer depletion in m-2 is still very high indicating that double E → Z isomerization in this bis(AB) is possible if sufficient irradiation power is provided. The spectra of o-2 and p-2 show significant differences compared to AB (Fig. 2 and Table 1). The π → π* band of the E,E-isomer of o-2 is broader than the corresponding band of the other studied compounds and has an absorption maximum at ∼303 nm with a strong shoulder at ∼340 nm. The spectrum of the Z-isomer (PSSUV) of o-2 is not shown as it was not possible to accumulate a detectable amount of this isomer even after prolonged irradiation.61 The absorption spectra of p-2 show the strongest spectral shift compared to the parent AB (Fig. 2 and Table 1). The maximum of the π → π* band of the E,E-isomer is located at ∼358 nm, whereas the n → π* band peaks at ∼450 nm. | ||
| Fig. 2 Absorption spectra of the investigated compounds in the photostationary states (PSS) after VIS and UV irradiation. The transparent rectangulars (UV and VIS) mark the corresponding illumination wavelength ranges. See Fig. S13 (ESI†) for the 200–250 nm range. | ||
| ππ* absorption λmax [nm] | nπ* absorption λmax [nm] | ππ* irradiation QYE→Za [%] | Z → E thermalbτ1/2 | |
|---|---|---|---|---|
| a QY as determined from the femtosecond transient absorption data (Fig. 4 and Fig. S7, ESI) based on the ratio of the initial (150 fs) and the final (1.3 ns) ground state bleach intensity. b Measured at 22 °C. | ||||
| E-1 | 315 | 442 | ∼12–14 | ∼2 d |
| E,E-o-2 | 303 | 424 | ∼6–8 | 1.6 ms |
| E,E-m-2 | 320 | 437 | ∼8–11 | >2 d |
| E,E-p-2 | 358 | 450 | ∼1.5–2.5 | ∼10 h |
The connection pattern in bis(AB)s affects also the thermal Z → E relaxation rates after UV irradiation (Table 1). While m-2 has a half-life similar to that of AB, the half-life of p-2 is shortened to ∼10 h. Interestingly, although no Z-form of o-2 was accumulated during UV irradiation, the ultrafast time-resolved experiments (vide infra) clearly demonstrated that this compound is indeed capable of E → Z isomerization. Therefore, nanosecond flash photolysis63 was used to determine the thermal Z → E relaxation rate of o-2 (Fig. S12, ESI†) which yielded a half-life of ∼1.6 ms. The E → Z isomerization QY of o-2 and m-2 is about 6–8% (Table 1). As previously observed,59 the isomerization QY of p-2 (∼1–2%) is significantly lower than that of the other compounds (Table 1).
Theoretical calculations
Quantum chemical calculations using time-dependent density functional theory (TDDFT)64–66 in combination with the BHLYP67 exchange–correlation functional and the 6-31G* basis set68 (see ESI†) were performed to understand the molecular origin of the spectral properties of the investigated bis(AB)s. The calculations were performed with and without conductor-like polarizable continuum model (C-PCM)69–71 for ethanol solvation and have been validated against higher-level ab initio methods.72–74 The theoretical absorption spectra for AB in E- and Z-isomerization states, as well as for the bis(AB)s in E,E-and E,Z-isomerization states are shown in Fig. 3. The absorption spectra of the E,E-bis(AB)s were calculated for two different possible isomers, however a significant effect on the spectral properties was observed only in the case of o-2 (Fig. 3, see Fig. S4, ESI† for m-2 and p-2). The attachment and detachment densities75,76 for the energetically lowest singlet states of the different bis(AB)s (Fig. S5, ESI†) indicate the character of the electronic transitions as well as at the level of interaction between the two AB moieties.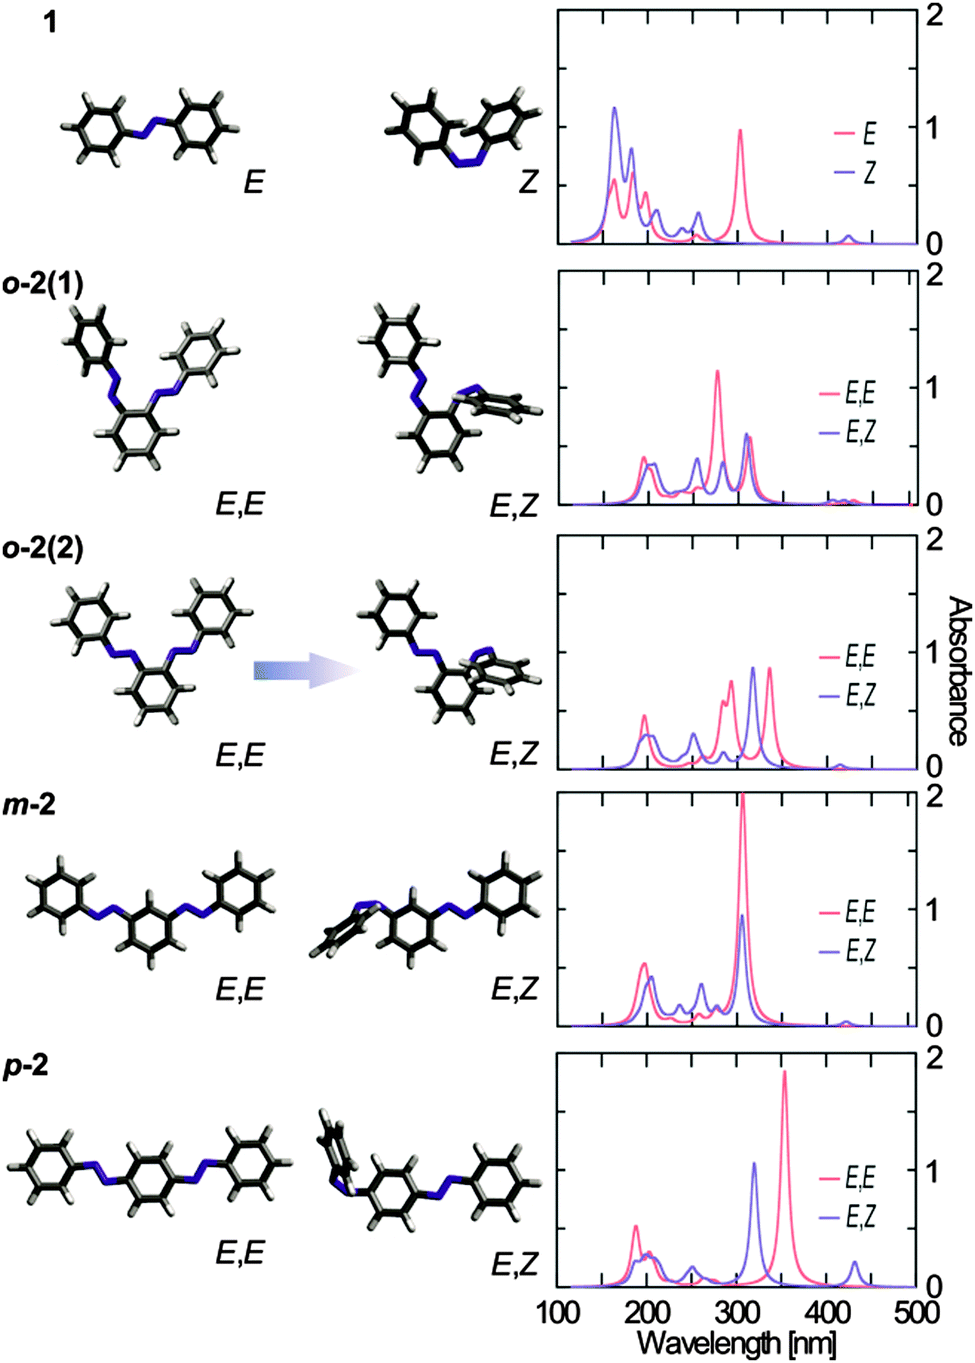 | ||
| Fig. 3 Molecular structures of E- and Z-AB, as well as the E,E and E,Z isomers of the o-, m- and p-bis(AB) (left side) together with the corresponding simulated spectra using TDDFT/BHLYP/6-31G* with a PCM for ethanol (right). | ||
The theoretical spectra of 1, m-2 and p-2 (Fig. 3) are consistent with the experimental data (Fig. 2). The position of the theoretically predicted π → π* transition band of the E,E-m-2 coincides roughly with the position of the same transition of E-AB (Fig. 3, ∼306 nm). However, the intensity of the band in m-2 is two times larger than in AB, which accounts for the presence of two AB moieties. Overall, the two AB moieties of m-2 are largely decoupled from each other as suggested previously.60 The E,E-m-2 has two optically forbidden n → π* transitions located above 400 nm. E → Z isomerization of one of the azo groups of m-2 leads to the rise of the characteristic Z-isomer n → π* transition band at ∼424 nm and the concomitant decrease in the intensity of the π → π* transition band (Fig. 3). Nevertheless, the latter band does not disappear completely, but is only reduced to half of the original intensity and thus the E,Z-m-2 is nearly a sum of the E- and Z-AB spectra.
The strong red-shift (∼50 nm) of the π → π* transition band of p-2 (Fig. 2) as compared to AB is reflected also in the theoretical spectra (Fig. 3). Furthermore, similarly to m-2, the intensity of this band is about twice as large as the one of AB, accounting for the presence of two AB moieties. The results show that the conjugated π-system extends over the complete molecule (Fig. S5, ESI†), which decreases the energy of the π → π* transition. Isomerization of one of the AB units of E,E-p-2 leads to the disappearance of the π → π* transition band at ∼354 nm and simultaneous rise of the Z-isomer n → π* transition at ∼430 nm. The isomerization breaks the planar conformation of the molecule and destroys the extended π-system delocalization, which results in the observation of a single E-isomer π → π* transition band at ∼320 nm similar to the one of AB (the E,Z-p-2 spectrum is nearly a sum of the E-AB and Z-AB spectra). The small red shift of the π → π* transition band of E,Z-p-2 indicates that even after E → Z isomerization a certain level of conjugation between the two AB units remains.
The theoretical spectra of o-2 deviate largely from AB (Fig. 3). The spectra of E,E-o-2 are characterized by a dual band feature in the π → π* transition range (at 278 nm and 313 nm for E,E-o-2(1), and at 293 nm and 336 nm for E,E-o-2(2)), which resembles the experimental absorption spectra (Fig. 2). A key result from the theoretical calculations on o-2 is that the dual band structure of the absorption spectrum of the E,E-isomer is due to the interaction between the two AB moieties. The o-2 bis(AB) molecule can be regarded as composed of two identical, non-conjugated AB units with strongly interacting transition dipole moments oriented along different axes of the molecule. As a consequence, intramolecular excitonic coupling occurs between the π → π* transition dipole moments of two AB units, which causes excitonic splitting of the corresponding band into a higher and a lower transition. In this respect, the two isomers of o-2 have slightly different theoretical spectra. The non-planar configuration of E,E-o-2(1) has a more parallel orientation of the π → π* transition dipole moments, which results in a higher intensity of the blue-shifted excitonic band. This effect might be enhanced also by potential interactions between the electron clouds of the two NN groups. Conversely, in the planar E,E-o-2(2) the π → π* transition dipole moments are less parallel, which leads to a more equal intensity of the two excitonic bands. Furthermore, the planar configuration allows for certain π delocalization, which contributes to the red-shift of the low energy band. The theoretical spectra of the isomerized E,Z-o-2 are different for the two isomers. The isomerization destroys the excitonic coupling between the two AB units, and the corresponding π → π* transition excitonic bands are replaced by the typical AB π → π* transition band (∼310 nm). The isomerization is accompanied also by a rise of the associated Z-isomer n → π* transition band above 400 nm. In the twisted configuration (E,Z-o-2(1)), an interaction between the electron clouds of the azo groups leads to splitting of the n → π* transition band. In contrast, the spectrum of the planar E,Z-o-2(2) is similar to the sum of the E- and Z-AB spectra. The Boltzmann population for the twisted and the planar isomers of the different E,E-bis(AB)s was computed based on the BHLYP/6-31G* results to determine their contribution to the experimental spectra. In the case of m-2 and p-2 the energy difference between the different isomers is negligible as is their spectral difference. However, in the case of o-2 the planar E,E-o-2(2) isomer is ∼0.05 eV lower in energy than the twisted E,E-o-2(1) isomer. Thus, the experimental spectrum of o-2 (Fig. 3) is determined predominantly by the planar isomer (∼87%) with a minor contribution of the twisted isomer (∼13%).
Ultrafast E → Z isomerization after π → π* excitation
The ultrafast E → Z isomerization kinetics in bis(AB)s was investigated by femtosecond transient absorption spectroscopy (Fig. 4). The isomerization process was initiated by laser pulses (∼100–130 fs) with a peak wavelength coinciding either with the main maximum of the π → π* band of the E,E-isomers (Fig. 4) or with the corresponding red-shifted shoulder (Fig. S6, ESI†) of the same band. The transient absorption data of the compounds are characterized by the presence of strong ground state bleach (GSB) signal (negative transient absorption signal, blue) at the position of the corresponding stationary absorption spectra (Fig. 2). At longer wavelengths (>400 nm) the data shows pronounced excited state absorption (ESA) contributions (positive transient absorption signal). Representative kinetics at detection wavelengths within the GSB and the ESA signals are shown for each of the compounds in Fig. 5. | ||
| Fig. 4 Femtosecond transient absorption data (left) and lifetime density maps (right) of the investigated compounds obtained after excitation in the maximum of the π → π* absorption band of the E,E-isomers. (A and B) AB, λexc = 320 nm; (C and D) o-2, λexc = 305 nm; (E and F) m-2, λexc = 320 nm; (G and H) p-2, λexc = 355 nm. The negative-amplitude lifetime distributions at ∼1 ns (left column) corresponds to the non-decaying component and thus to the final absorbance difference spectrum in the transient absorption data. For a comprehensive comparison between excitation in the maximum and in the red-shifted shoulder of the π → π* absorption band see ESI,† Fig. S6–S8. | ||
 | ||
| Fig. 5 Single transient absorption traces at selected detection wavelengths (as indicated in the plots) of the investigated compounds obtained after excitation in the maximum of the π → π* absorption band of the E,E-isomers. (A and B) AB, λexc = 320 nm; (C and D) o-2, λexc = 305 nm; (E and F) m-2, λexc = 320 nm; (G and H) p-2, λexc = 355 nm. | ||
The transient absorption data from the E-isomer of AB (Fig. 4A and Fig. S6A, B, ESI†) is identical to previous studies.26 The GSB signal is located at ∼315 nm and two pronounced ESA bands are observed at ∼475 nm and ∼400 nm. The ESA at ∼475 nm is associated with the initially excited S2 state which decays and populates the S1 excited state (ESA band at ∼400 nm) on the 200–300 fs timescale. The S1 state decay (2 ps timescale) leads to the population of a vibrationally hot ground state (Fig. 4A, 6A and Fig. S7A, B (ESI†), positive transient absorption signal at ∼365 nm, after 2 ps). The cooling of the vibrationally hot molecules proceeds on the 10 ps timescale and is accompanied by the partial recovery of the GSB signal. The cooling dynamics is identical for all compounds. The remaining GSB signal at 1.3 ns (Fig. 6A and Fig. S7A, B, ESI†) shows that not all of the initially excited E-isomers return, thus it is used as a marker for the E → Z isomerization QY (∼13%).
 | ||
| Fig. 6 Transient absorption spectra at different delay times (as indicated in the plots) of the investigated compounds obtained after excitation in the maximum of the π → π* absorption band of the E,E-isomers. (A) AB, λexc = 320 nm; (B) o-2, λexc = 305 nm; (C) m-2, λexc = 320 nm; (D) p-2, λexc = 355 nm. | ||
As expected, based on the stationary absorption spectra (Fig. 2) and the theoretical analysis, the transient absorption data from the E,E-isomer of m-2 (Fig. 4E, 6C and Fig. S6E, F, ESI†) is similar to the one of AB. The spectral positions of the GSB band (∼320 nm) and the main ESA band (∼400 nm) are identical. Nevertheless, a major difference is present in the structure of the ESA bands. While in AB a clear S2 ESA is detected (∼475 nm) such a well-defined feature is missing in the transient absorption of m-2. Instead, on the early timescale (<300 fs) the ESA contribution in m-2 appears to cover the complete spectral range above 350 nm (a weak ESA band is found at ∼540 nm and a strong one at ∼400 nm). The broadening of the ESA is most likely due to the increased number of higher excited states and thus available electronic transitions in the bis compound. After the decay of the initially excited state, the band typical for AB S1 ESA (∼400 nm) remains dominant also in m-2. Nevertheless, the decay time of this ESA band, and thus of the S1 excited state, is increased in m-2 compared to AB. The decay of the S1 excited state of m-2 is not followed by a complete recovery of the GSB band, which indicates that the E → Z isomerization QY (∼10%) is slightly lower than in AB. This QY is in the same range as detected previously59 and in contrast to the recent theoretical calculations, predicting higher QY for m-2 as compared to AB.60
In contrast to m-2, the transient absorption data of the E,E-isomers of o-2 and p-2 differ significantly from that of AB (Fig. 4C, G and Fig. S6, ESI†). The GSB of o-2 is characterized by a dual band feature reflecting the ground state absorption spectrum (Fig. 2). The simultaneous bleach of the two bands after excitation signifies the interaction between the two AB moieties of the o-2 molecule. Similarly to m-2, the initial ESA signal is not structured and no well-defined S2 ESA band can be identified. Rather the ESA is represented by a spectrally broad band with a peak at ∼405 nm. The decay of this initial ESA is slightly slower than in m-2 but it is followed similarly by the dominant S1 ESA at ∼405 nm. The S1 decay in o-2 appears on the same timescale as in m-2. Although in stationary experiments the Z-isomer could not be accumulated,61 the transient abortion data of o-2 (Fig. 4C, 6B and Fig. S7C, D, ESI†) clearly show that after the relaxation of the excited state (<10 ps) the GSB band recovers only to ∼7%. Therefore, contrary to the previous belief,61o-2 is indeed capable of E → Z isomerization, but as shown by the flash photolysis experiments (Fig. S12, ESI† and Table 1) has a very high thermal back relaxation rate (t1/2 = 1.6 ms), which prevents accumulation of the Z-isomer in stationary experiments.
In the transient absorption data of p-2 (Fig. 4G and Fig. S6G, H, ESI†) the GSB (∼360 nm) and ESA (∼550 nm) bands are strongly red-shifted compared to AB, o-2 and m-2. Only one, very broad ESA band can be discerned both after π → π* (Fig. 4G and 6D) and n → π* excitation (Fig. 7) and thus it was assigned to the absorption of the S1 excited state. Consequently, in p-2 the decay of the initially excited S2 state most likely occurs on the <100 fs timescale. A similar conclusion was reached in a recent theoretical study.60 In the range <450 nm a positive intensity contribution can be detected, which rises with the decay of the ESA band and consequently is attributed to the absorption of the vibrationally hot ground state molecules. The decay of this band associated with the cooling of the hot molecules is accompanied by simultaneous decay of the GSB due to the repopulation of the initial ground state. The contribution of the GSB signal at longer timescale (1.3 ns) is minor, indicating that despite the accumulation of the Z-isomer of p-2 in stationary experiments (Fig. 2) the E → Z isomerization efficiency (up to ∼2% QY) is significantly lower than that of the other bis(AB)s.59,60
 | ||
| Fig. 7 Femtosecond transient absorption data (left) and lifetime density maps (right) of the investigated compounds obtained after excitation in the n → π* absorption band (430 nm) of the E,E-isomers. (A and B) AB; (C and D) m-2; (E and F) p-2; for a comprehensive comparison between the compounds see ESI,† Fig. S9–S11. | ||
Additional transient absorption experiments were performed with excitation in the red-shifted shoulder of the E,E-isomers π → π* band (Fig. S6 and S7, ESI†). These experiments did not reveal any major difference in the overall kinetics of 1, m-2 and p-2. In contrast, on the early timescale (<500 fs) and >400 nm the kinetics of o-2 appears to be excitation wavelength dependent (Fig. S7C and D, ESI†). In this spectral range, excitation at 340 nm leads to an increased ESA contribution, which decays until ∼500 fs. The decay is associated with an absorption rise below 420 nm. Based on the theoretical calculations, which indicated the presence of excitonic splitting in o-2, this early blue shift of the ESA could be linked to presence of a barrier on S2 potential energy surface for excitations in the lower energy excitonic band. Onwards, the kinetics of the E,E-isomer are identical for the two excitation wavelengths.
All datasets were analysed using lifetime density analysis (LDA).77 To facilitate the comparison of the kinetics, the results are shown as lifetime density maps (LDM) (Fig. 4 and Fig. S8, ESI†). The LDMs are kinetic footprints77 for each sample under a given condition and thus reveal even minor kinetic differences.
In each LDM (Fig. 4) four lifetime ranges can be distinguished – ∼100 fs; 0.4–3 ps; ∼10–20 ps; >1 ns. In AB, the S2 excited state decay (ESA at ∼475 nm, Fig. 4A) is described by the positive-amplitude lifetime distribution at 100–200 fs (Fig. 4B). The distribution is complemented by negative-amplitude distributions (<450 nm) accounting for the rise of the S1 state (ESA at ∼400 nm, Fig. 4A) and the partial recovery of the ground state (<380 nm, Fig. 4A). The decay of the S1 state (∼400 nm, Fig. 4A) is reflected by a strong positive-amplitude lifetime distribution with a peak at ∼600–700 fs (Fig. 4B and Fig. S8A, B, ESI†). This distribution is accompanied by negative-amplitude distributions <380 nm (Fig. 4B) due to the rise of the absorption of the vibrationally hot ground state molecules (∼400 nm, Fig. 4A). Previously, global lifetime analyses77 of the transient absorption data indicated the presence of two lifetime components describing the decay of the AB S1 excited state (∼300–400 fs and 1–3 ps),23–26 which were assigned to a direct and a diffusive relaxation pathway from the Franck–Condon region. However, as evident from the LDM (Fig. 4B), those two lifetimes fall on the short and the long side of a broad lifetime distribution (ESA decay, ∼400 nm) with a peak at ∼600–700 fs. The presence of a single lifetime distribution shows that there is no abrupt temporal distinction between the pathways along the different relaxation coordinates. Rather the variation in the ground state geometries of the initially excited E-AB molecules leads to a probability distribution for the search of the conical intersection from the Franck–Condon region.
The cooling dynamics of the vibrationally hot AB molecules generated after the relaxation of the excited state is described by a pair of lifetime distributions at ∼10 ps (Fig. 4B): (i) negative at ∼315 nm, accounting for the recovery of the GSB; (ii) positive at ∼365 nm, accounting for the decay of the absorption of the hot molecules. Since the cooling process does not follow a mono-exponential kinetics, the corresponding lifetime distributions have a tilted elliptic shape – a signature typical for cooling dynamics.78,79
The LDMs of all investigated bis(AB)s show differences compared to the LDM of AB (Fig. 4 and Fig. S8, ESI†). The differences are mainly related to the excited state kinetics (<5 ps), while the cooling dynamics (>5 ps) appears to be identical. The LDM of m-2 (Fig. 4F) is the least different from the LDM of AB. In m-2 the positive-amplitude lifetime distribution at 100–200 fs, representing the decay of the initially excited state, covers the complete range >350 nm. This is in contrast to AB, where the distribution is accompanied by a strong negative-amplitude distribution (350–450 nm) related to the rise of the S1 state. As discussed above, in m-2 the ESA of the initially excited state is spectrally very broad and covers also the range of S1 absorption, hence no negative-amplitude 100–200 fs lifetime distribution can be found at ∼400 nm. Nevertheless, a negative-amplitude distribution can be detected in the range of the GSB (<360 nm) accounting for the repopulation of the ground state. At longer lifetimes (∼2 ps) a strong positive-amplitude lifetime distribution is present in m-2, which is similar to the 600–700 fs distribution in AB associated with the S1 decay. Thus, evidently, the S1 excited state decay in m-2 is delayed.
The LDM of o-2 (Fig. 4D) shares similarities with that of m-2. However, the ∼200 fs positive-amplitude lifetime distribution (maximum at 430 nm) is significantly more intense. In addition, the maximum of this lifetime distribution does not coincide spectrally with the maximum of the ESA band (∼405 nm). Instead, it is slightly red-shifted, which indicates that the decay of ESA at longer wavelengths is compensated by a rise of absorption at ∼405 nm (location of the S1 ESA). Therefore, the ∼200 fs lifetime distribution can be assigned to the decay of the initially excited state to the S1 state or repopulation of the ground state. The assignment is further confirmed by the following positive-amplitude distribution at ∼405 nm (∼2 ps) accounting, similarly to the other compounds, for the S1 decay. Noteworthy, o-2 was the only compound that showed excitation wavelength dependence of the transient absorption data (see above, and Fig. S7C and D, ESI†). This dependence is also mirrored in the LDMs (Fig. S8C and D, ESI†), where after 340 nm excitation (in the shoulder of the π → π* band) a much weaker ∼200 fs positive amplitudes distribution is observed at ∼430 nm. As discussed above, in o-2 the excitonic splitting of the π → π* band may lead to an energy barrier on the S2 potential energy surfaces which is overcome on the sub-500 fs timescale. The process leads to a blue shift of the ESA band and appears as a reduced positive amplitude at 430 nm of the ∼200 fs distributions in the LDM.
The LDM of p-2 is dominated by a very broad, in both wavelength and in lifetime, positive-amplitude lifetime distribution, with a peak at ∼550 nm and ∼700 fs (Fig. 4H). The distribution is related to the decay of the S1 excited state of p-2, as assigned above and is matched by a negative-amplitude distribution at ∼350 nm linked to the recovery of the ground state. Those two lifetime distributions of p-2 are characterized by the largest relative lifetime width amongst the four compounds. This can, most likely, be attributed to the delocalization of the excitation over the entire molecule which results in an increased number of degrees of freedom for relaxation.
Ultrafast E → Z isomerization after n → π* excitation
Previous studies21,22 have shown that the QY of the E → Z isomerization of AB is twofold lower after π → π* excitation as compared to n → π* excitation, which implies the presence of different S2 and S1 relaxation pathways. In this respect, the kinetics of the E → Z isomerization of bis(AB)s was investigated also after n → π* excitation (∼430 nm) (Fig. 7 and Fig. S10A, C, E, ESI†). In AB, the transient absorption data after n → π* excitation (Fig. 7A) lack the pronounced, short-lived ESA band (∼475 nm) that is present after π → π* excitation (Fig. 4A) and is associated with the decay of the S2 state. This effect of the excitation wavelength is detectable also when comparing the corresponding LDMs (Fig. 4B and 7B). The kinetics on longer timescale is identical for the two experiments, although in the n → π* excitation a clear 500 nm ESA band can be seen, which decays a bit faster than the ∼400 nm band (Fig. 7A). This difference could potentially account for the difference between the direct and diffusive relaxation pathways. The cooling of the vibrationally hot ground state (∼10 ps) is followed by the repopulation of the initial ground state and photoproduct formation (Z-isomer).The transient absorption datasets recorded after n → π* (Fig. 7C) and π → π* (Fig. 4E) excitation of m-2 are very similar and differ slightly only on the sub-500 fs timescale where in the case of the π → π* excitation a stronger ESA decay is observed (Fig. S7E and S10C, ESI†). This difference is revealed also by comparing the corresponding LDMs, where the positive-amplitude lifetime distribution at ∼100–200 fs (>350 nm), which is present in the π → π* excitation case, is not observed after n → π* excitation (Fig. 4F and 7D). No significant difference between the datasets of the n → π* excitation of AB and m-2 are observed, which means that after S1 excitation the E → Z isomerization of the two compounds proceeds via an identical pathway. In contrast to 1 and m-2, where the n → π* and the π → π* excitation have an effect on the isomerization kinetics, such an influence is not detected for p-2. The two transient absorption datasets as well as the corresponding LDMs are identical (Fig. 4G, H and 7E, F). The results confirm the conclusion that the relaxation of the initially π → π* excited state in p-2 occurs on the sub-100 fs timescale populating to a high degree the S1 excited state. Consequently, the photoinduced dynamics in p-2 proceeds without violation of Kasha's rule, while the dynamics in both 1 and m-2 violates this rule, albeit the effect seems to be less pronounced for m-2.
Ultrafast Z → E isomerization after n → π* excitation
Finally, the photoinduced Z → E isomerization kinetics of the bis(AB)s after n → π* excitation was also studied (Fig. 8 and Fig. S10B, D, F, ESI†). The overall ultrafast dynamics (<1 ps) is slightly accelerated as compared to the one of E → Z isomerization (n → π* excitation).In 1 and m-2, after the decay of the ESA band <400 nm, a clear photoproduct formation band (π → π* absorption of the E-isomer), can be observed at the lower wavelength detection limit (∼350 nm). The band is accompanied by a strong GSB feature present at longer delay times >10 ps (∼430 nm). Interestingly, the timescale of the excited state relaxation of p-2 is very similar for both E ↔ Z isomerization directions (E → Z and Z → E), which is confirmed also by the identical LDMs (Fig. 7F and 8F).
 | ||
| Fig. 8 Femtosecond transient absorption data (left) and lifetime density maps (right) of the investigated compounds obtained after excitation in the n → π* absorption band (430 nm) of the E,Z-isomers. (A and B) AB; (C and D) m-2; (E and F) p-2; for a comprehensive comparison between the compounds see ESI,† Fig. S9–S11. | ||
Conclusions
Multiphotochromic systems, bridging the gap between molecular photoswitches and macroscopic function gain increasing importance in (bio)chemical research and technology. Nevertheless, the complex interactions between the building blocks of such systems is not well-studied and understood. Here we provide thorough insight into the molecular photoswitching behaviour of connected ABs, which represent one of the most important model systems for coupled photoswitches.We reveal a strong dependence of the isomerization dynamics of these systems on the connectivity pattern. While retaining relatively high E → Z isomerization QY, o-bis(AB)s show a very high thermal relaxation rate (half-life on the ms scale). Thus such compounds are extremely suitable for applications where high-temporal resolution of the switching process is required (quick and repeated operation of the photoswitch). Furthermore, the geometry of o-bis(AB)s allows intramolecular excitonic interaction between the AB units, which provides another opportunity for control, modification and fine-tuning of their function. In contrast, m-bis(AB)s show a behaviour that is very similar to the monomeric AB, with the two AB units acting nearly independently from each other. This behaviour permits double isomerization of the m-bis(AB) compound under sufficiently high irradiation. In effect, unique substitution of the two AB units within m-bis(AB)s will permit selective addressing of the two units and thus unprecedented control of the isomerization state of a single molecule double photoswitch. Finally, p-bis(AB)s showed the highest degree of π conjugation extending over the two AB units, which results in strong planarity of the molecule and relatively low QY (∼1%). Despite the lower isomerization QY, p-bis(AB)s are interesting for molecular electronics applications. Their high degree of conjugation allows conductance, which can be precisely controlled (ON/OFF) via fast and reversible light-induced switching. Overall, the current study delivers essential understanding of the molecular behaviour of connected AB and provides an excellent basis for the design and development of new photochromic systems with extensive and versatile application.
Acknowledgements
CS and JW acknowledge the German Research Foundation (DFG, Grant WA 1850/4-1). CY acknowledges the China Scholarship Council for his doctoral founding.References
- Photochromism: Molecules and Systems, ed. H. Dürr and H. Bouas-Laurent, Elsevier, Amsterdam, 2003 Search PubMed.
- Molecular Switches, ed. B. L. Feringa and W. R. Browne, Wiley-VCH, 2001 Search PubMed.
- A. A. Beharry and G. A. Woolley, Chem. Soc. Rev., 2011, 40, 4422–4437 RSC.
- W. Szymański, J. M. Beierle, H. A. V. Kistemaker, W. A. Velema and B. L. Feringa, Chem. Rev., 2013, 113, 6114–6178 CrossRef PubMed.
- M.-M. Russew and S. Hecht, Adv. Mater., 2010, 22, 3348–3360 CrossRef CAS PubMed.
- Y. Wang and Q. Li, Adv. Mater., 2012, 24, 1926–1945 CrossRef CAS PubMed.
- L. Sun, Y. A. Diaz-Fernandez, T. A. Gschneidtner, F. Westerlund, S. Lara-Avila and K. Moth-Poulsen, Chem. Soc. Rev., 2014, 43, 7378–7411 RSC.
- R. H. Kramer, A. Mourot and H. Adesnik, Nat. Neurosci., 2013, 16, 816–823 CrossRef PubMed.
- C. Alvarez-Lorenzo, L. Bromberg and A. Concheiro, Photochem. Photobiol., 2009, 85, 848–860 CrossRef CAS PubMed.
- R. Tong, H. D. Hemmati, R. Langer and D. S. Kohane, J. Am. Chem. Soc., 2012, 134, 8848–8855 CrossRef CAS PubMed.
- A. Lennartson, A. Roffey and K. Moth-Poulsen, Tetrahedron Lett., 2015, 56, 1457–1465 CrossRef CAS.
- A. M. Kolpak and J. C. Grossman, Nano Lett., 2011, 11, 3156–3162 CrossRef CAS PubMed.
- S. Spörlein, H. Carstens, H. Satzger, C. Renner, R. Behrendt, L. Moroder, P. Tavan, W. Zinth and J. Wachtveitl, Proc. Natl. Acad. Sci. U. S. A., 2002, 99, 7998–8002 CrossRef PubMed.
- T. Hugel, N. B. Holland, A. Cattani, L. Moroder, M. Seitz and H. E. Gaub, Science, 2002, 296, 1103–1106 CrossRef PubMed.
- J. Wachtveitl, S. Spörlein, H. Satzger, B. Fonrobert, C. Renner, R. Behrendt, D. Oesterhelt, L. Moroder and W. Zinth, Biophys. J., 2004, 86, 2350–2362 CrossRef CAS PubMed.
- C. Renner and L. Moroder, ChemBioChem, 2006, 7, 869–878 CrossRef PubMed.
- A. Khan, C. Kaiser and S. Hecht, Angew. Chem., Int. Ed., 2006, 45, 1878–1881 CrossRef CAS PubMed.
- T. Sasaki and J. M. Tour, Org. Lett., 2008, 10, 897–900 CrossRef CAS PubMed.
- Y. Kageyama, N. Tanigake, Y. Kurokome, S. Iwaki, S. Takeda, K. Suzuki and T. Sugawara, Chem. Commun., 2013, 49, 9386–9388 RSC.
- S. Iamsaard, S. J. Aßhoff, B. Matt, T. Kudernac, J. J. L. M. Cornelissen, S. P. Fletcher and N. Katsonis, Nat. Chem., 2014, 6, 229–235 CrossRef CAS PubMed.
- H. Rau, in Photochromism: Molecules and Systems, ed. H. Dürr and H. Bouas-Laurent, Elsevier, Amsterdam, 2003, ch. 4, pp. 165–192 Search PubMed.
- P. Bortolus and S. Monti, J. Phys. Chem., 1979, 83, 648–652 CrossRef CAS.
- T. Nägele, R. Hoche, W. Zinth and J. Wachtveitl, Chem. Phys. Lett., 1997, 272, 489–495 CrossRef.
- Y. C. Lu, C. W. Chang and E. W. G. Diau, J. Chin. Chem. Soc., 2002, 49, 693–701 CrossRef CAS.
- H. Satzger, S. Spörlein, C. Root, J. Wachtveitl, W. Zinth and P. Gilch, Chem. Phys. Lett., 2003, 372, 216–223 CrossRef CAS.
- H. Satzger, C. Root and M. Braun, J. Phys. Chem. A, 2004, 108, 6265–6271 CrossRef CAS.
- T. Fujino, S. Y. Arzhantsev and T. Tahara, J. Phys. Chem. A, 2001, 105, 8123–8129 CrossRef CAS.
- P. Hamm, S. M. Ohline and W. Zinth, J. Chem. Phys., 1997, 106, 519–529 CrossRef CAS.
- T. Fujino, S. Y. Arzhantsev and T. Tahara, Bull. Chem. Soc. Jpn., 2002, 75, 1031–1040 CrossRef CAS.
- M. Quick, A. L. Dobryakov, M. Gerecke, C. Richter, F. Berndt, I. N. Ioffe, A. A. Granovsky, R. Mahrwald, N. P. Ernsting and S. A. Kovalenko, J. Phys. Chem. B, 2014, 118, 8756–8771 CrossRef CAS PubMed.
- H. Rau, E. Luddecke, H. Nitsch and H. Patzelt, Bull. Soc. Chim. Belg., 1982, 91, 475 CrossRef.
- C. Ciminelli, G. Granucci and M. Persico, Chem. – Eur. J., 2004, 10, 2327–2341 CrossRef CAS PubMed.
- A. Toniolo, C. Ciminelli, M. Persico and T. J. Martinez, J. Chem. Phys., 2005, 123, 234308 CrossRef CAS PubMed.
- C. R. Crecca and A. E. Roitberg, J. Phys. Chem. A, 2006, 110, 8188–8203 CrossRef CAS PubMed.
- M. Pederzoli, J. Pittner, M. Barbatti and H. Lischka, J. Phys. Chem. A, 2011, 115, 11136–11143 CrossRef CAS PubMed.
- T. Cusati, G. Granucci and M. Persico, J. Am. Chem. Soc., 2011, 133, 5109–5123 CrossRef CAS PubMed.
- Y. Harabuchi, M. Ishii, A. Nakayama, T. Noro and T. Taketsugu, J. Chem. Phys., 2013, 138, 064305 CrossRef PubMed.
- L. Gagliardi, G. Orlandi, F. Bernardi, A. Cembran and M. Garavelli, Theor. Chem. Acc., 2004, 111, 363–372 CrossRef CAS.
- I. Conti, M. Garavelli and G. Orlandi, J. Am. Chem. Soc., 2008, 130, 5216–5230 CrossRef CAS PubMed.
- S. Yuan, Y. Dou, W. Wu, Y. Hu and J. Zhao, J. Phys. Chem. A, 2008, 112, 13326–13334 CrossRef CAS PubMed.
- M. Böckmann, N. L. Doltsinis and D. Marx, Phys. Rev. E: Stat., Nonlinear, Soft Matter Phys., 2008, 78, 036101 CrossRef PubMed.
- Y. Ootani, K. Satoh, A. Nakayama, T. Noro and T. Taketsugu, J. Chem. Phys., 2009, 131, 194306 CrossRef PubMed.
- M. Böckmann, N. L. Doltsinis and D. Marx, J. Phys. Chem. A, 2010, 114, 745–754 CrossRef PubMed.
- G. Tiberio, L. Muccioli, R. Berardi and C. Zannoni, ChemPhysChem, 2010, 11, 1018–1028 CrossRef CAS PubMed.
- J. A. Gámez, O. Weingart, A. Koslowski and W. Thiel, J. Chem. Theory Comput., 2012, 8, 2352–2358 CrossRef PubMed.
- V. Cantatore, G. Granucci and M. Persico, Comput. Theor. Chem., 2014, 1040–1041, 126–135 CrossRef CAS.
- M. Biswas and I. Burghardt, Biophys. J., 2014, 107, 932–940 CrossRef CAS PubMed.
- A. Cembran, F. Bernardi, M. Garavelli, L. Gagliardi and G. Orlandi, J. Am. Chem. Soc., 2004, 126, 3234–3243 CrossRef CAS PubMed.
- P. Cattaneo and M. Persico, Phys. Chem. Chem. Phys., 1999, 1, 4739–4743 RSC.
- J. Dokić, M. Gothe, J. Wirth, M. V. Peters, J. Schwarz, S. Hecht and P. Saalfrank, J. Phys. Chem. A, 2009, 113, 6763–6773 CrossRef PubMed.
- R. Reuter and H. A. Wegner, Chem. Commun., 2013, 49, 146–148 RSC.
- L. Schweighauser, D. Häussinger, M. Neuburger and H. A. Wegner, Org. Biomol. Chem., 2014, 12, 3371–3379 CAS.
- E. Durgun and J. C. Grossman, J. Phys. Chem. Lett., 2013, 4, 854–860 CrossRef CAS PubMed.
- D. Bléger, J. Dokić, M. V. Peters, L. Grubert, P. Saalfrank and S. Hecht, J. Phys. Chem. B, 2011, 115, 9930–9940 CrossRef PubMed.
- Z. Yu and S. Hecht, Angew. Chem., Int. Ed., 2011, 50, 1640–1643 CrossRef CAS PubMed.
- N. B. Holland, T. Hugel, G. Neuert, A. Cattani-Scholz, C. Renner, D. Oesterhelt, L. Moroder, M. Seitz and H. E. Gaub, Macromolecules, 2003, 36, 2015–2023 CrossRef CAS.
- J. E. Koskela, V. Liljeström, J. Lim, E. E. Simanek, R. H. A. Ras, A. Priimagi and M. A. Kostiainen, J. Am. Chem. Soc., 2014, 136, 6850–6853 CrossRef CAS PubMed.
- M. Baroncini, S. d'Agostino, G. Bergamini, P. Ceroni, A. Comotti, P. Sozzani, I. Bassanetti, F. Grepioni, T. M. Hernandez, S. Silvi, M. Venturi and A. Credi, Nat. Chem., 2015, 7, 634–640 CrossRef CAS PubMed.
- F. Cisnetti, R. Ballardini, A. Credi, M. T. Gandolfi, S. Masiero, F. Negri, S. Pieraccini and G. P. Spada, Chem. – Eur. J., 2004, 10, 2011–2021 CrossRef CAS PubMed.
- G. Floß and P. Saalfrank, J. Phys. Chem. A, 2015, 119, 5026–5037 CrossRef PubMed.
- S. Bellotto, R. Reuter, C. Heinis and H. A. Wegner, J. Org. Chem., 2011, 76, 9826–9834 CrossRef CAS PubMed.
- R. Reuter, N. Hostettler, M. Neuburger and H. A. Wegner, Eur. J. Org. Chem., 2009, 5647–5652 CrossRef CAS.
- D. Chatterjee, C. E. Eckert, C. Slavov, K. Saxena, B. Fürtig, C. R. Sanders, V. V. Gurevich, J. Wachtveitl and H. Schwalbe, Angew. Chem., Int. Ed., 2015, 54, 13555–13560 CrossRef CAS PubMed.
- E. Runge and E. K. U. Gross, Phys. Rev. Lett., 1984, 52, 997–1000 CrossRef CAS.
- M. E. Casida, Recent Advances in Density Functional Methods, World Scientific, 1995 Search PubMed.
- A. Dreuw and M. Head-Gordon, Chem. Rev., 2005, 105, 4009–4037 CrossRef CAS PubMed.
- A. D. Becke, J. Chem. Phys., 1993, 98, 1372–1377 CrossRef CAS.
- W. J. Hehre, R. Ditchfield and J. A. Pople, J. Chem. Phys., 1972, 56, 2257–2261 CrossRef CAS.
- J. Liu and W. Liang, J. Chem. Phys., 2011, 135, 014113 CrossRef PubMed.
- J. Liu and W. Liang, J. Chem. Phys., 2011, 135, 184111 CrossRef PubMed.
- J. Liu and W. Liang, J. Chem. Phys., 2013, 138, 024101 CrossRef PubMed.
- J. Schirmer, Phys. Rev. A: At., Mol., Opt. Phys., 1982, 26, 2395–2416 CrossRef CAS.
- M. Wormit, D. R. Rehn, P. H. P. Harbach, J. Wenzel, C. M. Krauter, E. Epifanovsky and A. Dreuw, Mol. Phys., 2014, 112, 774–784 CrossRef CAS.
- A. Dreuw and M. Wormit, Wiley Interdiscip. Rev.: Comput. Mol. Sci., 2015, 5, 82–95 CrossRef CAS.
- F. Plasser, S. A. Bäppler, M. Wormit and A. Dreuw, J. Chem. Phys., 2014, 141, 024107 CrossRef PubMed.
- F. Plasser, M. Wormit and A. Dreuw, J. Chem. Phys., 2014, 141, 024106 CrossRef PubMed.
- C. Slavov, H. Hartmann and J. Wachtveitl, Anal. Chem., 2015, 87, 2328–2336 CrossRef CAS PubMed.
- P. Trojanowski, J. Plötner, C. Grünewald, F. F. Graupner, C. Slavov, A. J. Reuss, M. Braun, J. W. Engels and J. Wachtveitl, Phys. Chem. Chem. Phys., 2014, 16, 13875–13888 RSC.
- C. Slavov, N. Bellakbil, J. Wahl, K. Mayer, K. Rück-Braun, I. Burghardt, J. Wachtveitl and M. Braun, Phys. Chem. Chem. Phys., 2015, 17, 14045–14053 RSC.
Footnote |
| † Electronic supplementary information (ESI) available. See DOI: 10.1039/c6cp00603e |
| This journal is © the Owner Societies 2016 |