Startling temperature effect on proteins when confined: single molecular level behaviour of human serum albumin in a reverse micelle†
Received
21st January 2016
, Accepted 16th April 2016
First published on 22nd April 2016
Abstract
The present work reports the effect of confinement, and temperature therein, on the conformational fluctuation dynamics of domain-I of human serum albumin (HSA) by fluorescence correlation spectroscopy (FCS). The water-pool of a sodium bis(2-ethylhexyl)sulfosuccinate (AOT) reverse micelle has been used as the confined environment. It was observed that the conformational fluctuation time is about 6 times smaller compared to bulk medium when confined in a water-pool of 3.5 nm radius. On increasing the size of the water-pool the conformational fluctuation time was found to increase monotonically and approaches the bulk value. The effect of confinement is on par with the general belief about the restricted motion of a macromolecule upon confinement. However, the effect of temperature was found to be surprising. An increase in the temperature from 298 K to 313 K induces a larger change in the conformational fluctuation time in HSA, when confined. In the bulk medium, apparently there is no change in the conformational fluctuation time in the aforementioned temperature range, whereas, when HSA is present in an AOT water-pool of radius 3.5 nm, about an 88% increase in the fluctuation time was observed. The observed prominent thermal effect on the conformational dynamics of domain-I of HSA in the water-pool of an AOT reverse micelle as compared to in the bulk medium was concluded to arise from the confined solvent effect.
1. Introduction
The physiological importance of proteins makes them one of the most significant classes of biological molecules and they have caught the attention of researchers since early times.1,2 Although proteins are characterised by their unique structures, recent studies indicate that the unique structures of proteins are not static in nature and are associated with a low-frequency breathing motion, which is related to the conformational fluctuation dynamics of the protein.3,4 Such conformational dynamics are believed to be responsible for several of the biological activities of a protein.5 This is expected to be sensitive to the overall structure of the protein and is found to be mostly appreciable during the course of its denaturation.6–13 In our recent work, we have reported the effect of denaturation on the conformational dynamics of human serum albumin (HSA).8 On denaturation by guanidine hydrochloride, the conformational fluctuation time of domain-I of HSA was found to increase from the native state and this has been assigned to the increased size of the protein. Moreover, an intermediate state was identified through this study, which was not otherwise observed. However, no signature of such an intermediate state was observed during the thermal denaturation of HSA. Recently Bhattacharyya and co-workers have studied the effect of room temperature ionic liquids (RTILs) on the conformational fluctuation time of HSA and cytochrome-c in both their native and unfolded states. They have reported that the addition of RTIL slows down the dynamics of the protein in the native state, whereas in the denatured state the dynamics become faster in the presence of RTIL.9,10 Apart from experimental methods, theoretical approaches have also been utilised to visualize protein conformational dynamics.11,14–17 Gollapalli et al. performed molecular dynamics simulations of a heat shock protein derived from mycobacterium tuberculosis to map the conformational change during the protein folding process. They could trace the dynamics related to the two rigid body movements across the hinge region, which are assigned as the movement of the apical domain away from the equatorial domain, and inward movement of the intermediate domain.15
On the other hand, the behaviour of proteins in reverse micellar systems is also a topic of contemporary research as it closely mimics the biological cell.18–24 Malik et al. studied the interaction of 1-anilinonapthelenesulfonate (ANS) with HSA under confinement and reported that the binding of ANS to HSA in AOT reverse micelles is significantly retarded as compared to in a buffer and suggested the non-specificity of domain specific binding sites in the reverse micellar system as the probable reason.25 It has been generally confirmed that proteins behave differently in confined environments as compared to in bulk.21,22,24,25 Considering the idea of confinement, it is expected that proteins will undergo faster conformational dynamics in a confined environment due to restriction of the free movement of the polypeptide chains, and the effect of temperature should also be less prominent under confinement compared to that in bulk.
The most advanced technique for studying conformational dynamics is fluorescence correlation spectroscopy (FCS).9,10,26–29 This is a single molecular level technique and relies on the fluctuation of the fluorescence intensity from a very small observation volume. The source of the fluorescence intensity fluctuation generally comes from the in–out movement of the fluorescent molecule in the observation volume, which gives an idea of the diffusion coefficient of the fluorescent molecule in the medium through the temporal autocorrelation of the fluorescence fluctuation. Fluctuation can also arise from the time dependent quenching of the fluorophore present in the protein by some of the amino acids through the fluctuation of the protein side chains. The time autocorrelation of such fluctuation in-turn can give information about the conformational fluctuation dynamics of the protein. Several researchers have used FCS to measure the conformation fluctuation of proteins.7–10,30–33
In this study we intend to elucidate the conformational dynamics of a protein in a nano-cavity using FCS. For this purpose human serum albumin (HSA) has been taken as a model protein. HSA is a multi-domain transport protein (molecular weight = 66.5 kD) present in blood plasma, and has 585 amino acid residues and 17 disulfide bridges. Crystallographic characterization of HSA disclosed the existence of three structurally similar α-helical domains, which are further divided into two sub-domains.34,35 Each of these domains has different binding properties. In this work we have chosen to study domain-I selectively. Domain-I of HSA has a single free cystine residue (Cys-34), which can be tagged selectively with tetramethylrhodamine-5-maleimide (TMR).36 Cys-34 is in close proximity to Phe-27, Ala-28, Gln-29, Gln-33, Pro-35, His-39, Val-40, Leu-80, Arg-81, Glu-82, Thr-83, Glu-132 and Lys-136 of HSA.34 As a model for the confined environment we have chosen the well defined water-pool of the sodium bis(2-ethylhexyl)sulfosuccinate (AOT) reverse micelle, which has been known from the early days as a mimic of a biological confined environment (Scheme 1).37,38 The size of the water-pool can be controlled easily and efficiently and is characterized by the ratio of the concentration of the polar phase to the concentration of surfactant (W0), and is expressed as39
| |  | (1) |
With an increase in
W0, the radius of the AOT water-pool (
rw) increases. The radius of the water-pool (
rw) inside the AOT reverse micelle can be written as a function of
W0 as
| |  | (2) |
where
nag is the average aggregation number of surfactants per reverse micelle.
44 We have varied the value of
W0 from 20 to 46 and monitored the conformational dynamics of domain-I of the HSA encapsulated in it. We have also checked the variation of conformational dynamics as a function of temperature from 298 K to 313 K.
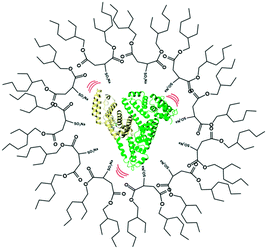 |
| | Scheme 1 Schematic representation of human serum albumin (HSA) encapsulated within the nano water-pool of a sodium bis(2-ethylhexyl)sulfosuccinate (AOT) reverse micelle. | |
2. Experimental section
2.1. Materials
Human serum albumin (HSA, essentially fatty acid free) and tetramethylrhodamine-5-maleimide (TMR) were purchased from Sigma-Aldrich, USA and used as received. Analytical grade di-sodium hydrogen phosphate and sodium di-hydrogen phosphate were purchased from Merck, India and used to prepare 50 mM buffer (pH 7.4). Docusate sodium salt (AOT) was purchased from Sigma and used after drying under vacuum for 24 hours each time before solution preparation. Dialysis membrane tubing (12 kDa cut-off) was purchased from Sigma-Aldrich, USA and used after removing the glycerol and sulfur compounds according to the procedure given by Sigma-Aldrich. Centrifugal filter units (Amicon Ultra, 10 kDa cut-off) have been purchased from Merck Millipore, Germany.
2.2. Protein labeling and sample preparation
HSA was labelled with TMR following the procedure described by Wang et al. with minor modification (see Scheme 2).40 Briefly, TMR solution in DMSO was added drop by drop to a HSA stock solution (90 μM) in phosphate buffer (50 mM, pH 7.4). The molar ratio of HSA to dye was maintained at 1![[thin space (1/6-em)]](https://www.rsc.org/images/entities/char_2009.gif) :
:![[thin space (1/6-em)]](https://www.rsc.org/images/entities/char_2009.gif) 3.5. The mixture was then stirred gently at room temperature for about 10 h. To remove the unreacted dye, the reaction mixture was dialysed against 500 ml of 1
3.5. The mixture was then stirred gently at room temperature for about 10 h. To remove the unreacted dye, the reaction mixture was dialysed against 500 ml of 1![[thin space (1/6-em)]](https://www.rsc.org/images/entities/char_2009.gif) :
:![[thin space (1/6-em)]](https://www.rsc.org/images/entities/char_2009.gif) 35 DMSO
35 DMSO![[thin space (1/6-em)]](https://www.rsc.org/images/entities/char_2009.gif) :
:![[thin space (1/6-em)]](https://www.rsc.org/images/entities/char_2009.gif) buffer mixture at 4 °C. The dialysis solution was replaced 4 times at intervals of 12 h. Then the solution was replaced with pure phosphate buffer (50 mM, pH 7.4) several times during the next 6–8 days. The dialysis solution was checked each time for fluorescence. Dialysis was finally stopped when the dialysis solution was found to be totally free of any dye. The HSA
buffer mixture at 4 °C. The dialysis solution was replaced 4 times at intervals of 12 h. Then the solution was replaced with pure phosphate buffer (50 mM, pH 7.4) several times during the next 6–8 days. The dialysis solution was checked each time for fluorescence. Dialysis was finally stopped when the dialysis solution was found to be totally free of any dye. The HSA![[thin space (1/6-em)]](https://www.rsc.org/images/entities/char_2009.gif) :
:![[thin space (1/6-em)]](https://www.rsc.org/images/entities/char_2009.gif) TMR ratio in the final solution was estimated to be 1
TMR ratio in the final solution was estimated to be 1![[thin space (1/6-em)]](https://www.rsc.org/images/entities/char_2009.gif) :
:![[thin space (1/6-em)]](https://www.rsc.org/images/entities/char_2009.gif) 0.6 from the known value of molar extinction coefficients (for HSA ε280 = 36
0.6 from the known value of molar extinction coefficients (for HSA ε280 = 36![[thin space (1/6-em)]](https://www.rsc.org/images/entities/char_2009.gif) 500 M−1 cm−1 and for TMR ε555 = 75
500 M−1 cm−1 and for TMR ε555 = 75![[thin space (1/6-em)]](https://www.rsc.org/images/entities/char_2009.gif) 000 M−1 cm−1).8,36 The concentration of HSA was maintained at 40 nM in the bulk phase as well as in the water-pool of the reverse micelle. AOT reverse micelles of different water-pool sizes were prepared by injecting the required amount of protein sample into a 25 mM solution of AOT in iso-octane. All the experiments were done at 298 ± 1 K if not stated otherwise.
000 M−1 cm−1).8,36 The concentration of HSA was maintained at 40 nM in the bulk phase as well as in the water-pool of the reverse micelle. AOT reverse micelles of different water-pool sizes were prepared by injecting the required amount of protein sample into a 25 mM solution of AOT in iso-octane. All the experiments were done at 298 ± 1 K if not stated otherwise.
 |
| | Scheme 2 Tagging of human serum albumin (HSA) with tetramethylrhodamine-5-maleimide (TMR). | |
2.3. Instruments and methods
The steady state absorption and emission spectra were recorded using a commercial UV-visible spectrophotometer (UV-2450, Schimadzu, Japan) and spectrofluorimeter (Fluoromax-4, Jobin Yvon, USA), respectively. The temperature was controlled using a commercial temperature controlled water circulator system (CCLB-202, Labocon, UK). Circular dichroism spectra were recorded using a commercial CD spectrometer (Jasco J-815, Japan) and the sample was kept in an absorption cuvette of path length 1 mm. The concentration of protein was maintained at μM level for CD measurements. The percentage of α-helicity was calculated as (MRE208nm − 4000)/(33![[thin space (1/6-em)]](https://www.rsc.org/images/entities/char_2009.gif) 000 − 4000) where MRE208nm is the mean residual elipticity at 208 nm, which is defined as MRE208nm = (α208nmM)/(ncl) where α208nm is the CD signal at 208 nm, M is the molecular weight of HSA, n is the total number of amino acid residues in the protein, l is the path length and c is the concentration of protein in grams per liter.8
000 − 4000) where MRE208nm is the mean residual elipticity at 208 nm, which is defined as MRE208nm = (α208nmM)/(ncl) where α208nm is the CD signal at 208 nm, M is the molecular weight of HSA, n is the total number of amino acid residues in the protein, l is the path length and c is the concentration of protein in grams per liter.8
2.4. FCS measurements and data analysis
FCS experiments were done using a home built FCS set-up.8 The set-up consists of an inverted confocal microscope (Olympus IX-71, Japan), a 60× water immersion objective with a numerical aperture of 1.2, a 5 mW 532 nm laser source (SDL-532-LN-002T, Sanghai Dream Laser Tech), a multimode fiber patch chord of 25 μm diameter (M67L01 25 μm, 0.10 NA, ThorLabs, USA), a dichroic mirror (ZT532rdc, Chroma Tech. Corp., USA), an emission filter (605/70m, Chroma Tech. Corp., USA), a photon counting module (SPCM-AQRH-13-FC, Excelitas Tech. Inc., Canada), and a correlator card (Flex99OEM-12/E, Correlator.com, USA). The laser light was focused on the sample kept on a cover-slip (Blue Star, Polar Industrial Corporation) on the sample platform after proper attenuation. The distance of the focal point from the upper surface of the cover slip was kept at 40 μm. The emitted photons were directed to the detector through the fiber patch chord. The detected photon counts were received and autocorrelated by the correlator card and displayed by a Labview program on a computer.
The autocorrelation function G(τ) is a measure of the self-similarity of temporal fluctuation of the emitted photon from a very small observation volume and is described as41
| |  | (3) |
In the above equation, 〈
F(
t)〉 is the average fluorescence intensity, and δ
F(
t) and δ
F(
t +
τ) are the quantity of fluctuation in intensity around the mean value at time
t and
t +
τ, respectively, and are given by
41| | | δF(t) = F(t) − 〈F(t)〉 and δF(t + τ) = F(t + τ) − 〈F(t)〉. | (4) |
For a monodisperse system, the autocorrelation function arising from pure diffusion of the fluorescent particle in-and-out of the observation volume is given by,
41| |  | (5) |
where
N is the number of particles in the observation volume, and
ω =
r/
l,
i.e. the ratio of the radial and axial radii of the 3D Gaussian volume. If the fluorescence fluctuation is associated with any other processes along with the diffusion phenomenon, then the autocorrelation curve will take the form
42| |  | (6) |
where
τR is the time component and
a is the amplitude of the corresponding process other than diffusion. For polydisperse systems, however, the equation containing a single diffusion time can not fit the data accurately. In that case a Gaussian distribution is introduced to the diffusion time component to best fit the data. In our case the data could be best fitted when Gaussian distributions were incorporated in both the diffusion and the exponential relaxation parts. On a logarithmic time scale, the fitting equation then becomes
39| | 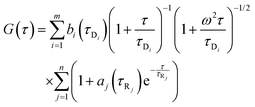 | (7) |
where
| |  | (8) |
| |  | (9) |
In
eqn (8) and (9)Bi and
Aj are the relative amplitudes of the components, and
τpD and
τpR are the peak diffusion of relaxation times having a width of
σD and
σR respectively. The choice of fitting model in the present study has been elaborated in the ‘Results and discussion’ section. The translational diffusion coefficient and the hydrodynamic radius can be calculated from the diffusion time (
τD) and radius of the observation volume (
r) as
41| |  | (10) |
| |  | (11) |
where
kB is the Boltzmann constant,
T is the absolute temperature and
η is the viscosity of the medium. The radius ‘
r’ of the excitation volume was estimated from the diffusion time (
τD) of Rhodamine 6G in water (
Dt = 4.14 × 10
−6 cm
2 s
−1) at 298 K following standard procedure. The transverse radius and detection volume were calculated to be ∼280 nm and ∼0.5 fl, respectively.
43 The viscosity of the AOT solution can be calculated as
39| | | ηsolution = ηisooctane(1 + [η]C) | (12) |
where
ηsolution and
ηisooctane are the viscosities of the solution and isooctane respectively, [
η] is the intrinsic viscosity and
C is the concentration of AOT (in g cm
−3). For AOT in heptane [
η] = 3.01 cm
3 g
−1 at 298 K.
39 Assuming the same value of [
η] in isooctane, the value of
ηsolution was calculated to be 0.52 cP for a 25 mM AOT solution.
As we increase W0, the focal volume may change due to the variation in the refractive index. This change in the refractive index was corrected by adjusting the objective collar position. The position was varied from 0.17 for W0 = 10 to a maximum of 0.15 for W0 = 46 in order to keep the focal volume fixed for all of the samples.
3. Results and discussion
Fig. 1 shows the absorption and emission spectra of free TMR and TMR tagged HSA in 50 mM phosphate buffer, pH 7.4. The absorption maximum of pure TMR in phosphate buffer is at 550 nm. Upon excitation at 540 nm, TMR gives an emission maximum at 571 nm in phosphate buffer. When TMR is tagged with HSA, both the absorption and the emission maxima remain almost unchanged with final values of 552 nm and 574 nm, respectively. We also have checked that the structure of HSA does not change significantly upon tagging with TMR by circular dichroism spectroscopy as shown in Fig. S1a of the ESI.†
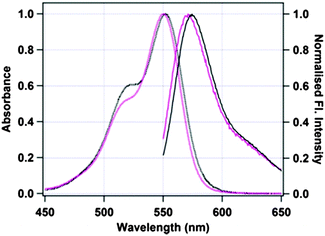 |
| | Fig. 1 Absorption (dotted lines) and emission (solid lines) spectra of untagged TMR (black) and TMR tagged to Cys-34 of HSA (pink). | |
The goal of the present work is to study the conformational fluctuation dynamics of domain-I of HSA in a confined environment and to see the effect of temperature in this environment. For this purpose we confined TMR labeled HSA inside AOT reverse micelles with variable water content and size (W0 = 20 to W0 = 46). First we have confirmed through CD spectra that the encapsulation of HSA inside the reverse micelle does not induce significant alteration in the protein structure (see Fig. S1b of the ESI†). Only a small change of ∼4% α-helicity has been observed for HSA when confined in the water-pool of an AOT reverse micelle of W0 = 20. Naturally we have assumed that the confinement effect will be similar or even less for larger water-pools. Thus we confirm that any change in the conformational dynamics of HSA inside the water-pool would be solely due to the confinement effect.
The fluorescence autocorrelation curve of TMR-HSA in phosphate buffer is shown in Fig. S2 of the ESI,† which was best fitted with eqn (6), which has a conformational fluctuation term along with one diffusion component. The values of τD and τR obtained from the fitting are 226 μs and 26.9 μs, respectively, which is similar to our previously reported data.8 Following our previous assignment, the 26.9 μs component is assigned to the time scale of the conformational fluctuation dynamics of domain-I of HSA that arises from the time dependent quenching of TMR fluorescence by some amino acid residues due to protein fluctuation.
Next, we have recorded the time autocorrelation of the TMR tagged HSA inside the water-pool of AOT reverse micelles with varying sizes. The autocorrelation curves for AOT encapsulated HSA look significantly different from the one in pure buffer solution (a comparison of the time autocorrelation curves for W0 = 25 and 46, and in bulk buffer as shown in Fig. S2 of the ESI†). A single component diffusion model (eqn (5)) was first attempted to fit the experimental autocorrelation curves of the reverse micellar systems. But it returned a bad fitting residual and the quality of the fit was also considerably bad for all W0 values. Consequently, we tried eqn (6), which incorporates a conformational fluctuation term along with one diffusion component, to fit the data. Although this modified equation fits the autocorrelation curve for HSA in pure buffer solution quite well, the fitting in the case of HSA inside the water-pool of an AOT reverse micelle is still found to be unsatisfactory. As already discussed, AOT reverse micelles are not monodisperse in nature.39 They follow a definite size distribution which varies as W0 changes. The diffusion time, which is actually the diffusion time of the whole reverse micelle here, will definitely not be single valued and is likely to follow a distribution. Hence we tried using a Gaussian distribution model for the diffusion time as reported by Pal et al.39 However, this model also fails to deliver a satisfactory fitting. Then it strikes us that the proteins are incorporated within AOT reverse micelles and the conformational dynamics may depend on the reverse micellar size. As the size follows a distribution, the conformational fluctuation time is also likely to follow a distribution. Considering this, when we introduced a Gaussian distribution into the conformational fluctuation time along with a distribution in the diffusion time (as in eqn (7)), it returned a good fitting for the autocorrelation curves of HSA in the water-pool of AOT reverse micelles. A comparison of all of these fitting results for W0 = 25 is shown in Fig. 2. For other W0 values, the fittings are shown in Fig. S3 of the ESI.† Evidently, the residual and the fit are best in the case of one relaxation component and one diffusion component both having a Gaussian type of distribution. This indicates that reverse micelles formed by AOT in isooctane are not monodisperse, which is already reported in the literature.39 To validate the observation of the protein fluctuation time we have done a control experiment, where, un-tagged HSA along with Rhodamine 6G was incorporated into the water-pool of an AOT reverse micelle of W0 = 25. In this control experiment the protein fluctuation time component is found to be almost negligible and the data could be fitted satisfactorily with a distributed diffusion model (see inset of Fig. 2). This vividly confirmed the observation of the protein fluctuation time in the present experiment. We have observed a regular change in the fluorescence autocorrelation with an increase in the W0 value of the AOT reverse micelle as shown in Fig. 3. There is a monotonic increase in the peak diffusion time with an increasing W0 value as expected, which is shown in Fig. 4a. At W0 = 20 (rw = 3.5 nm) the peak τD value is found to be 218 μs, which increases to 456 μs for a larger reverse micelle with W0 = 46 (rw = 7.0 nm). The hydrodynamic radius of the reverse micelle in each case is calculated from the peak value of the Gaussian distribution for the diffusion component (τD) using eqn (10) and (11) and is tabulated in Table 1. The regular increase in the peak value of τD indicates the increase in the hydrodynamic radius, thus the size of the water pool, as this τD corresponds to the reverse micelle as a whole, not the individual HSA molecule in it. Fig. 4b shows the calculated hydrodynamic radii of the AOT reverse micelles and a comparison with the already reported values of hydrodynamic radii.39
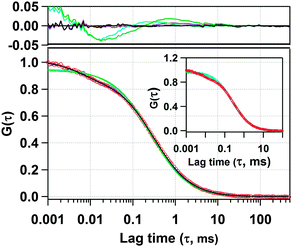 |
| | Fig. 2 Experimental fluorescence autocorrelation curve of TMR tagged HSA in the water-pool of an AOT reverse micelle (W0 = 25) and its fitting with (i) 1 diffusion model (green line), (ii) 1 diffusion + 1 conformational relaxation component model (violet line), (iii) Gaussian distribution on diffusion model (cyan line), (iv) Gaussian distribution on diffusion + 1 conformational relaxation component model (brown line), and (v) Gaussian distribution on diffusion + Gaussian distribution on conformational relaxation component model (black line). The upper panel shows the residuals of the corresponding fits. In the inset, a comparison of the fluorescence autocorrelation is shown between TMR tagged HSA in the water-pool of an AOT reverse micelle (W0 = 25) and untagged HSA along with Rhodamine 6G in the water-pool of an AOT reverse micelle (W0 = 25). | |
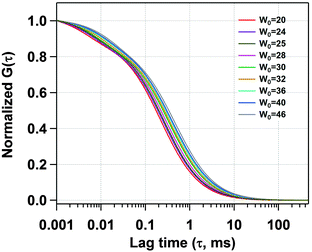 |
| | Fig. 3 Normalized fits of the fluorescence autocorrelation curves of TMR tagged HSA in AOT reverse micelles with increasing W0. | |
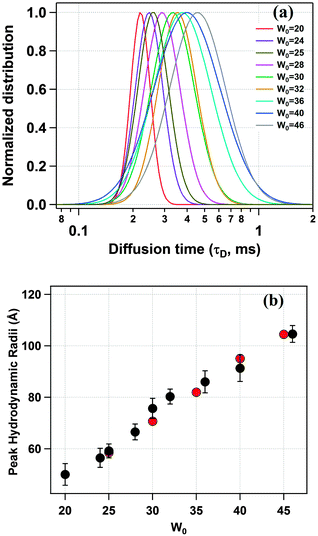 |
| | Fig. 4 (a) Distribution of the diffusion time (τD) of TMR tagged HSA for different water pool sizes. (b) Variation of the hydrodynamic radius of the AOT reverse micelles with increasing water pool size (black) as estimated from the peak τD values along with the reported values of the hydrodynamic radii (red) in reference Anal. Chem. 2011, 83, 7736–7744. | |
Table 1 Fitting results of the fluorescence autocorrelation curves of TMR tagged HSA in the water-pool of AOT reverse micelles of varying sizes at 298 K
|
W
0
|
Peak value of diffusion time, τD (μs) |
Peak value of conformational fluctuation time, τR (μs) |
Hydrodynamic radius (nm) and FWHM (nm) |
Reported hydrodynamic radius (nm) and FWHM (nm)38 |
| 20 |
218 |
4.3 |
5.00 (4.06) |
— |
| 24 |
246 |
5.8 |
5.64 (5.71) |
— |
| 25 |
258 |
6.3 |
5.91 (6.35) |
5.85 (6.25) |
| 28 |
290 |
6.9 |
6.65 (7.41) |
— |
| 30 |
330 |
7.6 |
7.57 (5.69) |
7.07 (7.27) |
| 32 |
350 |
9.2 |
8.03 (8.00) |
— |
| 35 |
— |
— |
— |
8.20 (8.37) |
| 36 |
375 |
10.2 |
8.60 (11.88) |
— |
| 40 |
498 |
12.3 |
9.13 (13.72) |
9.51 (8.85) |
| 45 |
— |
— |
— |
10.45 (10.61) |
| 46 |
456 |
15.9 |
10.46 (11.58) |
— |
| Bulk |
226 |
26.9 |
|
|
As is evident from Fig. 4b, the present values of the hydrodynamic radii are in quite good agreement with the reported values.39 This in turn suggests that the well defined water-pool of AOT reverse micelles does not get affected by the incorporation of HSA.
Fig. 5a shows the distribution of the conformational relaxation time (τR) for domain I of HSA confined in different sized water-pools of AOT reverse micelles. The peak value of the Gaussian distribution of τR in the case of a confined system is found to be much lower as compared to the value in bulk buffer. In a reverse micelle with W0 = 20 (rw = 3.5 nm) this value is 4.3 μs. The reason for this difference is attributed to the confinement of the protein. The protein inside the water-pool is under constrained conditions and hence the movement of the side chains is restricted as compared to that in bulk, where there is no restriction on the breathing motion for the protein. Because of this confinement, the quencher molecules could not diffuse far away from the fluorescent dye because of less available space and hence they travel less distance for the breathing motion. This results in a low value of τR. Further, as we increase the W0 value, τR also increases uniformly and becomes 15.9 μs for W0 = 46 (rw = 7.0 nm), which is shown in Fig. 5b. This regular increment is in line with our expectations and is ascribed to the increment in the water pool size of the reverse micelle, which gives the protein side chain more free space for movement. The value of τR approaches the bulk value of 26.9 μs but due to experimental constraints we could not reach that point.
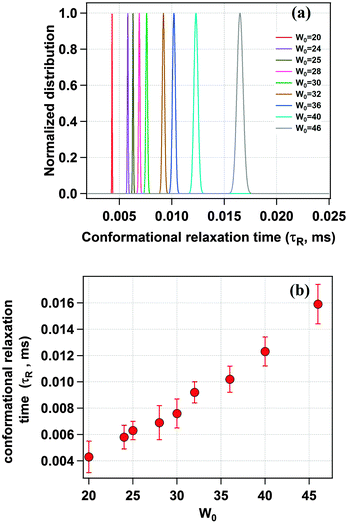 |
| | Fig. 5 (a) Distribution of the conformational relaxation time (τR) of TMR tagged HSA for different water-pool sizes. (b) Change in the conformational relaxation time (τR) with increasing water-pool size of the AOT reverse micelle. | |
Next we have studied the effect of temperature on HSA inside an AOT reverse micelle in the range of 298–313 K. We have restricted our study to the above temperature range as it is known that the AOT reverse micellar system remains unchanged in this temperature region.45 In this temperature range the conformational fluctuation time of domain-I of HSA in bulk buffer medium was found to be unaltered (see Fig. S4 of the ESI† for the autocorrelation curves and Fig. 6 and Table 2 for the data). However, when HSA is present in the water-pool of the AOT reverse micelle the fluctuation time was found to increase as the temperature was increased. For W0 = 20 (rw = 3.5 nm), the τR value was increased from 4.3 μs at 298 K to 7.8 μs at 313 K (see Fig. S5 of the ESI† for the autocorrelation curves and Fig. 6 and Table 2 for the data). An 81% increase in the fluctuation time has been observed in this case. On increasing the size of the water-pool to W0 = 25 (rw = 4.3 nm)44 and W0 = 30 (rw = 5.1 nm),44 the effect of temperature on the conformational fluctuation dynamics decreases gradually compared to W0 = 20. At W0 = 25 the fluctuation time increases from 6.3 μs at 298 K to 9.4 μs at 313 K with an increase of ∼49%. At W0 = 30 there is only ∼31% increase in fluctuation time on increasing the temperature from 298 K (7.8 μs) to 313 K (9.7 μs). The normalized autocorrelation curves for W0 = 20, W0 = 25 and W0 = 30 are shown in Fig. S5–S7 of the ESI.† However, as mentioned, even for larger water-pools the effect of temperature is large compared to in bulk water, where a negligible increase in the fluctuation time was observed for the present temperature range (see Fig. 7). The higher temperature dependence of the conformational fluctuation time of HSA inside the water-pool compared to in bulk medium is surprising because inside the water-pool the motion of the protein is restricted, and it is expected that the temperature induced fluctuation will be much smaller inside the water-pool than in the bulk medium. Thus we expected a smaller change in the conformational fluctuation time with an increase in temperature in the water-pool than in bulk. The observed opposite trend in the temperature dependence casts doubt on the general belief of imposed rigidity in macromolecules upon confinement. This startling behaviour either can stem from the altered nature of the confined protein itself or can arise due to the significantly different behaviour of confined water as compared to bulk water.46,47 For proteins in solution, two different types of water have been proposed. Water molecules that make a stronger hydrogen bond with proteins known as “bound water” and the other type of water moleules, which make hydrogen bonds among themselves known as “free water”.48 It is now well established that this “bound water” is responsible for the slow solvation dynamics in proteins and helps the protein to retain its native functional structure under small perturbations.48–50 Once the “bound water” detaches from the protein it becomes “free water” and vice versa. It has been recognized that this bound–free exchange has an intrinsic activation energy barrier.51 For bovine serum albumin (BSA) in bulk water it is ∼20 kcal mol−1.52 This energy is considerably high and at room temperature the exchange cannot be achieved without any external stimuli. We have already shown that the fluctuation time of domain-I of human serum albumin (HSA), having a very similar structure to that of BSA, in buffer responds to thermal agitation only at >323 K.8 This can be attributed to the availability of the activation energy required for the bound to free exchange. On the other hand, the large amplitude motion or fluctuation in proteins may also be associated with the bound–free exchange as in this case the micro-environment of the protein changes with time. As already discussed, the nature of water inside the water-pool of a reverse micelle is different from that of bulk water.46,47 Thus, it is very likely that the transition of protein bound water to the water-pool confined water will not be the same as in bulk solution. Considering the experimental results, we suggest that the corresponding activation energy inside AOT reverse micelles is less than that in bulk water, at least in the experimental range. With an increase in temperature, the bound to free water transition is facilitated and the hydrogen bond network is broken; hence the protein can breathe more freely, showing a larger fluctuation time. With the increase in reverse micellar size, the properties of the confined water in the water-pool start approaching those of bulk water and thus the effect of temperature decreases monotonically. The possibility of protein hydration under similar conditions has also been concluded in the literature.53–55 Pal and co-workers reported that the protein is more hydrated at elevated temperatures due to the transition of the surface bound water to free water.54 Lucent et al. delineated that when a protein is under confinement, it does not reach the exact denatured structure of that in bulk conditions, rather it reaches a different unfolded state.55 They attributed this irregularity mainly to the confined solvent effect. In our case the observed prominent thermal effect on the conformational dynamics of domain-I of HSA in the water-pool of an AOT reverse micelle as compared to in bulk medium may arise due to the confined solvent effect, although we can not rule out the effect of the geometrical restriction of the protein towards our observation. Thus at this point we can not address this startling behaviour in a confirmed way. We look forward to further investigation to validate the actual reason for this mystifying behaviour.
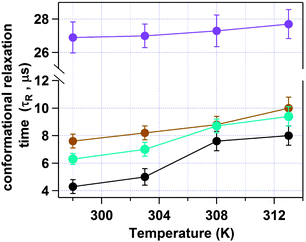 |
| | Fig. 6 Change in the conformational fluctuation time (τR) of domain-I of HSA with temperature in bulk buffer (violet), and inside the water-pool of an AOT reverse micelle of W0 = 20 (black), W0 = 25 (sky blue) and W0 = 30 (brown). | |
Table 2 Data for the temperature dependence of the conformational relaxation time of domain-I of HSA inside the water-pool of AOT reverse micelles of W0 = 20, 25 and 30 and in a bulk buffer medium
| Temperature (K) |
τ
R of domain-I of HSA inside |
| AOT reverse micelle W0 = 20 (μs) |
AOT reverse micelle W0 = 25 (μs) |
AOT reverse micelle W0 = 30 (μs) |
Buffer (μs) |
| 298 |
4.3 |
6.3 |
7.6 |
26.9 |
| 303 |
5.0 |
7.0 |
8.2 |
27.0 |
| 308 |
7.3 |
8.7 |
8.8 |
25.9 |
| 313 |
7.8 |
9.4 |
10.0 |
27.7 |
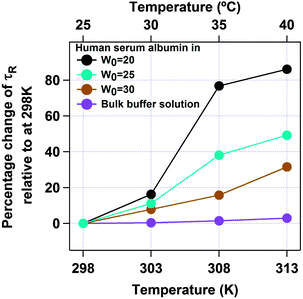 |
| | Fig. 7 Percentage change in the conformational fluctuation time (τR) of domain-I of HSA with temperature for bulk buffer (violet), and inside the water-pool of an AOT reverse micelle of W0 = 20 (black), W0 = 25 (sky blue) and W0 = 30 (brown). | |
4. Conclusion
The present study elucidates the nature of the conformational fluctuation dynamics of domain-I of human serum albumin (HSA) when confined inside the water-pool of AOT reverse micelles. Fluorescence correlation spectroscopy was used and domain-I of HSA was labelled with the fluorescent probe tetramethylrhodamine-5-maleimide for this purpose. It is shown that the dynamics vary significantly under confinement compared to in bulk medium. As the size of the water-pool increases, the fluctuation time is found to increase monotonically. The effect of temperature on the conformational fluctuation of domain-I of HSA also differs inside the water-pool as compared to in bulk medium. In bulk, the measured fluctuation time is found to remain the same up to 313 K, however, inside the water-pool of AOT reverse micelles we have observed an increase in the fluctuation time beyond 303 K. This unexpected behaviour raises questions about the general belief of there being imposed rigidity in macromolecules upon confinement.
Acknowledgements
B.S. thanks Council of Scientific and Industrial Research (CSIR, Government of India) and R.Y. thanks University Grants Commission (UGC, Government of India) for fellowships. This work is financially supported by SERB, Government of India (Project No. SR/S1/PC-08/2011).
References
- M. Karplus and J. Kuriyan, Proc. Natl. Acad. Sci. U. S. A., 2005, 102, 6679–6685 CrossRef CAS PubMed.
-
G. A. Petsko and D. Ringe, Protein Structure and Function: Primers in Biology, New Science Press Ltd, 2004 Search PubMed.
- L. Q. Yang, P. Sang, Y. Tao, Y. X. Fu, K. Q. Zhang, X. H. Xie and S. Q. Liu, J. Biomol. Struct. Dyn., 2014, 32, 372–393 CAS.
- M. Orozco, Chem. Soc. Rev., 2014, 43, 5051–5066 RSC.
- G. Krishnamoorthy, Curr. Sci., 2012, 2, 266–276 Search PubMed.
- H. Neuweiler, W. Banachewicz and A. R. Fersht, Proc. Natl. Acad. Sci. U. S. A., 2010, 107, 22106–22110 CrossRef CAS PubMed.
- K. Chattopadhyay, E. L. Elson and C. Frieden, Proc. Natl. Acad. Sci. U. S. A., 2005, 102, 2385–2389 CrossRef CAS PubMed.
- R. Yadav, B. Sengupta and P. Sen, J. Phys. Chem. B, 2014, 118, 5428–5438 CrossRef CAS PubMed.
- D. K. Sasmal, T. Mondal, S. S. Mojumdar, A. Choudhury, R. Banerjee and K. Bhattacharyya, J. Phys. Chem. B, 2011, 115, 13075–13083 CrossRef CAS PubMed.
- S. S. Mojumdar, R. Chowdhury, S. Chattoraj and K. Bhattacharyya, J. Phys. Chem. B, 2012, 116, 12189–12198 CrossRef.
- M. Gruebele, J. Am. Chem. Soc., 2014, 136, 16695–16697 CrossRef CAS PubMed.
- D. B. Good, S. Wang, M. E. Ward, J. Struppe, L. S. Brown, J. R. Lewandowski and V. Ladizhansky, J. Am. Chem. Soc., 2014, 136, 2833–2842 CrossRef CAS PubMed.
- H. Yang, G. Luo, P. Karnchanaphanurach, T. M. Louie, I. Rech, S. Cova, L. Xun and X. S. Xie, Science, 2003, 302, 262–266 CrossRef CAS PubMed.
- D. Langosch and I. T. Arkin, Science, 2009, 18, 1343–1358 CAS.
- P. Gollapalli and M. Hanumanthappa, Int. J. Comput. Biol., 2015, 4, 31–45 Search PubMed.
- D. Li, M. S. Liu and B. Ji, Biophys. J., 2015, 109, 647–660 CrossRef CAS PubMed.
- D. Li, B. Ji, K. Hwang and Y. Huang, J. Phys. Chem. B, 2010, 114, 3060–3069 CrossRef CAS.
- A. V. Martinez, S. C. DeSensi, L. Dominguez, E. Rivera and J. E. Straub, J. Chem. Phys., 2011, 134, 055107 CrossRef PubMed.
- C. Nicot and M. Waks, Biotechnol. Genet. Eng. Rev., 1995, 13, 267–314 CrossRef.
- C. J. Roche, D. Dantsker, E. R. Heller, J. E. Sabat and J. M. Friedman, Chem. Phys., 2013, 422, 88–97 CrossRef CAS PubMed.
- T. S. Ulmer and A. Bax, J. Biol. Chem., 2005, 280, 43179–43187 CrossRef CAS PubMed.
- P. S. W. Yeung, G. GözdeEskici and P. H. Axelsen, Biochim. Biophys. Acta, 2013, 1828, 2314–2318 CrossRef CAS PubMed.
- H. Murakami, Y. Toyota, T. Nishi and S. Nashima, Chem. Phys. Lett., 2012, 519–520, 105–109 CrossRef CAS.
- E. P. Melo, P. Fojan, J. M. S. Cabral and S. B. Petersen, Chem. Phys. Lipids, 2000, 106, 181–189 CrossRef CAS PubMed.
- A. Malik, J. Kundu, S. Karmakar, S. Lai and P. K. Chowdhury, J. Lumin., 2015, 167, 316–326 CrossRef CAS.
- G. R. Burnett, G. D. Rees, D. C. Steytler and B. H. Robinson, Colloids Surf., A, 2004, 250, 171–178 CrossRef CAS.
- H. Neuweiler, C. M. Johnson and A. R. Fersht, Proc. Natl. Acad. Sci. U. S. A., 2009, 106, 18569–18574 CrossRef CAS PubMed.
- H. P. Lu, Acc. Chem. Res., 2005, 38, 557–565 CrossRef CAS PubMed.
- S. Weiss, Nat. Struct. Biol., 2000, 7, 724–729 CrossRef CAS PubMed.
- M. Nag, K. Bera, S. Chakraborty and S. Basak, J. Photochem. Photobiol., B, 2013, 127, 202–211 CrossRef CAS PubMed.
- J. Jung, R. Ihly, E. Scott, M. Yu and A. V. Orden, J. Phys. Chem. B, 2008, 112, 127–133 CrossRef CAS PubMed.
- H. Chen, E. Rhoades, J. S. Butler, S. N. Loh and W. W. Webb, Proc. Natl. Acad. Sci. U. S. A., 2007, 104, 10459–10464 CrossRef CAS PubMed.
- V. C. Ducas and E. Rhoades, PLoS One, 2014, 9, e86983 Search PubMed.
- X. M. He and D. C. Carter, Nature, 1992, 358, 209–215 CrossRef CAS PubMed.
- P. Mazumder, J. E. Suk and T. S. Ulmer, J. Phys. Chem. B, 2013, 117, 11448–11459 CrossRef CAS PubMed.
- G. Kwon, A. E. Remmers, S. Datta and R. R. Neubig, Biochemistry, 1993, 32, 2401–2408 CrossRef CAS PubMed.
- A. V. Martinez, L. Dominguez, E. Małolepsza, A. Moser, Z. Ziegler and J. E. Straub, J. Phys. Chem. B, 2013, 117, 7345–7351 CrossRef CAS.
- G. B. Dutt, J. Phys. Chem. B, 2008, 112, 7220–7226 CrossRef CAS PubMed.
- N. Pal, S. D. Verma, M. K. Singh and S. Sen, Anal. Chem., 2011, 83, 7736–7744 CrossRef CAS PubMed.
- R. Wang, S. Sun, E. J. Bekos and F. V. Bright, Anal. Chem., 1995, 67, 149–159 CrossRef CAS PubMed.
- J. Ries and P. Schwille, Bioassays, 2012, 34, 361–368 CrossRef PubMed.
- E. L. Elson, Methods Enzymol., 2013, 518, 11–41 CAS.
- C. B. Müller, A. Loman, V. Pacheco, F. Koberling, D. Willbold, W. Richtering and J. Enderlein, Europhys. Lett., 2008, 83, 46001 CrossRef.
- A. Maitra, J. Phys. Chem., 1984, 88, 5122–5125 CrossRef CAS.
- R. K. Mitra, S. S. Sinha and S. K. Pal, Langmuir, 2008, 24, 49–56 CrossRef CAS PubMed.
- N. E. Levinger, Science, 2002, 298, 1722–1723 CrossRef CAS PubMed.
- T. L. Spehr, B. Frick, M. Zamponi and B. Stühn, Soft Matter, 2011, 7, 5745–5755 RSC.
- N. Nandi, K. Bhattacharyya and B. Bagchi, Chem. Rev., 2000, 100, 2013–2045 CrossRef CAS PubMed.
- S. K. Pal, J. Peon and A. H. Zewail, Proc. Natl. Acad. Sci. U. S. A., 2002, 99, 1763–1768 CrossRef CAS PubMed.
- S. K. Pal and A. H. Zewail, Chem. Rev., 2004, 104, 2099–2123 CrossRef CAS PubMed.
-
K. L. Han and G. J. Zhao, Hydrogen bonding and transfer in the excited state, John Wiley & Sons., 2011 Search PubMed.
- M. Bokor, V. Csizmók, D. Kovács, P. Bánki, P. Friedrich, P. Tompa and K. Tompa, Biophys. J., 2005, 88, 2030–2037 CrossRef CAS PubMed.
- S. Mukherjee, P. Chowdhury and F. Gai, J. Phys. Chem. B, 2006, 110, 11615–11619 CrossRef CAS PubMed.
- S. Rakshit, R. Saha and S. K. Pal, J. Phys. Chem. B, 2013, 117, 11565–11574 CrossRef CAS PubMed.
- D. Lucent, V. Vishal and V. S. Pande, Proc. Natl. Acad. Sci. U. S. A., 2007, 104, 10430–10434 CrossRef CAS.
Footnotes |
| † Electronic supplementary information (ESI) available. See DOI: 10.1039/c6cp00452k |
| ‡ Present address: Department of Chemistry, Bowling Green State University, USA. |
|
| This journal is © the Owner Societies 2016 |
Click here to see how this site uses Cookies. View our privacy policy here.  Open Access Article


![[thin space (1/6-em)]](https://www.rsc.org/images/entities/char_2009.gif) :
:![[thin space (1/6-em)]](https://www.rsc.org/images/entities/char_2009.gif) 3.5. The mixture was then stirred gently at room temperature for about 10 h. To remove the unreacted dye, the reaction mixture was dialysed against 500 ml of 1
3.5. The mixture was then stirred gently at room temperature for about 10 h. To remove the unreacted dye, the reaction mixture was dialysed against 500 ml of 1![[thin space (1/6-em)]](https://www.rsc.org/images/entities/char_2009.gif) :
:![[thin space (1/6-em)]](https://www.rsc.org/images/entities/char_2009.gif) 35 DMSO
35 DMSO![[thin space (1/6-em)]](https://www.rsc.org/images/entities/char_2009.gif) :
:![[thin space (1/6-em)]](https://www.rsc.org/images/entities/char_2009.gif) buffer mixture at 4 °C. The dialysis solution was replaced 4 times at intervals of 12 h. Then the solution was replaced with pure phosphate buffer (50 mM, pH 7.4) several times during the next 6–8 days. The dialysis solution was checked each time for fluorescence. Dialysis was finally stopped when the dialysis solution was found to be totally free of any dye. The HSA
buffer mixture at 4 °C. The dialysis solution was replaced 4 times at intervals of 12 h. Then the solution was replaced with pure phosphate buffer (50 mM, pH 7.4) several times during the next 6–8 days. The dialysis solution was checked each time for fluorescence. Dialysis was finally stopped when the dialysis solution was found to be totally free of any dye. The HSA![[thin space (1/6-em)]](https://www.rsc.org/images/entities/char_2009.gif) :
:![[thin space (1/6-em)]](https://www.rsc.org/images/entities/char_2009.gif) TMR ratio in the final solution was estimated to be 1
TMR ratio in the final solution was estimated to be 1![[thin space (1/6-em)]](https://www.rsc.org/images/entities/char_2009.gif) :
:![[thin space (1/6-em)]](https://www.rsc.org/images/entities/char_2009.gif) 0.6 from the known value of molar extinction coefficients (for HSA ε280 = 36
0.6 from the known value of molar extinction coefficients (for HSA ε280 = 36![[thin space (1/6-em)]](https://www.rsc.org/images/entities/char_2009.gif) 500 M−1 cm−1 and for TMR ε555 = 75
500 M−1 cm−1 and for TMR ε555 = 75![[thin space (1/6-em)]](https://www.rsc.org/images/entities/char_2009.gif) 000 M−1 cm−1).8,36 The concentration of HSA was maintained at 40 nM in the bulk phase as well as in the water-pool of the reverse micelle. AOT reverse micelles of different water-pool sizes were prepared by injecting the required amount of protein sample into a 25 mM solution of AOT in iso-octane. All the experiments were done at 298 ± 1 K if not stated otherwise.
000 M−1 cm−1).8,36 The concentration of HSA was maintained at 40 nM in the bulk phase as well as in the water-pool of the reverse micelle. AOT reverse micelles of different water-pool sizes were prepared by injecting the required amount of protein sample into a 25 mM solution of AOT in iso-octane. All the experiments were done at 298 ± 1 K if not stated otherwise.
![[thin space (1/6-em)]](https://www.rsc.org/images/entities/char_2009.gif) 000 − 4000) where MRE208nm is the mean residual elipticity at 208 nm, which is defined as MRE208nm = (α208nmM)/(ncl) where α208nm is the CD signal at 208 nm, M is the molecular weight of HSA, n is the total number of amino acid residues in the protein, l is the path length and c is the concentration of protein in grams per liter.8
000 − 4000) where MRE208nm is the mean residual elipticity at 208 nm, which is defined as MRE208nm = (α208nmM)/(ncl) where α208nm is the CD signal at 208 nm, M is the molecular weight of HSA, n is the total number of amino acid residues in the protein, l is the path length and c is the concentration of protein in grams per liter.8


