
 Open Access Article
 This Open Access Article is licensed under a
 Creative Commons Attribution 3.0 Unported Licence
NMR reveals the surface functionalisation of Ti3C2 MXene†
Michael A.
Hope
a,
Alexander C.
Forse
a,
Kent J.
Griffith
a,
Maria R.
Lukatskaya
b,
Michael
Ghidiu
b,
Yury
Gogotsi
*b and
Clare P.
Grey
*a
aDepartment of Chemistry, University of Cambridge, Lensfield Road, Cambridge CB2 1EW, UK
bDepartment of Materials Science and Engineering, and A. J. Drexel Nanomaterials Institute, Drexel University, Philadelphia, PA 19104, USA. E-mail: gogotsi@drexel.edu; cpg27@cam.ac.uk
First published on 21st January 2016
Abstract
1H and 19F NMR experiments have identified and quantified the internal surface terminations of Ti3C2Tx MXene. –F and –OH terminations are shown to be intimately mixed and there are found to be significantly fewer –OH terminations than –F and –O, with the proportions highly dependent on the synthesis method.
MXenes are a novel class of two-dimensional transition metal carbides and nitrides1,2 which have garnered much interest for applications in lithium-ion3 and Li–S4 batteries, supercapacitors,5 selective adsorption of heavy ions,6 and dual response systems.7 They are synthesised by etching the ‘A’ element out of the corresponding MAX phase; for example, the most widely studied MXene, and that which this work is based on, Ti3C2, is produced by etching Al out of Ti3AlC2 (Fig. 1a).
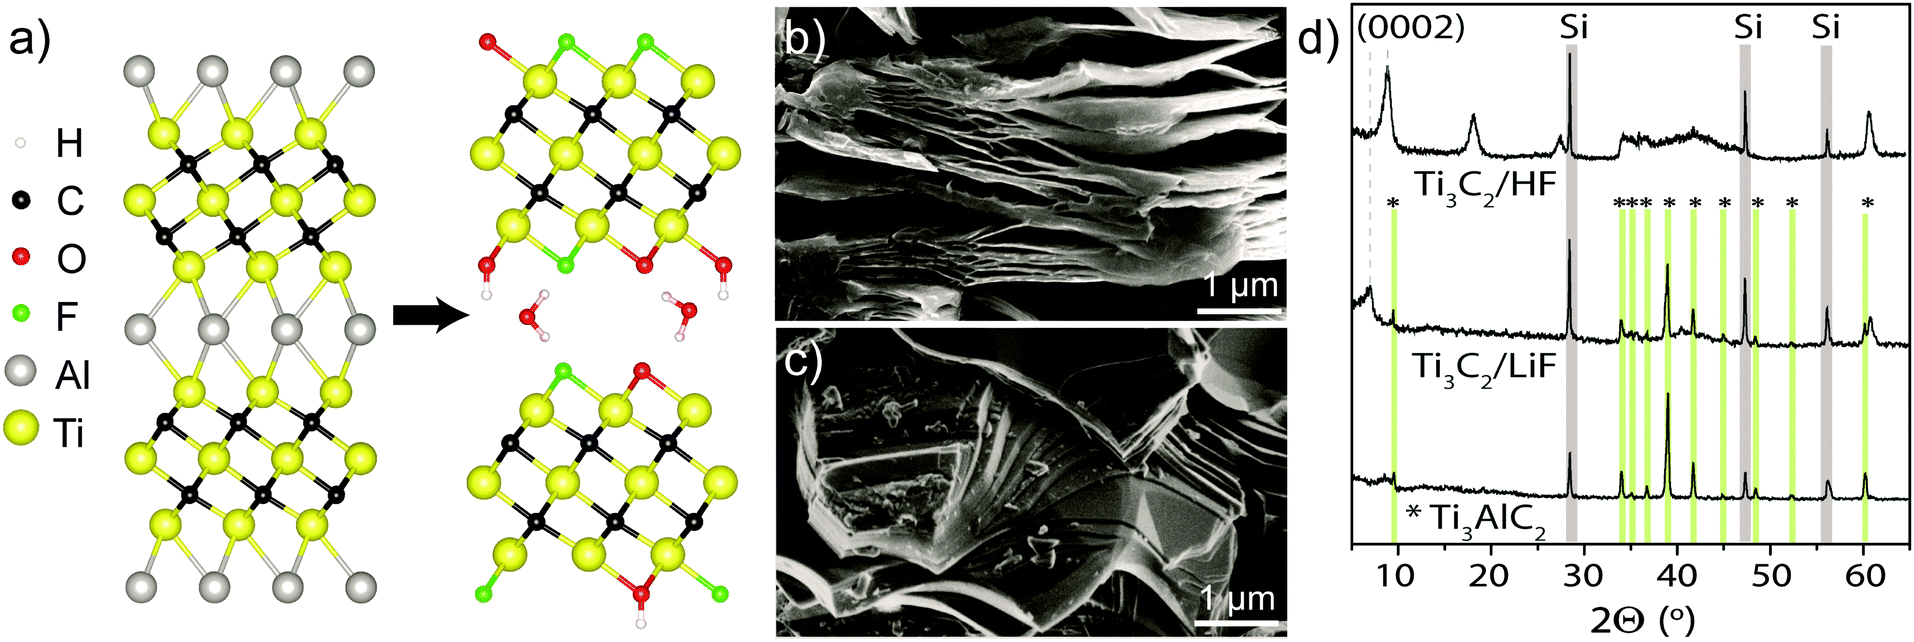 | ||
| Fig. 1 (a) Schematic of etching from Ti3AlC2 to Ti3C2Tx showing terminations and interlayer water. Typical SEM micrographs of (b) HF-etched Ti3C2Tx, showing accordion-like structure and (c) LiF–HCl etched Ti3C2Tx, with a more compact structure. (d) XRD patterns of Ti3AlC2 and Ti3C2Tx etched with HF or LiF–HCl. Green vertical lines denote the presence of MAX phase peaks, and grey regions are peaks from crystalline Si 10 wt% internal standard. | ||
Aqueous etching of Al does not leave bare Ti layers, but they are instead terminated with functional groups (T), with the material then referred to as Ti3C2Tx. X-ray photoelectron spectroscopy (XPS) experiments have indicated the presence of –O, –OH and –F terminations3,8 and energy-dispersive X-ray spectroscopy (EDS) has been used to quantify their proportions;2,9,10 however, EDS cannot distinguish between –O and –OH and typically all oxygen is assumed to be present as –OH. The analysis is further complicated by the presence of interlayer water and etching by-products, such as fluoride salts, that are often spuriously included in the signals assigned to surface termination.
In many studies it has been necessary either to assume average site occupancies for the functional groups, for example to analyse pair distribution functions,9 or to simply use complete termination of one type as assumed for density functional theory (DFT) calculations.2,11–13 Moreover, DFT calculations have suggested that the electronic properties11 and performance of MXenes in lithium-ion batteries12,13 are highly dependent on the surface functionalisation, so a greater understanding is crucial for pursuing the aforementioned applications. It is clear that a more complete understanding of the surface functionalisation of these interesting materials would aid their development for applications.
In this work, nuclear magnetic resonance (NMR) spectroscopy is used to study the surface functionalisation of Ti3C2Tx. NMR is a powerful tool for studying fluorine and hydrogen containing materials due to the high sensitivity of 19F and 1H nuclei,14 and has recently been applied to study another MXene, V2CTx.15 While V2CTx remains the only MXene thus far characterized by NMR, Ti3C2Tx is the most studied MXene and has already demonstrated promise in many applications. In the original procedure, etching was performed with 50% HF solution,2 but more recently a new synthesis has been reported10 using a milder etchant, LiF dissolved in 6 M HCl, which is safer and produces Ti3C2Tx with a lower concentration of defects and a higher volumetric capacitance when used in an aqueous supercapacitor. Samples prepared by the two methods are compared here.
Some differences between the preparations are evident: scanning electron microscopy (SEM) shows that, while HF-etched samples have an accordion-like morphology (Fig. 1b), the samples etched with LiF and HCl mixtures show a more compact structure (Fig. 1c) without visible delaminations. X-ray diffraction (XRD) showed a shift in the (0002) reflection to lower angles (corresponding to a c parameter of ∼25 Å) for LiF–HCl etched samples (Fig. 1d), compared to HF-etched MXene on the order of 19–20 Å. However, there is evidence of small amounts of unreacted Ti3AlC2 in the LiF–HCl etched sample.
These observations correspond well with the 13C NMR data (Fig. 2a) which provides further evidence for the conversion of Ti3AlC2 to Ti3C2Tx (although these spectra are not quantitative, due to the faster transverse relaxation time, T2, of Ti3C2Tx compared to Ti3AlC2). The Ti3AlC2 shows a resonance at 566 ppm with a shoulder at 527 ppm ascribed to TiC remaining from the synthesis.16 For the LiF–HCl synthesised sample, the Ti3AlC2 signal reduces in intensity relative to the TiC signal as Ti3AlC2 is converted to Ti3C2Tx, and a new resonance appears at 412 ppm, attributed to Ti3C2Tx. For the HF synthesis, conversion is complete and the main Ti3C2Tx resonance now appears at 382 ppm, the shift difference being most likely due to a difference in surface functionalisation or stacking. In comparison, the 13C signals in V2AlC and V2CTx were found at lower chemical shifts of 208 ppm and 265 ppm respectively. The larger 13C chemical shifts seen in the Ti system compared to the V system are in part ascribed to larger overlap between Ti and C due to the larger, more diffuse Ti orbitals.
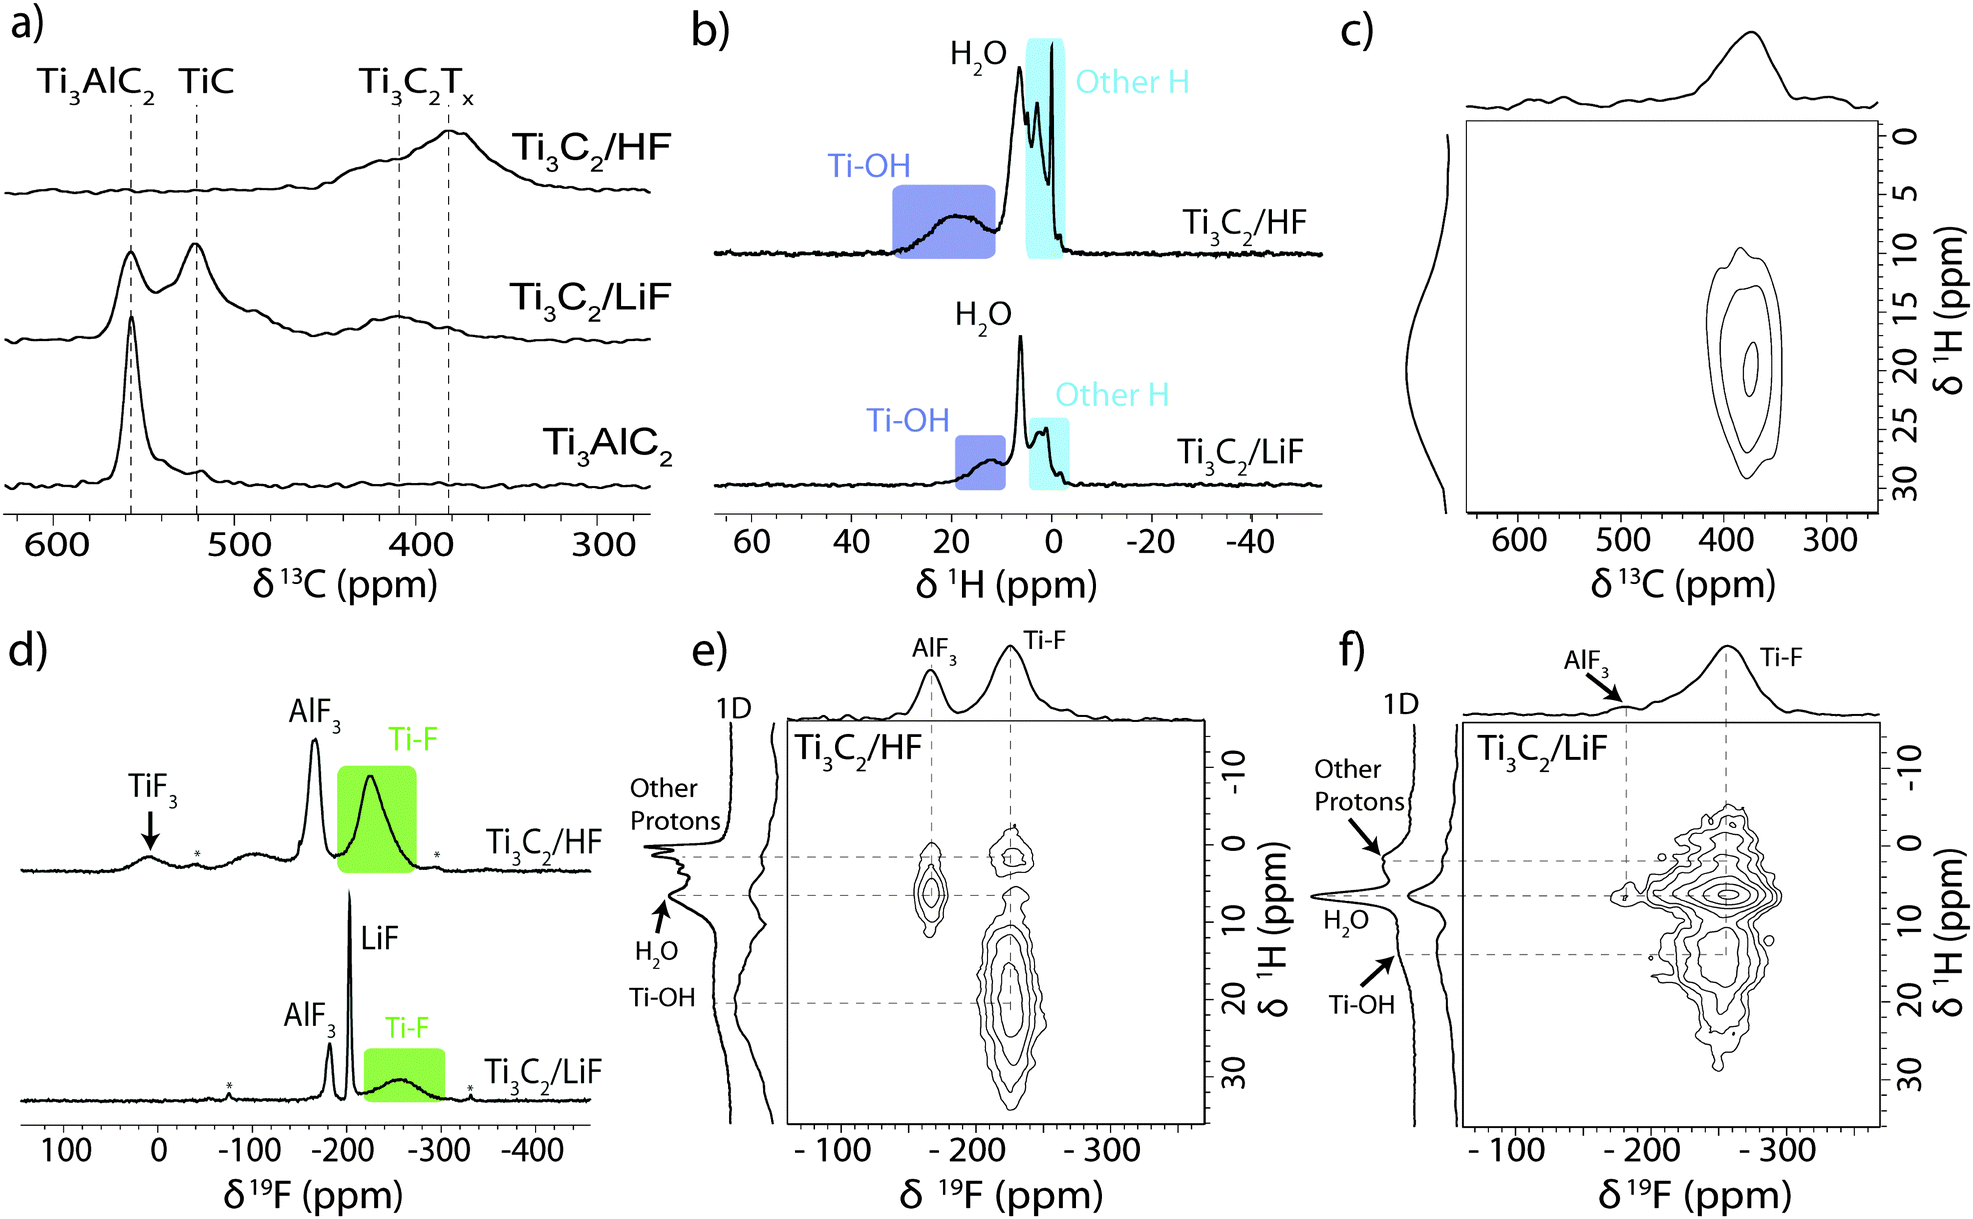 | ||
| Fig. 2 (a) 13C NMR (11.7 T) spectra of Ti3AlC2 and Ti3C2Tx produced by the two methods recorded at 50 kHz MAS using a Carr–Purcell–Meiboom–Gill (CPMG) experiment with the echoes summed to give the conventional lineshape (see ESI†). (b) 1H NMR (11.7 T) spectra of HF and LiF–HCl synthesised Ti3C2 MXene recorded at 60 kHz MAS. (c) 1H–13C HETCOR NMR (7.05 T) spectrum of HF synthesised Ti3C2 MXene recorded at 40 kHz MAS. (d) 19F NMR (11.7 T) spectra of HF and LiF–HCl synthesised Ti3C2 MXene recorded at 60 kHz MAS. 1H–19F HETCOR NMR (11.7 T) spectra of (e) HF and (f) LiF–HCl synthesised Ti3C2 MXene recorded at 20 kHz MAS with adjacent 1D 1H spectra shown for comparison. | ||
Initial 1H NMR experiments on the as-synthesised materials showed only an intense resonance at 6.9 ppm due to water (see ESI†), but after drying at 200 °C in vacuo overnight, different proton environments could be distinguished (Fig. 2b). The HF synthesised sample shows a broad signal at 18.6 ppm with a similar signal seen for the LiF–HCl synthesised sample at 12.5 ppm. These are assigned to –OH terminations with varying degrees of hydrogen bonding. Both 1H spectra also show a feature at 6.5 ppm, ascribed to H2O as its intensity was sensitive to the degree of drying, suggesting that water trapped between the MXene layers cannot be completely removed by vacuum drying at 200 °C. The other proton signals observed between 3 and −1.5 ppm are tentatively assigned to intercalated contaminants as the intensities and chemical shifts were found to vary between different samples.
To confirm the connectivity of the –OH groups to the Ti3C2 sheets, a two-dimensional 1H–13C heteronuclear correlation (HETCOR) spectrum was recorded for the HF synthesised sample (Fig. 2c). These experiments show correlations only for species in close proximity, on the order of angstroms.17 Although the spectrum is broad, the –OH terminations at δ1H ∼20 ppm clearly correlate with the Ti3C2 carbon environment at δ13C ∼380 ppm, confirming the connectivity. The absence of the other 1H signals in this spectrum indicates the environments are further from the carbon layers and/or highly mobile, i.e. intercalants, not surface terminations.
The large 1H chemical shifts in these systems, outside the normal 1H chemical shift range, could arise from three major sources: the Knight shift, due to metallic behaviour; a transferred hyperfine (or Fermi contact) shift due to the transfer of (unpaired) spin density from the Ti layers; and/or strong hydrogen bonding. The prior NMR study on V2CTx, revealed –OH terminations with much larger 1H chemical shifts of 85 ppm, the shifts being ascribed to Knight shifts due to the metallic/low band gap V2CTx.15 A 1H saturation recovery experiment on Ti3C2Tx yielded a T1 relaxation constant of ∼3 s for the –OH signal, whereas hyperfine interactions should cause fast T1 relaxation; in contrast, –OH terminations in V2CTx have T1 ∼ 1 ms. Furthermore, variable temperature 1H NMR experiments performed between −8 and 62 °C showed no appreciable change in chemical shift, as would be expected for a hyperfine shift. The large chemical shift of the –OH terminations in Ti3C2Tx is therefore most likely due to strong hydrogen bonding rather than a hyperfine shift, different H-bonding arrangements being observed for the two samples. However, a small contribution from the Knight shift cannot be ruled out, particularly since the observed chemical shifts are close to the maximum 1H shift observed in strongly H-bonded systems,18 and the presence of large shifts in the 13C NMR spectra, which are likely caused by the Knight shift in metallic Ti3C2Tx.
In the 19F spectra (Fig. 2d), broad signals are observed at −227 ppm in the HF synthesised sample and at −255 ppm in the LiF–HCl synthesised sample, which are assigned to –F terminations. The LiF–HCl synthesised sample also shows residual LiF at −203 ppm19 and the reaction by-product AlF3·nH2O at −181 ppm,20 which could be removed by stirring overnight in water. In the HF synthesised sample, the AlF3·nH2O has shifted to −166 ppm, likely due to differences in hydration; there is a resonance at 8 ppm most probably due to TiF3 produced in the harsher etching conditions (see ESI,† for TiF3 spectrum), and a broad signal at −100 ppm which may be due to a fluorinated hydrocarbon or metal oxyfluoride contaminant. This is very comparable to the V2CTx MXene system where –F terminations are observed at −265 ppm, an AlF3 like species at −158 ppm and a contaminant at −122 ppm.
To explore the arrangement of the different functional groups in space, 1H–19F HETCOR spectra were also recorded (Fig. 2e and f). The correlation between –OH and –F terminations in both samples confirms our spectral assignments and reveals there are mixed terminations within layers, rather than regions terminated by a single type of functional group. The correlation between H2O and –F terminations is indicative of structural water between the layers; the stronger correlation in the LiF–HCl etched sample may suggest the water is less mobile, but further experiments with varied contact times would be required to confirm this. The other 1H signals centred at δ1H = 1 ppm also correlate with the –F resonance, supporting the assertion that these arise from intercalated species and finally, there is H2O and AlF3 correlation due to the hydration of AlF3.
Having identified –OH and –F surface functional groups, their proportions were quantified by spin counting (comparing the signal with that of a known standard), correcting for the mass of known impurities and the percentage conversion of the LiF–HCl synthesised sample as determined by EDS (see ESI†). The fraction of oxygen terminations is then determined by assuming that there are two terminations per formula unit (one per side) and that oxygen comprises the remainder. We further assume that oxygen takes up two sites, because it most likely originated from two –OH groups (–OH + –OH → –O + H2O21) and has a greater negative charge; i.e. the following equation is satisfied: 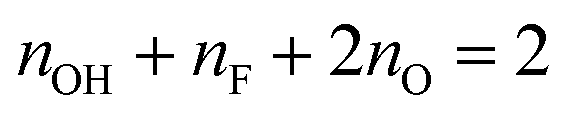 . This yields the following formulae (Fig. 3); the error in the last digit is shown in brackets:
| LiF–HCl synthesis Ti3C2(OH)0.06(2)F0.25(8)O0.84(6) |
| HF synthesis Ti3C2(OH)0.12(2)F0.8(2)O0.54(7) |
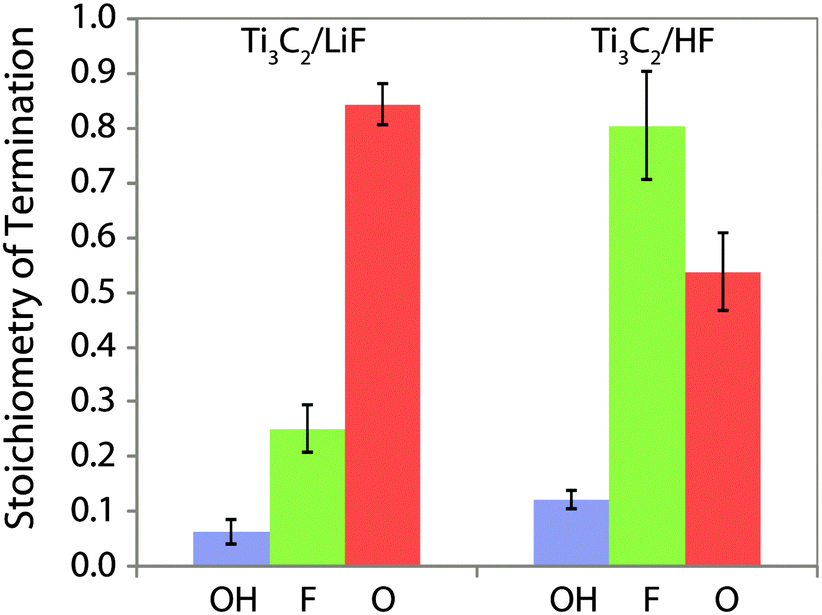 | ||
| Fig. 3 Composition of the Ti3C2Tx surface functional groups produced by etching of the Ti3AlC2 in HF and LiF–HCl solutions, per Ti3C2 formula unit, i.e. Ti3C2(OH)xFyOz. | ||
This reveals that the –OH termination is a relatively minor component, with far more –F and –O present. 2D 1H NMR spectra corroborate this by showing there are no –OH terminations next to –OH terminations (see ESI†) and recent quantitative XPS results8 are also in strong agreement. However, this result differs from the stoichiometries deduced from previous EDS experiments due to their assumption that all oxygen is present as –OH terminations and because the enduring presence of H2O and fluoride containing impurities significantly affects the O![[thin space (1/6-em)]](https://www.rsc.org/images/entities/char_2009.gif) :F ratio. There is also a clear difference between the functional groups of the samples prepared by HF and LiF–HCl syntheses; there is almost four times as much –F termination in the HF synthesised sample, as well as more –OH and we conclude there must therefore be fewer –O terminations. High content of O-terminated titanium atoms and a low content of –OH and –F terminal groups in LiF–HCl etched samples suggests that this method is preferred for producing MXenes for Li-ion and other batteries where O-termination gives a higher capacity,12 although complete conversion is not achieved.
:F ratio. There is also a clear difference between the functional groups of the samples prepared by HF and LiF–HCl syntheses; there is almost four times as much –F termination in the HF synthesised sample, as well as more –OH and we conclude there must therefore be fewer –O terminations. High content of O-terminated titanium atoms and a low content of –OH and –F terminal groups in LiF–HCl etched samples suggests that this method is preferred for producing MXenes for Li-ion and other batteries where O-termination gives a higher capacity,12 although complete conversion is not achieved.
It was considered that vacuum drying could have caused the conversion of –OH terminations to –O according to –OH + –OH → –O + H2O,21 and hence the low levels of –OH terminations observed. Using a long spin-echo as a T2 filter it was possible to largely remove the H2O signal in the 1H NMR spectrum and resolve the –OH terminations before drying. A comparison of the spectra before and after drying in vacuo at 200 °C showed no change in –OH intensity and therefore the termination proportions determined for vacuum dried samples are also valid for the material as synthesised (see ESI†).
In conclusion, –OH and –F terminations have been identified in the 1H and 19F NMR spectra of Ti3C2Tx MXene, as well as H2O still present between the Ti3C2Tx sheets after vacuum drying at 200 °C. Two-dimensional correlation experiments have confirmed the connectivity of the –OH and –F terminations and revealed that they are all present in close vicinity to each other between the metal carbide layers. Quantitative NMR experiments then showed that there are significantly fewer –OH terminations than –F and –O terminations and that the surface termination is highly sensitive to the synthesis method used; in particular the HF synthesised material has almost four times as much –F termination as the LiF–HCl synthesised material. Our measurements give a new level of insight into the chemistry of these exciting materials, and should facilitate their development in electrochemical energy storage applications. We also note that the NMR methods used here are generally applicable to the large family of MXene compounds.
We are grateful for financial support by the Oppenheimer Foundation and EPSRC. We would like to thank Professor M. W. Barsoum, Drexel University, for helpful discussions; Chang E. Ren, Drexel University, for help with material characterization; and Zigeng Liu and Yan-Yan Hu, Cambridge University, for providing the 19F NMR spectrum of TiF3. Material synthesis and characterization at Drexel University was supported by the US National Science Foundation under grant number DMR-1310245. The experimental data for all NMR experiments has been made available at http://www.repository.cam.ac.uk/handle/1810/253254.
Notes and references
- M. Naguib, V. N. Mochalin, M. W. Barsoum and Y. Gogotsi, Adv. Mater., 2014, 26, 992–1005 CrossRef CAS PubMed.
- M. Naguib, M. Kurtoglu, V. Presser, J. Lu, J. Niu, M. Heon, L. Hultman, Y. Gogotsi and M. W. Barsoum, Adv. Mater., 2011, 23, 4248–4253 CrossRef CAS PubMed.
- O. Mashtalir, M. Naguib, V. N. Mochalin, Y. Dall'Agnese, M. Heon, M. W. Barsoum and Y. Gogotsi, Nat. Commun., 2013, 4, 1716 CrossRef PubMed.
- X. Liang, A. Garsuch and L. F. Nazar, Angew. Chem., Int. Ed., 2015, 54, 3907–3911 CrossRef CAS PubMed.
- M. R. Lukatskaya, O. Mashtalir, C. E. Ren, Y. Dall’Agnese, P. Rozier, P. L. Taberna, M. Naguib, P. Simon, M. W. Barsoum and Y. Gogotsi, Science, 2013, 341, 1502–1505 CrossRef CAS PubMed.
- Q. Peng, J. Guo, Q. Zhang, J. Xiang, B. Liu, A. Zhou, R. Liu and Y. Tian, J. Am. Chem. Soc., 2014, 136, 4113–4116 CrossRef CAS PubMed.
- J. Chen, K. Chen, D. Tong, Y. Huang, J. Zhang, J. Xue, Q. Huang and T. Chen, Chem. Commun., 2015, 51, 314–317 RSC.
- J. Halim, K. M. Cook, M. Naguib, P. Eklund, Y. Gogotsi, J. Rosen and M. W. Barsoum, Appl. Surf. Sci., 2016, 362, 406–417 CrossRef CAS.
- C. Shi, M. Beidaghi, M. Naguib, O. Mashtalir, Y. Gogotsi and S. J. L. Billinge, Phys. Rev. Lett., 2014, 112, 125501 CrossRef PubMed.
- M. Ghidiu, M. R. Lukatskaya, M.-Q. Zhao, Y. Gogotsi and M. W. Barsoum, Nature, 2014, 516, 78–81 CAS.
- M. Khazaei, M. Arai, T. Sasaki, C.-Y. Chung, N. S. Venkataramanan, M. Estili, Y. Sakka and Y. Kawazoe, Adv. Funct. Mater., 2013, 23, 2185–2192 CrossRef CAS.
- Y. Xie, M. Naguib, V. N. Mochalin, M. W. Barsoum, Y. Gogotsi, X. Yu, K. W. Nam, X. Q. Yang, A. I. Kolesnikov and P. R. C. Kent, J. Am. Chem. Soc., 2014, 136, 6385–6394 CrossRef CAS PubMed.
- C. Eames and M. S. Islam, J. Am. Chem. Soc., 2014, 136, 16270–16276 CrossRef CAS PubMed.
- K. J. MacKenzie and M. E. Smith, Multinuclear Solid-State Nuclear Magnetic Resonance of Inorganic Materials, 2002 Search PubMed.
- K. J. Harris, M. Bugnet, M. Naguib, M. W. Barsoum and G. R. Goward, J. Phys. Chem. C, 2015, 13713–13720 CAS.
- K. J. MacKenzie, R. H. Meinhold, D. G. McGavin, J. A. Ripmeester and I. Moudrakovski, Solid State Nucl. Magn. Reson., 1995, 4, 193–201 CrossRef CAS PubMed.
- S. R. Hartmann and E. L. Hahn, Phys. Rev., 1962, 128, 2042–2053 CrossRef CAS.
- M. R. Chierotti and R. Gobetto, in Supramolecular Chemistry: From Molecules to Nanomaterials., ed. J. W. Steed and P. A. Gale, Wiley, 2012, pp. 331–347 Search PubMed.
- È. Grimmer, E. Kemnitz, U. Groû and S. Ru, J. Fluorine Chem., 2002, 115, 193–199 CrossRef.
- R. König, G. Scholz, a. Pawlik, C. Jager, B. Van Rossum and E. Kemnitz, J. Phys. Chem. C, 2009, 113, 15576–15585 Search PubMed.
- L. H. Karlsson, J. Birch, J. Halim, M. W. Barsoum and P. O. Å. Persson, Nano Lett., 2015, 4955–4960 CrossRef CAS PubMed.
Footnote |
| † Electronic supplementary information (ESI) available: Experimental details, additional NMR spectra and EDS analysis of the Ti3C2Tx samples. See DOI: 10.1039/c6cp00330c |
| This journal is © the Owner Societies 2016 |