
 Open Access Article
 This Open Access Article is licensed under a Creative Commons Attribution-Non Commercial 3.0 Unported Licence
Glass polymorphism in glycerol–water mixtures: I. A computer simulation study
David A.
Jahn
a,
Jessina
Wong
a,
Johannes
Bachler
b,
Thomas
Loerting
b and
Nicolas
Giovambattista
*ac
aDepartment of Physics, Brooklyn College of the City University of New York, Brooklyn, NY 11210, USA. E-mail: ngiovambattista@brooklyn.cuny.edu
bInstitute of Physical Chemistry, University of Innsbruck, A-6020 Innsbruck, Austria
cPhD Programs in Chemistry and Physics, The Graduate Center of the City University of New York, New York, NY 10016, USA
First published on 17th March 2016
Abstract
We perform out-of-equilibrium molecular dynamics (MD) simulations of water–glycerol mixtures in the glass state. Specifically, we study the transformations between low-density (LDA) and high-density amorphous (HDA) forms of these mixtures induced by compression/decompression at constant temperature. Our MD simulations reproduce qualitatively the density changes observed in experiments. Specifically, the LDA–HDA transformation becomes (i) smoother and (ii) the hysteresis in a compression/decompression cycle decreases as T and/or glycerol content increase. This is surprising given the fast compression/decompression rates (relative to experiments) accessible in MD simulations. We study mixtures with glycerol molar concentration χg = 0–13% and find that, for the present mixture models and rates, the LDA–HDA transformation is detectable up to χg ≈ 5%. As the concentration increases, the density of the starting glass (i.e., LDA at approximately χg ≤ 5%) rapidly increases while, instead, the density of HDA remains practically constant. Accordingly, the LDA state and hence glass polymorphism become inaccessible for glassy mixtures with approximately χg > 5%. We present an analysis of the molecular-level changes underlying the LDA–HDA transformation. As observed in pure glassy water, during the LDA-to-HDA transformation, water molecules within the mixture approach each other, moving from the second to the first hydration shell and filling the first interstitial shell of water molecules. Interestingly, similar changes also occur around glycerol OH groups. It follows that glycerol OH groups contribute to the density increase during the LDA–HDA transformation. An analysis of the hydrogen bond (HB)-network of the mixtures shows that the LDA–HDA transformation is accompanied by minor changes in the number of HBs of water and glycerol. Instead, large changes in glycerol and water coordination numbers occur. We also perform a detailed analysis of the effects that the glycerol force field (FF) has on our results. By comparing MD simulations using two different glycerol models, we find that glycerol conformations indeed depend on the FF employed. Yet, the thermodynamic and microscopic mechanisms accompanying the LDA–HDA transformation and hence, our main results, do not. This work is accompanied by an experimental report where we study the glass polymorphism in glycerol–water mixtures prepared by isobaric cooling at 1 bar.
1 Introduction
The behavior of water in the glass domain is surprisingly complex. While most substances form a single glass, with properties that vary smoothly upon changes in pressure and/or temperature,1 water can form at least two different glassy states (glass polymorphism). The most common forms of glassy water are low-density (LDA) and high-density (HDA) amorphous ice. LDA and HDA can be interconverted by, e.g., isobaric heating and isothermal compression/decompression, and these transformations are accompanied by sharp changes in the thermodynamic,2–12 structural,3,13 and dynamical14–16 properties (see also ref. 17–20). Indeed, the LDA–HDA transformations are so abrupt that they are reminiscent of first-order phase transitions observed in equilibrium systems.4 Interestingly, water is not alone and there are a few other substances, such as silica,21 germanium,22 and metallic glasses,23 that exhibit glass polymorphism as well. One explanation of water glass polymorphism (usually used to explain glass polymorphism in other substances as well) is provided by the liquid–liquid phase transition (LLPT) scenario.11,20 In this scenario, water can exist in two different liquid states at low temperatures, low-density (LDL) and high-density liquid (HDL). It is also hypothesized that LDL and HDL are separated by a first-order phase transition that ends at a liquid–liquid critical point (LLCP) at higher temperatures. In this view, LDA (HDA) is the glass associated with LDL (HDL) and the LDA–HDA transformation is the counterpart of the LDL–HDL transformations, where the former takes place below the glass transition temperature Tg and the latter occurs above Tg. In the LLPT scenario, the LDL-to-HDL (HDL-to-LDL) spinodal line becomes the experimentally observed LDA-to-HDA (HDA-to-LDA) transformation line when extended to low temperatures, into the glass domain.3,12,14,16The LLPT scenario was proposed based on molecular dynamics (MD) simulations of water using the ST2 model, where the LLPT and the LLCP were first observed.11 The existence of a LLPT and a LLCP in ST2 water has been recently confirmed by free energy calculations24–27 and its behavior in the glass state is in qualitative agreement with experiments.3,12,14 However, it is not evident that a LLPT is present in all water models available; the LLCP may be inaccessible because it is at very low temperatures, deep within the glass domain, such as in the case of the SPC/E model,28,29 or because of rapid crystallization, such as in the case of the mW model.30 From the experimental side, the LLPT scenario has not been confirmed due to water's fast crystallization in the pressure–temperature domain where the LLPT is expected to occur. However, there is strong evidence indicating the existence of the LLPT in bulk water. Specifically, Winkel et al. have observed the spontaneous formation of a LDA–HDA interface upon decompression of HDA at T = 140 K and P = 0.07 GPa.31 Inspecting the pressure dependence of LDA's and HDA's Tg values,16,32 it becomes evident that T = 140 K is above the Tg of both LDA and HDA at P = 0.07 GPa. This implies that the spontaneous formation of the interface observed by Winkel et al.31 is indeed in the domain of the ultraviscous liquids and hence, it can be interpreted to be the first observation of the LLPT in bulk water.
The search for water's LLCP and LLPT has been the focus of many scientists for more than 30 years. Different and creative experimental approaches have been pursued, including the study of the melting line of ice III and ice IV in decompression experiments,33,34 the study of the phase behavior of dilute aqueous solutions, such as LiCl–water35 and glycerol–water mixtures,36 and the study of confined water, such as water confined in nanopores37–41 and emulsified water.42 Computational and theoretical studies exploring the presence of a LLPT in nanoconfined water and binary aqueous solutions are also available (see, e.g., ref. 43–47). Yet, the strongest support for the water LLPT hypothesis is from experiments in the glass state. We note that the phase diagram of glassy water is in qualitative agreement with the phase diagram of glassy ST2 water and it is consistent with the LLPT scenario. In addition, the pressure-dependence of the glass transition temperatures of LDA and HDA in experiments is also qualitatively consistent with that reported for ST2 water.16,32
In a recent study, Murata and Tanaka48 performed interesting experiments using water–glycerol mixtures and argued that these mixtures exhibit a LLPT. These results were surprising given that a LLPT could not be observed in dilute salt–water solutions and they motivated recent theoretical43 studies as well as experiments focused on polyamorphism in glassy water–glycerol mixtures.36,49 The latter experiments suggest that the apparent LLPT reported in the glycerol–water solutions of ref. 48 is not due to the presence of two liquids but instead, it is due to cold-crystallization of amorphous ice within the mixture. However, these experiments still suggest the possibility of a LLPT and a LLCP in glycerol–water solutions. In particular, Suzuki and Mishima36 observed a progressive disappearance of the LDA–HDA transformation when approaching χg = 0.12–0.15, at P = 0.03–0.05 GPa and T ≈ 150 K, which they regard to be the location of the LLCP.
Computational studies of glass polymorphism in aqueous solutions have been limited to the case of water–salt mixtures. We are not aware of any computer simulation study of glass polymorphism in organic aqueous solutions and hence, the motivation of this work. In a series of studies, we explored the LDA–HDA transformations in pure water using out-of-equilibrium molecular dynamics (MD) simulations with different water models.2,3,14,16,50–52 In particular, it was found that the ST2 and TIP4P/2005 water models show qualitative agreement with experiments and that they support the LLPT hypothesis.2,3,14,16 It is natural to ask whether MD simulations, with the very large compression/decompression and cooling rates, may be able to reproduce the (pressure-induced) glass polymorphism in water–glycerol mixtures observed in the experiments of ref. 36; see also the experiments in our companion paper.53 In this work we address this issue. Specifically, we study the pressure-induced LDA–HDA transformations of water–glycerol mixtures at different concentrations and temperatures. In particular, we describe the molecular-level structural changes that accompany these transformations. The glassy mixtures we prepare in simulations are obtained by cooling the aqueous solutions at normal pressure, as in our companion experimental work.53 However, we note that the samples prepared in our experimental work53 show crystallization upon cooling (χg < 38%) while, at the fast cooling rates used in MD simulations, crystallization does not occur. Accordingly, the glassy glycerol–water mixtures prepared in simulations are homogeneous, showing no phase separation. The mixtures prepared in the present MD simulations are closer to the samples prepared by Suzuki and Mishima36 which are prepared by cooling glycerol water mixtures under pressure (0.3 GPa); these samples show no phase separation at χg < 15%.
This work is organized as follows. In Section 2, we discuss the computer simulation details. The preparation of the LDA and the liquid-to-LDA transformation are discussed in Section 3. In Sections 4 and 5, we study the pressure-induced LDA–HDA transformation, including the phase diagram for glassy water and the structures of LDA and HDA. A summary is presented in Section 6. An appendix is included where we confirm the absence of system size effects.
2 Methods
We perform out-of equilibrium MD simulations of water–glycerol mixtures with glycerol molar fraction χg = 0%, 0.14%, 0.95%, 2.02%, 3.06%, 3.95%, 4.95%, 7.01%, 10.00% and 13.01%. Most simulations are performed for a system composed of N = 729 water molecules and Ng = 0, 1, 7, 15, 23, 30, 38, 55, 81, and 109 glycerol molecules, depending on concentration. For one of the mixture models studied, we also perform MD simulations for a system with N = 5832 and Ng = 184 (χg = 3.06%) in order to confirm the absence of system size effects (see the Appendix).Simulations are performed using the TIP4P/2005 model for water54 combined with two different models for glycerol, the Blieck–Chelli55,56 (BC) model that belongs to the AMBER57 force field and the Reiling58 (R) model that belongs to the CHARMM2259,60 force field. The two mixture models, BC+TIP4P/2005 and R+TIP4P/2005, were studied in the liquid state in ref. 61 using MD simulations. Details of the MD simulations (such as the cutoff distance used for pair interactions), force fields (including the parameters that define each model), as well as the comparison of the models' performance with experiments can be found in ref. 61 and 62. Both glycerol models employ equivalent functional forms for the intramolecular potential energies associated with bond stretching, angular, and torsional interactions, as well as employ Lennard-Jones (LJ) and Coulombic interactions. Both models employ the Lorentz–Berthelot combination rule to define the LJ parameters for atoms of different types. The R and BC models differ in the potential parameters of the intramolecular interactions as well as the LJ parameters and partial charges assigned to the O, H, and C atoms. These models also include different parameters to weight the so-called 1–4 pair interactions. In addition, OH bonds are rigid in the BC model while, in the R model, an harmonic potential between the O and H atoms is included.
We perform two kinds of out-of-equilibrium MD simulations, (a) isobaric cooling runs at P = 0.1 MPa to generate the starting amorphous glassy mixtures (for roughly χg ≤ 5%, these mixtures correspond to LDA forms; see Section 3), and (b) isothermal compression/decompression cycles at different temperatures to study the LDA–HDA transformation (Section 4). These MD simulations are identical to the MD simulations presented in ref. 2 where the LDA–HDA transformation in pure TIP4P/2005 water is described. Accordingly, we refer the reader to ref. 2 for details. Briefly, during isobaric cooling at P = 0.1 MPa the barostat pressure is kept constant while the thermostat temperature is decreased linearly with time; the present cooling rate being qc = dT/dt = 1 K ns−1. The starting configurations for the cooling runs are obtained from independent equilibrium simulations at the corresponding concentration, at P = 0.1 MPa and T = 300 K. During the compression/decompression runs, the thermostat temperature is kept constant while the pressure is increased/decreased linearly with time, with a compression/decompression rate qP = dP/dt = 100 MPa ns−1. As discussed in ref. 2, 3 and 14, the cooling and compression/decompression rates employed in our MD simulations are a few orders of magnitude larger than the accessible experimental rates. Specifically, our cooling rates are ≈2 orders of magnitude faster than the rates necessary to form hyperquenched glassy water while our compression/decompression rates are ≈8–9 orders of magnitude faster than the typical experimental compression rates. Nonetheless, at least for the case of pure water, MD simulations are able to reproduce most of the qualitative features of the LDA–HDA transformation in real water. Part of the present work is to test whether MD simulations, at the rates accessible in MD simulations, can also reproduce qualitatively the amorphous–amorphous transformations in water–glycerol mixtures.
In order to characterize the liquid-to-glass transformation of the water–glycerol mixtures, we also perform equilibrium simulations of the solutions at different temperatures (T = 200–300 K) and at P = 0.1 MPa. Following ref. 61, the starting configurations are prepared by locating glycerol molecules randomly in a water box, followed by equilibration at P = 0.1 MPa and T = 400–460 K. The temperature of the system is then lowered in steps, T = 300, 280, 240, 220, 210 K, and at each temperature the system is simulated for a time Δt, before the temperature is further reduced. Δt varies with temperature and concentration, from 1–5 ns at high-T and low-χg to up to 400 ns at T = 210 K. In all cases, we make sure that both glycerol and water reach the diffusive regime. Specifically, Δt(T) is at least three times τ(T), where τ(T) is the time at which the mean-square displacement of glycerol molecules reaches a value of d2 = 100 Å2. We note that d is approximately the size of a glycerol molecule (≈10 Å); d is also larger than the nearest-neighbor's distance in pure glycerol (the first peak of glycerol–glycerol radial distribution functions, defined from glycerol molecules' central carbon atom, is located at r ≈ 6 Å). The simulation time step is 1 fs for the equilibrium runs and 2 fs for the cooling/compression/decompression runs.
3 Preparation of LDA forms of glycerol–water solutions by isobaric cooling at P = 0.1 MPa
3.1 Liquid-to-LDA transformation upon isobaric cooling
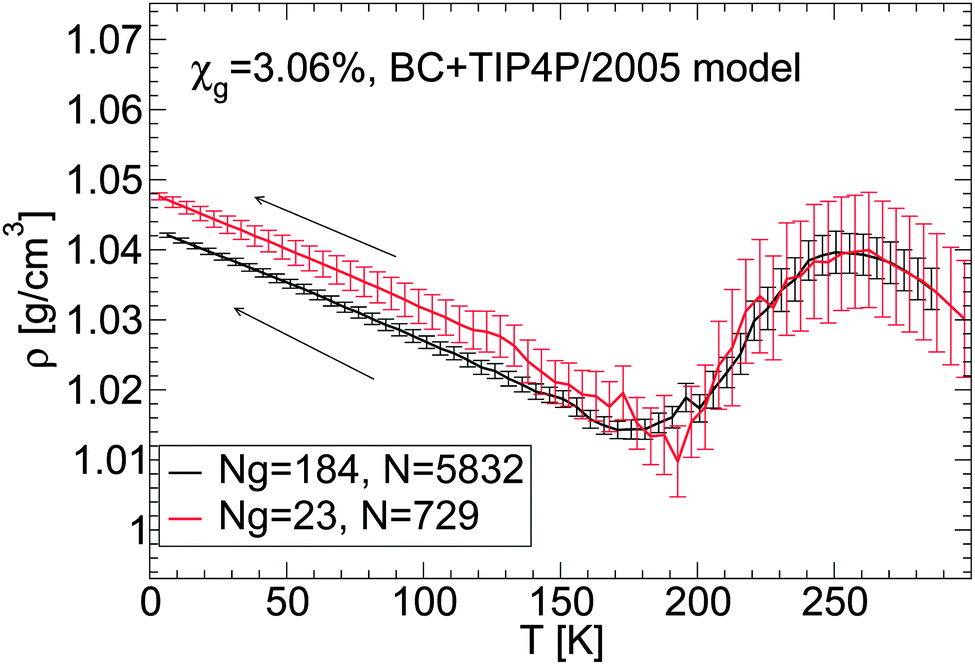
For a given molar fraction χg, the corresponding LDA form is prepared by first equilibrating the solution at P = 0.1 MPa and T = 300 K (for the case of water, i.e., χg = 0%, the system is equilibrated at T = 240 K). The solution is then cooled at constant pressure (P = 0.1 MPa) using a cooling rate qc = 1 K ns−1. This is the same experimental procedure followed to prepare hyperquenched glassy water (HGW)63 which is a glassy form belonging to the LDA ice family.17 The same procedure was employed in our previous computer simulation studies of glass polymorphism in water using the SPC/E,16,52 ST2,3,14,16 and TIP4P/20052 models, with the same or comparable cooling rates. This allows for a direct comparison between the results presented in these previous studies and the results reported here for the case of water–glycerol mixtures. The rate qc = 1 K ns−1 is two orders of magnitude faster than the typical experimental cooling rate required to form HGW.64 Nonetheless, our results are expected to be qualitatively unaffected if such slower rates were employed. For example, in the case of TIP4P/2005 water, decreasing the cooling rate from qc = 1 K ns−1 to qc = 0.1 K ns−1 has practically no effects on the pressure-induced LDA–HDA transformation.2 In the companion experimental paper,53 we follow the same procedure to prepare the amorphous glassy mixtures but in these cases, we employ much slower cooling rates, qc ≤ 100 K s−1. Accordingly, while our simulated glassy mixtures exhibit no ice domains, the experimental samples prepared in ref. 53 at χg ≤ 0.15 show phase separation with ice formation. Nevertheless, the final state in our MD simulation and experimental studies, after isothermal compression, is an amorphous glassy state where water is in an HDA-like form. Again, in the present work, water and glycerol are homogeneously mixed while in the companion paper, water in the HDA state may be mixed homogeneously with glycerol only at low concentrations; instead, at higher concentrations (but χg < 30%), water in the HDA state tends to form domains within a glassy water–glycerol matrix. Our glassy mixtures prepared by cooling are homogeneous, similar to the samples prepared by Suzuki and Mishima36 upon cooling under pressure, at P = 0.3 GPa.Fig. 1(a) shows the density of BC+TIP4P/2005 mixtures for different concentrations during cooling at P = 0.1 MPa. For comparison, the densities of the equilibrium liquid mixtures are included for T ≥ 200 K. At the present cooling rate, the densities of the glycerol–water mixtures obtained during the cooling process match the densities of the equilibrium solutions at T ≥ 200 K, i.e., the system is practically in equilibrium at these temperatures. In contrast, for approximately T < 140 K, the mixtures are in the glass state. At these temperatures, ρ(T) varies linearly with T, which is the typical behavior of the density for glassy systems. It follows from Fig. 1(a) that, at the present rate, the glass transition should be in the range of 140 < T < 200 K.
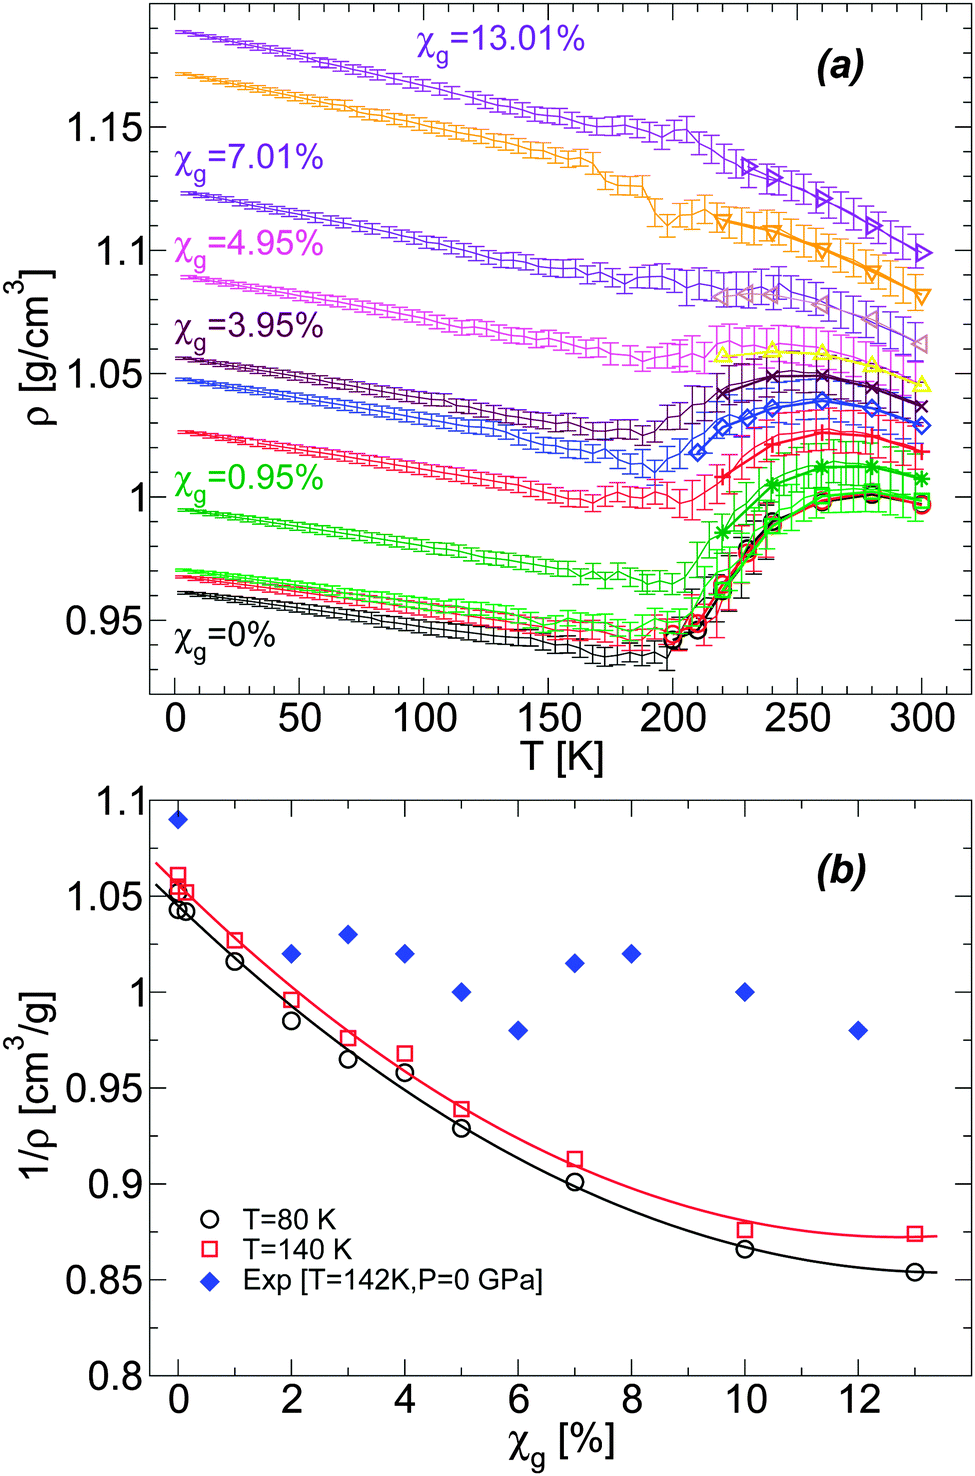 | ||
Fig. 1 (a) Density as a function of temperature ρ(T) from computer simulations of water–glycerol mixtures using the BC+TIP4P/2005 model during cooling at P = 0.1 MPa. The mixtures are equilibrated at T = 300 K for χg > 0% and T = 240 K for χg = 0%, and then cooled at cooling rate qc = 1 K ns−1. Glycerol molar fractions are (bottom to top) χg = 0% (black and red), 0.14% (green), 0.95% (dark green), 2.02% (red), 3.06% (blue), 3.95% (maroon), 4.95% (magenta), 7.01% (violet), 10.00% (orange), and 13.01% (indigo). Symbols at T ≥ 200 K are the equilibrium densities of the solutions; each data point during the cooling simulation is an average over a pressure window ΔP = 10 MPa and the error bars represent the standard deviation of the density over this P-interval. At the present cooling rate, the densities during the cooling runs match the equilibrium densities. At approximately T ≤ 150 K, the solutions are in a glassy state and ρ(T) varies linearly with T. (b) Comparison of the specific volumes 1/ρ of the glasses obtained from (a) with experiments at T = 142 K. The experimental data at χg ≥ 2% are estimated from ref. 36. The experimental point at χg = 0% (pure water) is estimated from a linear interpolation of the densities of LDA ice at T = 77 K (ρ = 0.94 g cm−3![[thin space (1/6-em)]](https://www.rsc.org/images/entities/char_2009.gif) 4) and T = 125 K (ρ = 0.92 g cm−364). The densities from the present MD simulations are smaller than the (estimated) experimental densities, particularly, as the concentration increases. 4) and T = 125 K (ρ = 0.92 g cm−364). The densities from the present MD simulations are smaller than the (estimated) experimental densities, particularly, as the concentration increases. | ||
It is desirable to compare the densities of the amorphous glycerol–water mixtures obtained in our simulations with experiments. However, we are not aware of experimental data of glassy water–glycerol solutions prepared by hyperquenching techniques at P = 0.1 MPa. Densities of glassy water–glycerol solutions at P = 0.1 MPa are reported in ref. 36 but for glasses formed by following a different protocol from the protocol employed in this work. Nonetheless, for comparison, we report in Fig. 1(b) the experimental specific volumes 1/ρ estimated from ref. 36 and the corresponding values obtained from Fig. 1(a). The specific volumes of the BC+TIP4P/2005 mixtures, for the cooling rate qc = 1 K ns−1, are smaller than the specific volumes estimated from ref. 36. It is not evident, however, whether this discrepancy is due to the different preparation processes followed to obtain the LDA forms of the mixtures or whether it is a deficiency of the computer model employed. We also stress that the experimental data of ref. 36 is rather noisy particularly at low pressures and error bars for 1/ρ are not available. In any case, it follows from Fig. 1(b) that the densities of the BC+TIP4P/2005 mixtures are consistent with the experimental data for approximately χg ≤ 2–6%.
3.2 Relevance of the glycerol model
It has been shown that even in the case of pure water, the LDA–HDA transformation in MD simulations is indeed sensitive to the model employed, with the TIP4P/2005 model performing, overall, better than other popular models, such as SPC/E, ST2, and mW.2 For example, the qualitative behavior of ρ(T) during the pressure-induced LDA–HDA transformations is better reproduced by the TIP4P/2005 model than by the SPC/E model. Similarly, the structure of HDA ice is well-reproduced by the SPC/E and TIP4P/2005 water models but this is not the case of ST2 water.2 One may wonder how sensitive the LDA–HDA transformation observed in MD simulations is to the glycerol model employed. After all, from the computational point of view, glycerol is much more complex than water. For example, while a rigid water model requires only 5–10 parameters, a glycerol force field typically requires 50–70 parameters and it is practically infeasible to know how the behavior of these models may vary if such parameters are slightly tuned. In addition, MD simulations of glycerol solutions at high temperatures indicate that the conformations adopted by glycerol are indeed model-dependent62 and we confirmed that the same conclusion holds for the case of water–glycerol solutions. This is relevant since, if the conformation adopted by glycerol molecules is model-dependent, then the number of intermolecular hydrogen bonds (HBs) of glycerol may also depend on the model employed (see, e.g., ref. 62). Accordingly, the number of HBs between glycerol and water may depend on the glycerol force field used, affecting the properties of water–glycerol LDA/HDA forms. In this section, we compare the role played by the glycerol model in the preparation of LDA. The effects of the glycerol model on the LDA–HDA transformation are discussed in the next sections.We first focus on the effects of the glycerol model on the density of LDA upon cooling at P = 0.1 MPa. Fig. 2 shows ρ(T) for two water–glycerol mixture models, BC+TIP4P/2005 and R+TIP4P/2005 models, during the preparation of LDA. In both cases, P = 0.1 MPa, qc = 1 K ns−1, and χg = 3.06%. The density of the LDA form (e.g., at T < 140 K) is larger in the case of the BC+TIP4P/2005 model by Δρ ≤ 0.02 g cm−3. This is not a large difference given that there are small fluctuations in the density of LDA from independent runs. For example, Fig. 2 includes the density of LDA ice (i.e., χg = 0%) for the case of two independent cooling runs at P = 0.1 MPa and qc = 1 K ns−1. In this case, the density among the two runs differs by Δρ ≤ 0.01 g cm−3. Accordingly, we can conclude that the effects of the glycerol model employed on ρ(T) are minor.
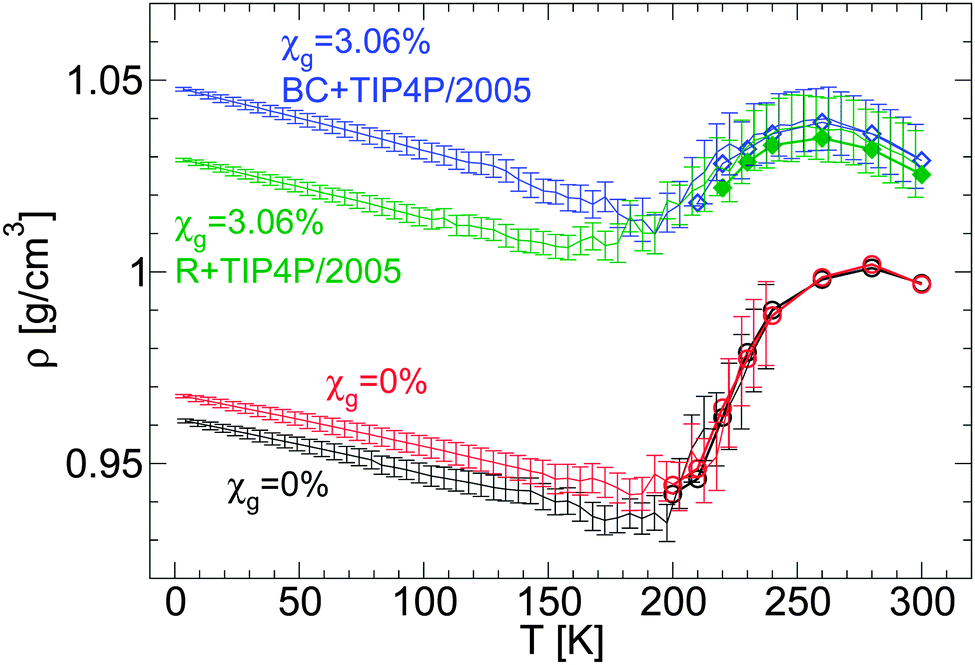 | ||
| Fig. 2 Comparison of ρ(T) obtained upon cooling glycerol–water mixtures in computer simulations using the BC+TIP4P/2005 [from Fig. 1(a)] and R+TIP4P/2005 mixture models. For comparison, two independent cooling runs of pure TIP4P/2005 water are included. qc = 1 K ns−1 and χg = 3.06%. Symbols are densities from independent equilibrium simulations. Each data point during the cooling runs is an average over a pressure-interval of 10 MPa. Error bars represent the standard deviation of the density over these intervals. The behavior of ρ(T) is qualitatively independent of the glycerol model employed. The density of the mixture models in the glass domain (e.g., T < 140 K) differs by Δρ ≈ 0.02 g cm−3, which is comparable with the density difference among independent runs, e.g., Δρ ≈ 0.01 g cm−3 in the case of water (red and black lines). | ||
The second property that we consider to test for sensitivity in the results to the glycerol models studied is the distribution of glycerol conformations in the LDA forms of the mixture models. Glycerol is a flexible molecule that can adopt different conformations.65 If the conformations of glycerol are defined in terms of the position of the heavy atoms (C and O atoms) then it is possible to define six different conformations based on the two OCCC dihedral angles:66αα, ββ, γγ, αβ, αγ, and βγ; see, e.g., ref. 62 for the definition of glycerol conformations. This classification of glycerol conformations has been used extensively in the past, both in experimental and computer simulation studies (see, e.g., ref. 62 and 67–73).
The distribution of glycerol conformers upon cooling the BC+TIP4P/2005 mixture at P = 0.1 MPa and qc = 1 K ns−1 is shown in Fig. 3(a) and (b) for the cases χg = 3.06% and 7.01%. Fig. 3(c) shows the conformer distribution for the R+TIP4P/2005 mixture with concentration χg = 3.06%. In all cases, fluctuations in the conformers populations are visible at approximately T > 160–170 K. At these temperatures, the mixtures are in the liquid state. Instead, at approximately T < 150 K (see Fig. 3(b)), the system is in the glassy state and glycerol molecules are not able to change conformation.
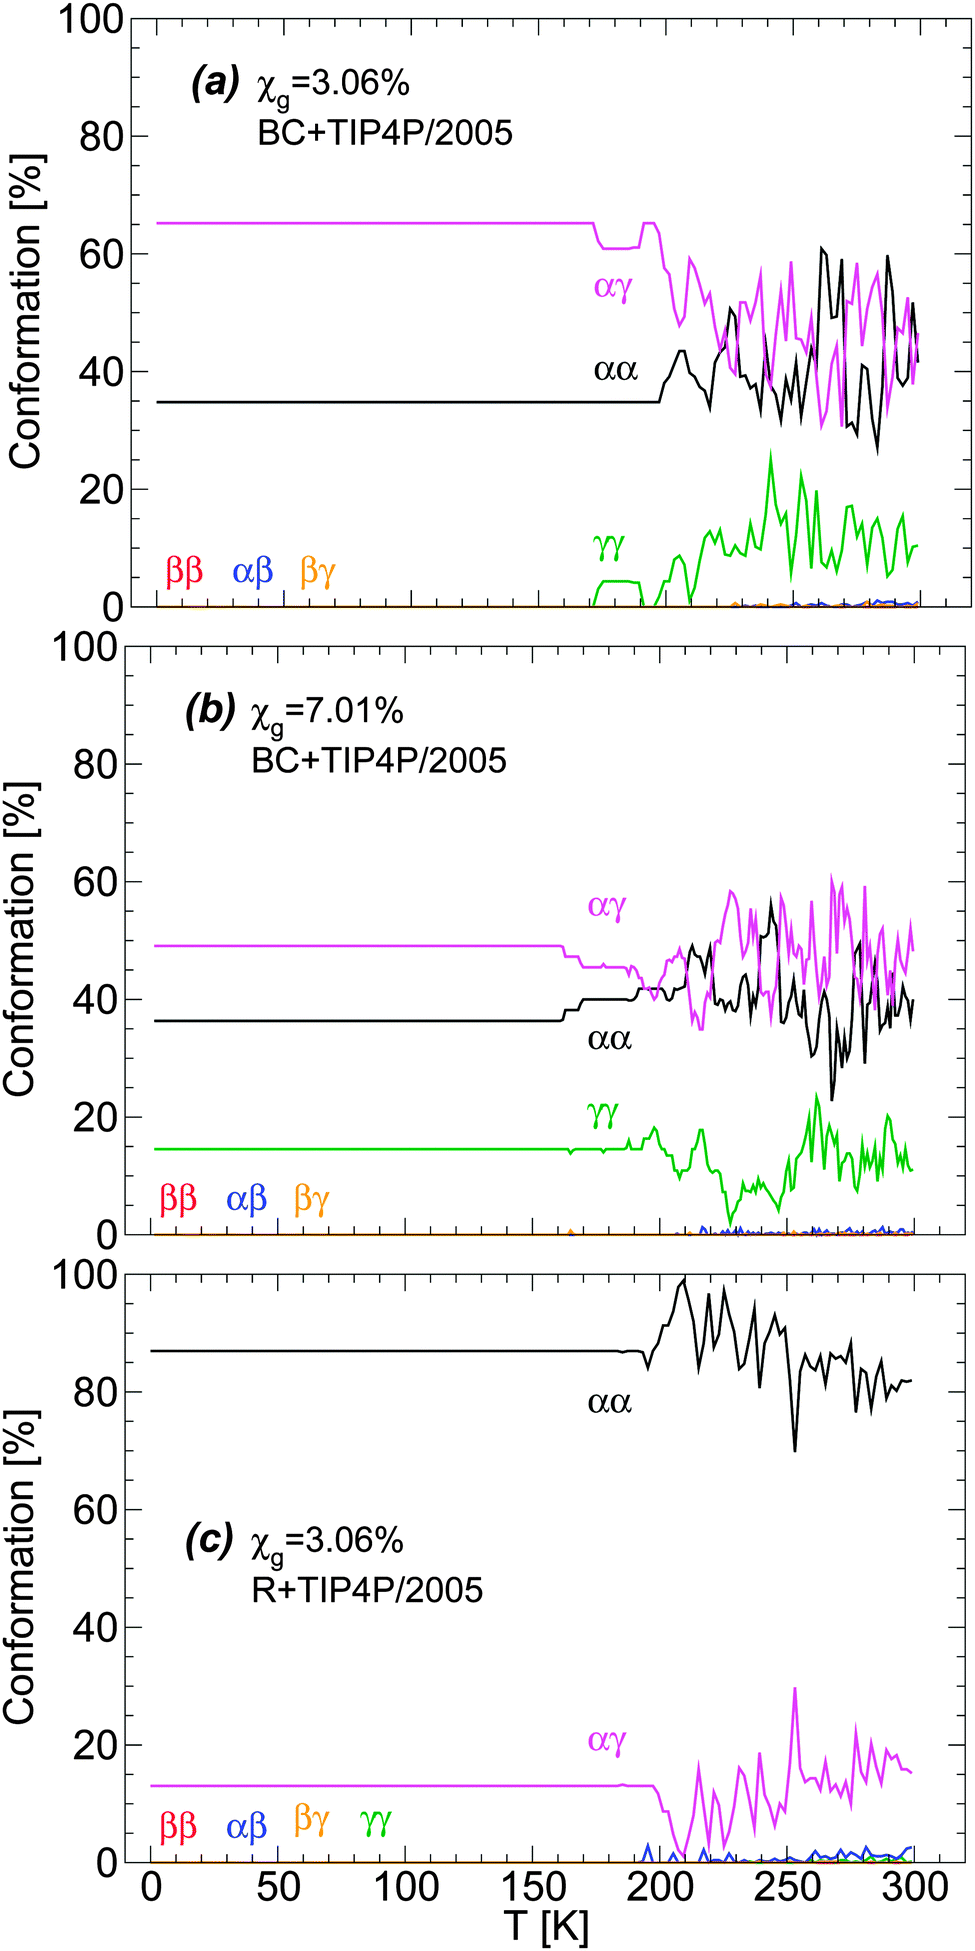 | ||
| Fig. 3 Glycerol conformations in the BC+TIP4P/2005 model mixture during cooling at P = 0.1 MPa with cooling rate qc = 1 K ns−1. Concentrations are (a) χg = 3.06% and (b) χg = 7.01%. (c) The same as (a) for the case of the R+TIP4P/2005 mixture model. In all cases, no changes in glycerol conformations occur at approximately T ≤ 140 K where the system is in the glassy state [see also Fig. 1]. Interestingly, the conformations of glycerol are different in the BC+TIP4P/2005 and R+TIP4P/2005 model mixtures. | ||
Remarkably, the conformations of glycerol are frozen in the glass state with conformations that depend on the concentration and particularly, on the glycerol model employed. Specifically, in BC+TIP4P/2005 mixtures, glycerol molecules adopt preferentially αγ conformations and the second most popular conformer is αα. Instead, in the R+TIP4P/2005 mixture, the most populated conformer is αα, while the second most popular conformer is αγ. It follows that the microscopic structure of the vitrified forms depends on the glycerol model employed and hence, one must be cautious when describing the structure of LDA and HDA in glycerol–water mixtures using computer simulations (see Section 5). Fortunately, we will show that both models exhibit qualitatively similar microscopic changes during the LDA–HDA transformations of water–glycerol mixtures, even when their microscopic structures differ.
We note that large fluctuations in the conformations of glycerol occur in the liquid state (Fig. 3) and hence, rapid cooling of the solution may result in glasses with slightly different average glycerol conformations.62
4 Pressure-induced LDA–HDA transformations in glycerol–water mixtures
In this section, we describe the pressure-induced LDA-to-HDA and HDA-to-LDA transformations in water–glycerol mixtures at different temperatures. For a given compression/decompression temperature T and concentration χg, we obtain the starting glassy form of the corresponding glycerol–water mixture by cooling the solution at P = 0.1 MPa down to temperature T, as explained in Section 3. These glassy mixtures correspond to LDA forms for approximately χg < 5%; see Fig. 1(a). The starting glassy mixtures are then compressed at constant rate qP = 100 MPa ns−1 and temperature T up to P = 3000 MPa. At P = 2000 MPa, all mixtures are found to be in the HDA-like form. Hence, to study the HDA-to-LDA transformation, we decompressed the mixtures from P0 = 2000 MPa to negative pressures until the tension in the system is large enough that the glassy mixtures ‘sublimate’. Specifically, at these pressures the volume during the simulation increases abruptly and the glass fractures, meaning that molecules in the glass are not able to withstand the tension. MD simulations of pure water2,3,14 show that the temperature at which the glass fractures connects smoothly with the liquid-to-gas spinodal as the compression–decompression temperature increases. The same protocol was used previously in MD simulation studies of the LDA–HDA transformation in pure water.2,3,16 This is also a common protocol followed experimentally to study glass polymorphism in water (see, e.g., ref. 17–19 and references therein); the same compression/decompression protocol was used recently by Suzuki and Mishima36 to study glass polymorphism in water–glycerol mixtures (in this case, however, the preparation of the starting glassy mixtures involves slow isobaric cooling of the mixture at P = 300 MPa, followed by decompression to P = 0.1 MPa at low temperatures). As discussed below, it is indeed remarkable that even at the present compression rates, MD simulations of atomistic models can reproduce qualitatively the phenomenology associated with the LDA–HDA transformations.4.1 Density versus pressure
One of the most common properties accessible in experimental studies of glass polymorphism is the density of the glass as a function of pressure, ρ(P), during the pressure-induced LDA–HDA transformations at constant temperature. Recently, Suzuki and Mishima36 reported 1/ρ(P) for glycerol–water mixtures during compression/decompression cycles at χg = 2–12% and T ≈ 140–155 K. Their main findings are that (i) the LDA–HDA transformation is observable for approximately χg < 10–12%, and that (ii) the density change and hysteresis in ρ(P) during the LDA–HDA transformations become less pronounced as the concentration and/or the compression/decompression temperature increases. In this section, we show that MD simulations can reproduce qualitatively the experimental observations (i) and (ii), even when the rates accessible in simulations are many orders of magnitude larger than the rates employed in experiments.2,18First, we confirm that the LDA–HDA transformations are not sensitive to the glycerol FF employed. To this end, we show in Fig. 4 the density of the BC+TIP4P/2005 and R+TIP4P/2005 mixture models during the pressure-induced LDA–HDA transformations. For simplicity, we limit the discussion to the case T = 120 K and χg = 3.06%. In all these cases, a sharp increase in density occurs during the compression process which signals the LDA-to-HDA transformation. Upon decompression from P0 = 2000 MPa, the mixture remains in the HDA form at P = 0.1 MPa and hence, the LDA–HDA transformation in our simulations is not reversible at positive pressures. This is consistent with the results of our companion paper,53 where it is shown that, upon decompression of the HDA-like mixtures, no transformation back to a less dense state occurs at 77 K and P > 0 MPa. In contrast, the experiments of ref. 36 indicate that HDA transforms back to LDA at P > 0 MPa and higher temperatures, e.g., 150 K. In our simulations, at the present compression/decompression rates, HDA does not seem to convert back to LDA at T ≤ 120 K even if negative pressures are considered. Instead, the density of HDA decreases continuously until the glass finally fractures at P ≈ −800 MPa. Slower decompression rates are needed in order to determine whether the HDA-to-LDA transformation in the R+TIP4P/2005 and BC+TIP4P/2005 models is reversible and perhaps, discontinuous.
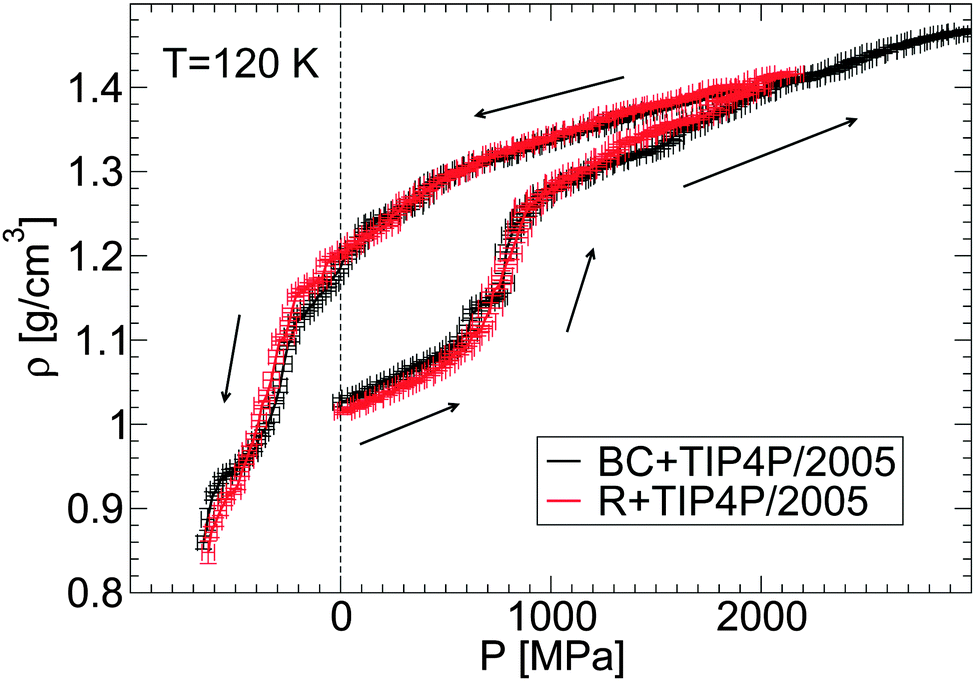 | ||
| Fig. 4 Density as a function of pressure ρ(P) during the compression/decompression of glycerol–water solutions from MD simulations using the BC+TIP4P/2005 and R+TIP4P/2005 model mixtures. In all cases, χg = 3.06% and the compression rate is qP = 100 MPa ns−1. The effects of the glycerol force field on ρ(P) are minor. | ||
An important point follows from Fig. 4. Specifically, the behavior of ρ(P) is practically insensitive to the glycerol model employed. It follows that both models show similar LDA–HDA transformation pressures.
Next, we focus on the effects of temperature and concentration on the LDA–HDA transformations in glycerol–water mixtures. Given the similarities in the results shown in Fig. 4 for the BC+TIP4P/2005 and R+TIP4P/2005 mixture models, we limit the discussion to the BC+TIP4P/2005 model. Fig. 5(a–c) show ρ(P) during the pressure-induced LDA–HDA transformations at χg = 0.95%, 3.06%, and 4.95%, respectively, at different temperatures. For comparison, we include ρ(P) for the case of (pure) TIP4P/2005 water during the LDA-to-HDA transformation at T = 80 K from ref. 2. At all three concentrations studied, we find that increasing the temperature has the effect of (a) decreasing the hysteresis in ρ(P) in the compression/decompression cycle, and (b) increasing the sharpness (i.e., the slope of ρ(P)) of the LDA-to-HDA transformation. These conclusions are in agreement with the experiments of ref. 36 on glycerol–water mixtures. These temperature-effects are known to occur in real water (see, e.g., ref. 17–20) and MD computer simulations of ST23,12 and TIP4P/2005 water.2 In the experimental studies of ref. 36, the decompression-induced HDA-to-LDA transformation is accompanied by a smooth density step at P > 0 MPa for χg < 12% and T ≈ 140–155 K. In this regard, MD simulations with the (relatively fast) compression/decompression rates explored in this work do not clearly show a density step accompanying the HDA-to-LDA transformation even if negative pressures are considered. Instead, the HDA-to-LDA transformation is rather continuous and hence, LDA cannot be necessarily interpreted as a distinct state forming between HDA and the gas. However, this conclusion may change if much slower compression/decompression rates become accessible.
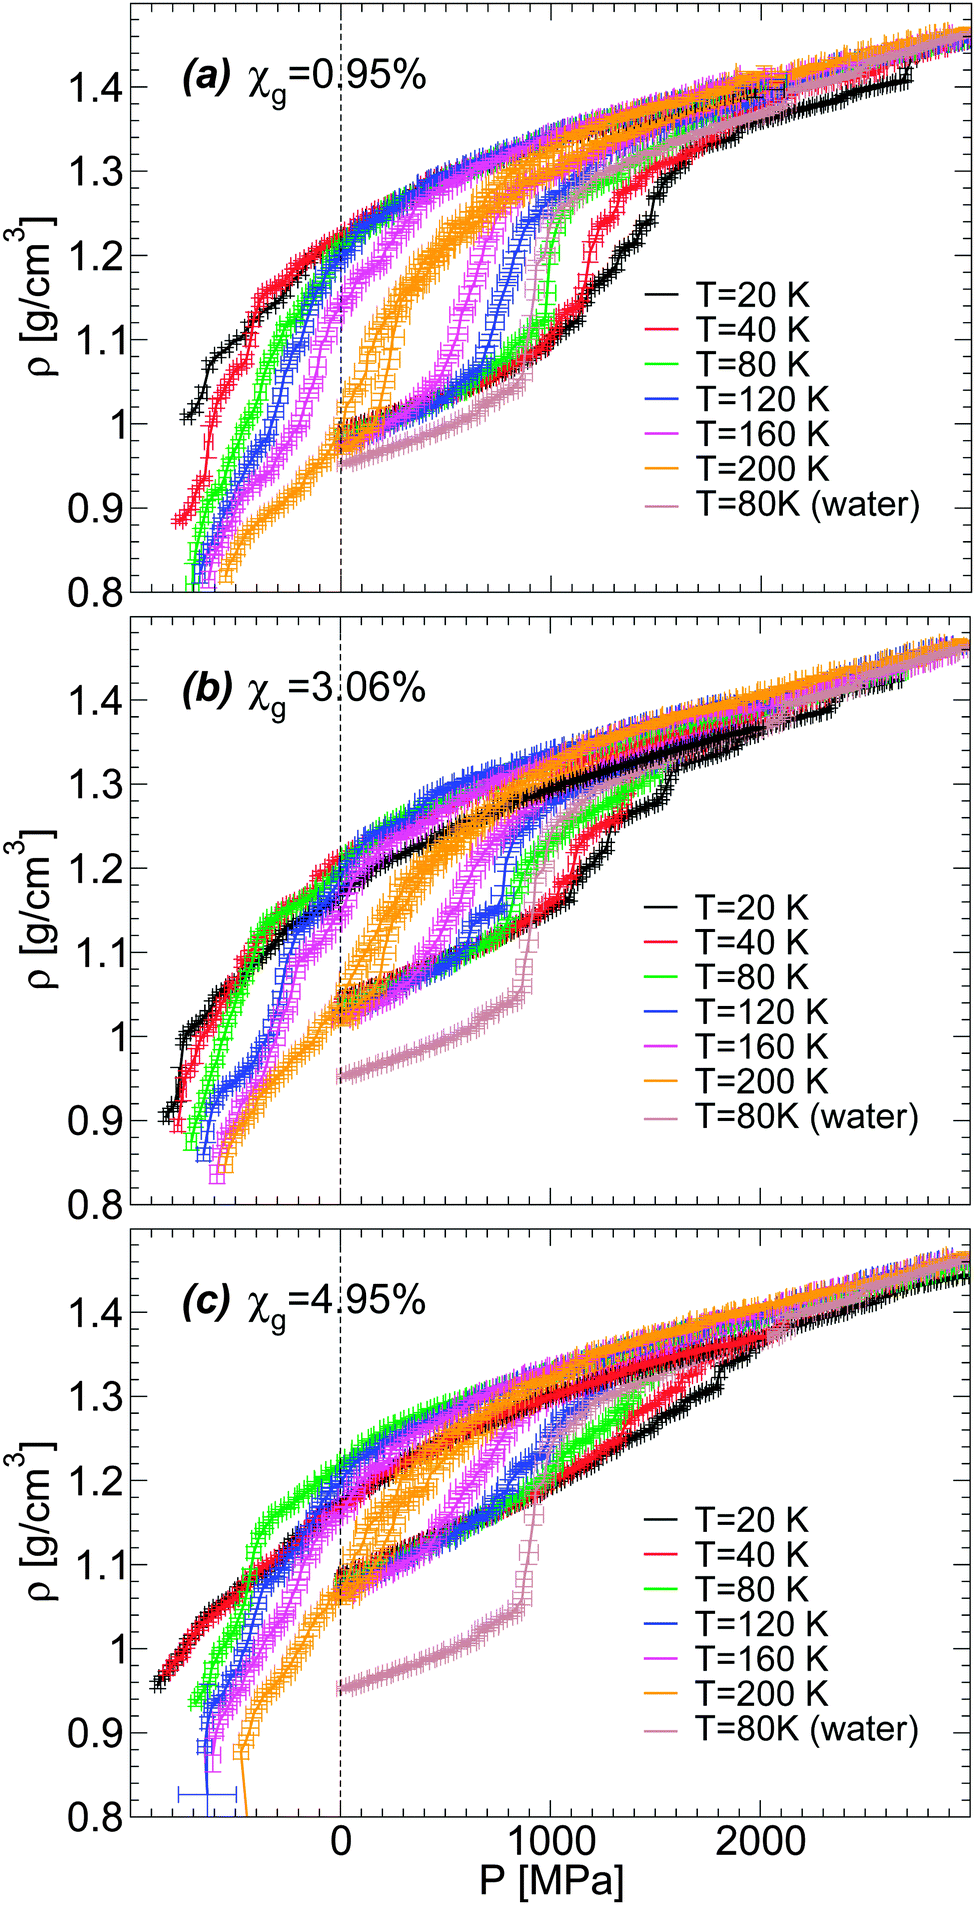 | ||
| Fig. 5 Density as a function of pressure ρ(P) during the compression/decompression cycle of glycerol–water solutions at constant temperature. Densities are from computer simulations using the BC+TIP4P/2005 mixture model with a compression/decompression rate qP = 100 MPa ns−1 at (a) χg = 0.95%, (b) χg = 3.06%, and (c) χg = 4.95%. The density change during the LDA–HDA transformation becomes smoother with decreasing temperature and/or increasing glycerol concentration. | ||
We note that Fig. 5 shows the LDA-to-HDA (HDA-to-LDA) transformations shifting to higher (lower) pressures with decreasing temperature, consistent with experiments. However, the values of these transformation pressures differ from experiments. For example, the experimental LDA-to-HDA transformations for χg = 2–10% and approximately T = 140–155 K are in the pressure-range of 100–350 MPa while in our case, they occur in the range of 600–1200 MPa. Similarly, the experimental HDA-to-LDA transformation occurs in the pressure-range of 0–150 MPa while in simulations, at the explored rates, HDA evolves smoothly to a low density glass at pressures in the range of −400 to −100 MPa (suggesting that a HDA-to-LDA transformation could exist in this pressure range, if slower decompression rates become available). Experimentally, the LDA–HDA transformation in glycerol–water mixtures is smoother than in pure water and expands over roughly 100–200 MPa. This pressure range is smaller than the typical pressure range observed in MD simulations, 300–500 MPa at 120 ≤ T ≤ 160 K.
We also explore in detail the effects of adding glycerol on the LDA–HDA transformation of water–glycerol mixtures observed in MD simulations. We focus on the LDA-to-HDA transformation where our MD simulations better reproduce qualitatively the experimental observations. A comparison of Fig. 5(a–c) shows that increasing χg has the effects of reducing the sharpness (i.e., the slope of ρ(P)) at the LDA-to-HDA transformation, similar to the effect of decreasing T. This is fully consistent with the experiments on water–glycerol glassy mixtures of ref. 36. In both cases, the main effect of adding glycerol is to erase the LDA–HDA transformation of the mixtures. To make this point more evident, we show in Fig. 6(a–c)ρ(P) during the compression-induced LDA-to-HDA transformation at fixed temperature and for all the concentrations studied. It follows from these figures that the cause of the disappearance of the LDA-to-HDA transition is due to (i) the rapid increase of the density of LDA with increasing χg, and (ii) the roughly independent density of HDA with χg (at least for χg ≤ 10%). That is, while the LDA-like state is strongly destabilized in the presence of glycerol, in favor of a denser state, the HDA-like state is not affected much by the presence of glycerol. Accordingly, the density of the LDA form of the mixture at χg = 10% and P = 0.1 MPa is so high that compression of LDA to P ≈ 2000 MPa cannot induce any sudden densification of the mixture, which could indicate a LDA-to-HDA transition. It follows that if the densities of the BC+TIP4P/2005 mixtures in the ‘LDA’ form increased at a slower rate than observed in our simulations then it would be possible to detect the LDA-to-HDA transitions in simulations at χg > 10%. Interestingly, we note that Fig. 1(b) suggests that the BC+TIP4P/2005 mixtures may overestimate the density of the glycerol–water LDA. Experiments show that the LDA-to-HDA transition can be detected up to χg ≈ 10–12%. Thus, it is possible that, relative to experiments, MD simulations of the BC+TIP4P/2005 mixture (as well as, R+TIP4P/2005 mixture) model reproduce the LDA-to-HDA transition at lower values χg due to their overestimation of the density of LDA at P = 0.1 MPa.
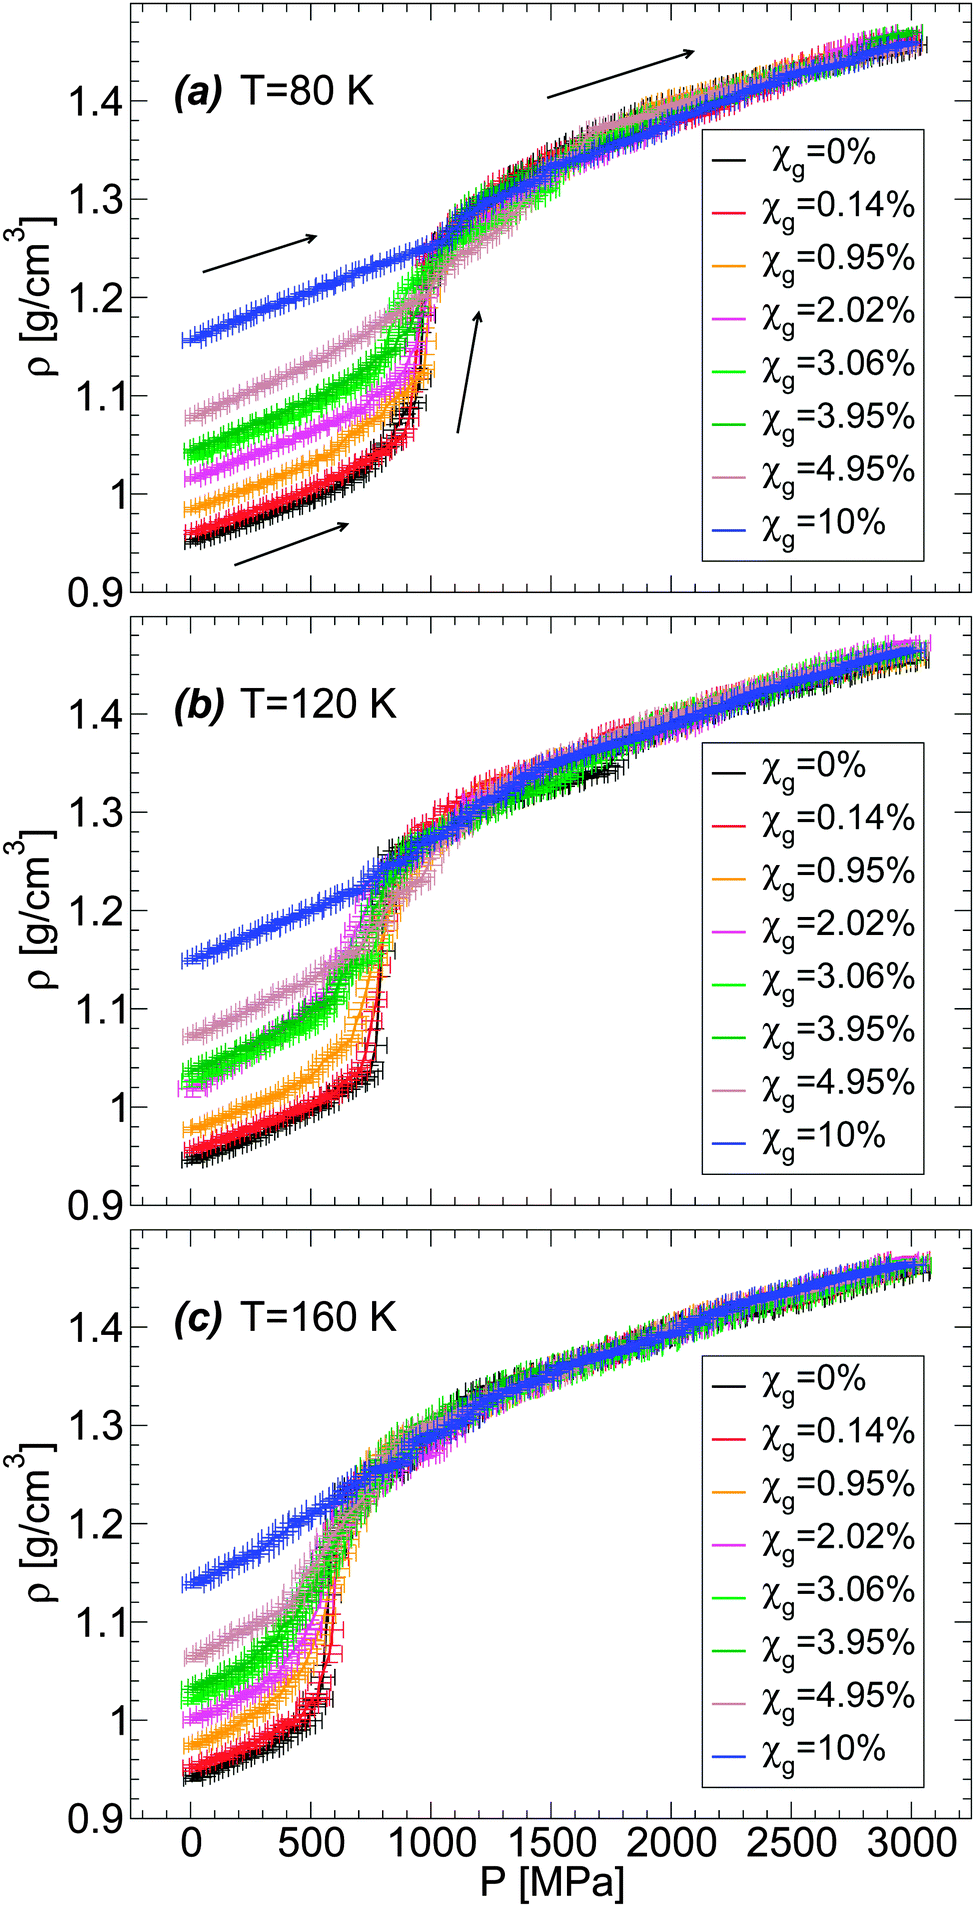 | ||
| Fig. 6 Density as a function of pressure ρ(P) during the compression of BC+TIP4P/2005 glycerol–water mixtures at (a) T = 80 K, (b) T = 120 K, and (c) T = 160 K. At all temperatures, increasing glycerol concentration reduces the density change during the compression process. For the present model, the LDA–HDA transformation can be identified at roughly χg < 5%. At higher concentrations, the density of the starting glass is high, ρ ≥ 1.1 g cm−3, and it is unclear whether the system is in the LDA state. The compression/decompression rate is qP = 100 MPa ns−1. | ||
5 Molecular structural changes during the amorphous–amorphous transformation
Experimentally, it is very challenging to obtain a molecular-level description of the LDA–HDA transformations in aqueous solutions. In this regard, MD simulations are extremely valuable. In this section, we describe the molecular-level changes underlying the pressure-induced LDA–HDA transformations in water–glycerol mixtures. We focus on the following properties, (i) water–water and water–glycerol radial distribution functions (RDFs), (ii) glycerol molecular conformations, and (iii) statistics of the glycerol–water hydrogen-bond (HB) network. Our discussion is based on water–glycerol mixtures with χg = 3.06%. In order to improve statistics, in addition to the system previously considered, with N = 729 and Ng = 23, we perform simulations for a system that is eight times larger, i.e., with N = 5832 and Ng = 184.5.1 Water–water and water–glycerol radial distribution functions
The RDFs of glycerol and water oxygen atoms (Og and Ow) around a given water oxygen atom are shown in Fig. 7(a) for the case of the BC+TIP4P/2005 glassy mixture. The RDFs of LDA and HDA are obtained at T = 80 K, averaging over 10 snapshots (covering a pressure-interval of 100 MPa) around P ≈ 0.1 MPa. For comparison, we also include the Ow–Ow RDF of the LDA and HDA forms of the mixtures. These Ow–Ow RDFs are practically identical to the corresponding RDFs of pure water LDA and HDA.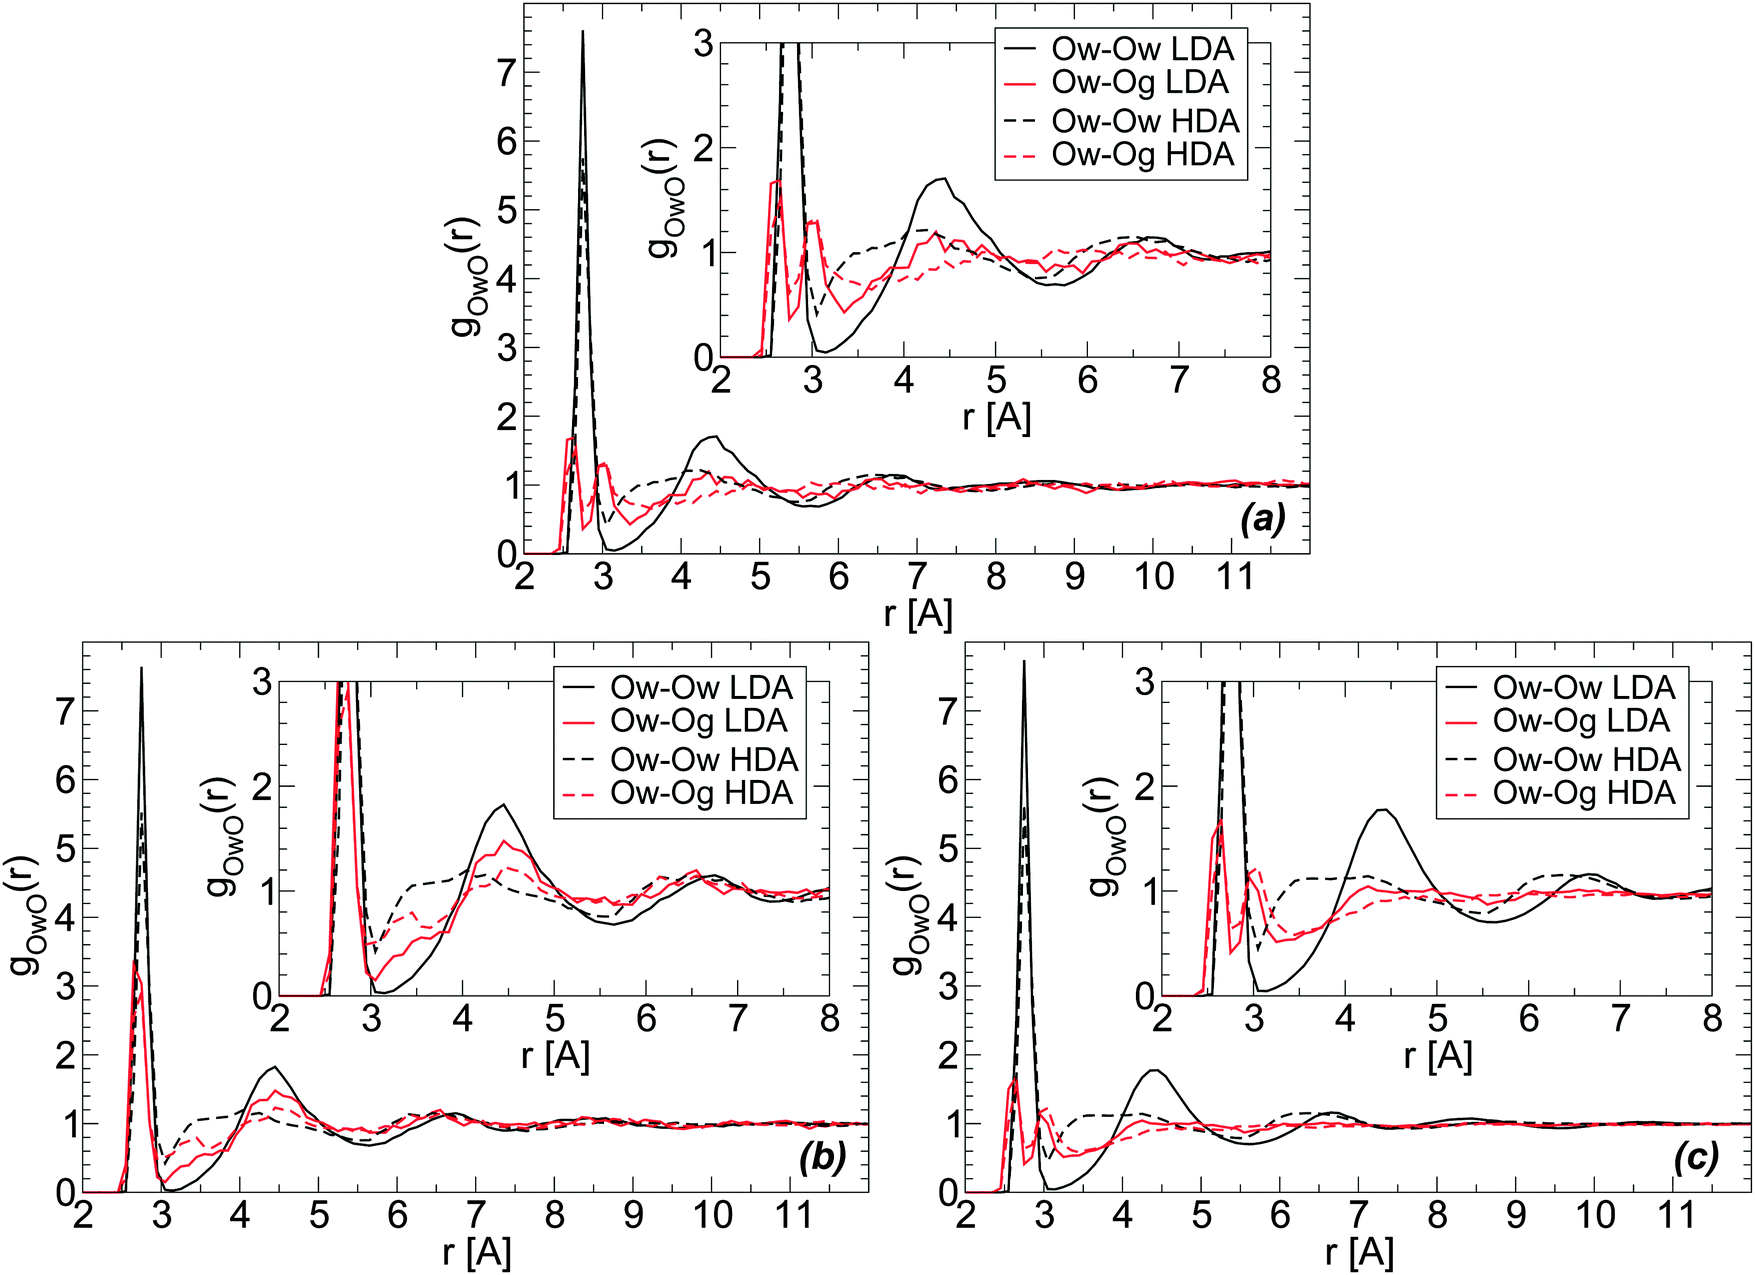 | ||
| Fig. 7 Radial distribution function of water (Ow) and glycerol (Og) oxygen atoms around water oxygens Ow from MD simulations using the (a) BC+TIP4P/2005 and (b) R+TIP4P/2005 mixture models at T = 80 K and P ≈ 0.1 MPa. χg = 3.06%, N = 729, and Ng = 23. (c) The same as (a) for a larger system, N = 5832 and Ng = 184 (χg = 3.06%). During the LDA-to-HDA transformation, the main change in both Ow–Og and Ow–Ow RDFs (red and black lines, respectively) is the decrease of the peak located at r ≈ 4.5 Å (second hydration shell of water) and decrease in the depth of the minimum located at r ≈ 3.2–3.5 Å (first interstitial shell of water). Insets are magnifications of the corresponding main panel. | ||
The structural changes accompanying the LDA–HDA transformation in pure water are well-known (see, e.g., ref. 18). Briefly, during the LDA-to-HDA transformation [black curves in Fig. 7(a), (b) or (c)] the HB network collapses with roughly one molecule displacing from the second hydration shell of LDA molecules (r ≈ 4.5 Å) towards the first hydration shell (r ≈ 2.8 Å), filling the first interstitial shell (r ≈ 3.5 Å). These structural changes are consistent with the Ow–Ow RDFs shown in Fig. 7(a); see also ref. 2. One may wonder, if similar structural changes occur next to glycerol's OH groups. Next, we show that indeed analogous changes in the water structure around glycerol OH groups occur, suggesting that glycerol OH groups may also contribute to the collapse of the HB network at the water–glycerol ‘interface’.
Fig. 7(a) and (b) show the Ow–Og RDFs for LDA and HDA (red curves) forms of glycerol–water mixtures with χg = 3.06%, obtained from MD simulations using the BC+TIP4P/2005 and R+TIP4P/2005 models. The main difference in the Ow–Og RDFs of these mixture models is that the first hydration shell of water, at approximately r < 3.5 Å, is characterized by a single maximum in the R+TIP4P/2005 mixture, as for the case of pure water, and by two maxima in the case of the BC+TIP4P/2005 mixture. The presence of a double-peak in the Ow–Og RDFs of the BC+TIP4P/2005 mixture is fully consistent with ref. 73 that finds a similar double-peak (at the same locations) in the RDFs of glycerol–water solutions at T = 300 K, P = 0.1 MPa, and χg = 42.9% and 60%. The glycerol model employed in ref. 73 is the BC model modified to include non-rigid CH and OH covalent bonds. We note that the differences in the Ow–Og RDFs of the BC+TIP4P/2005 and R+TIP4P/2005 mixture models are not unexpected. Indeed, in previous work we studied pure glycerol and water–glycerol mixtures in the liquid state using various glycerol and water models and found that the microscopic structure of the system is sensitive to the model employed.61,62
We note that regardless of the differences in the RDFs of LDA and HDA in the two models studied, both mixture models exhibit (water-like) structural changes during the LDA–HDA transformations. Specifically, Fig. 7(a) and (b) show that during the LDA-to-HDA transformation, the peak associated with the second hydration shell of water in the LDA mixture (solid red line), at r ≈ 4.3 Å, decreases while the minimum of the Ow–Og RDF at r ≈ 3.0–3.5 Å, corresponding to water molecules' first interstitial shell, becomes less shallow. These features are particularly evident in the case of the R+TIP4P/2005 mixture for which the Ow–Og RDFs resemble closer the Ow–Ow RDFs of pure water. It follows that, qualitatively, glycerol O atoms in the second shell of water molecules move towards water's first hydration shell, filling the first interstitial shell of water molecules. Not surprisingly, the changes in the Ow–Og RDFs (red lines) are less pronounced than in the case of Ow–Ow RDFs (black lines) since a water molecule is surrounded mainly by other water molecules.
The RDFs in Fig. 7(a) and (b) are obtained from a system composed of N = 729 and Ng = 23. For comparison, we include in Fig. 7(c) the Ow–Og RDFs for the BC+TIP4P/2005 mixture with N = 5832 and Ng = 184. A comparison of Fig. 7(a) and (c) shows that increasing the system size makes the RDFs smoother but the qualitative results hold. As we will show, the same conclusion applies to all RDFs.
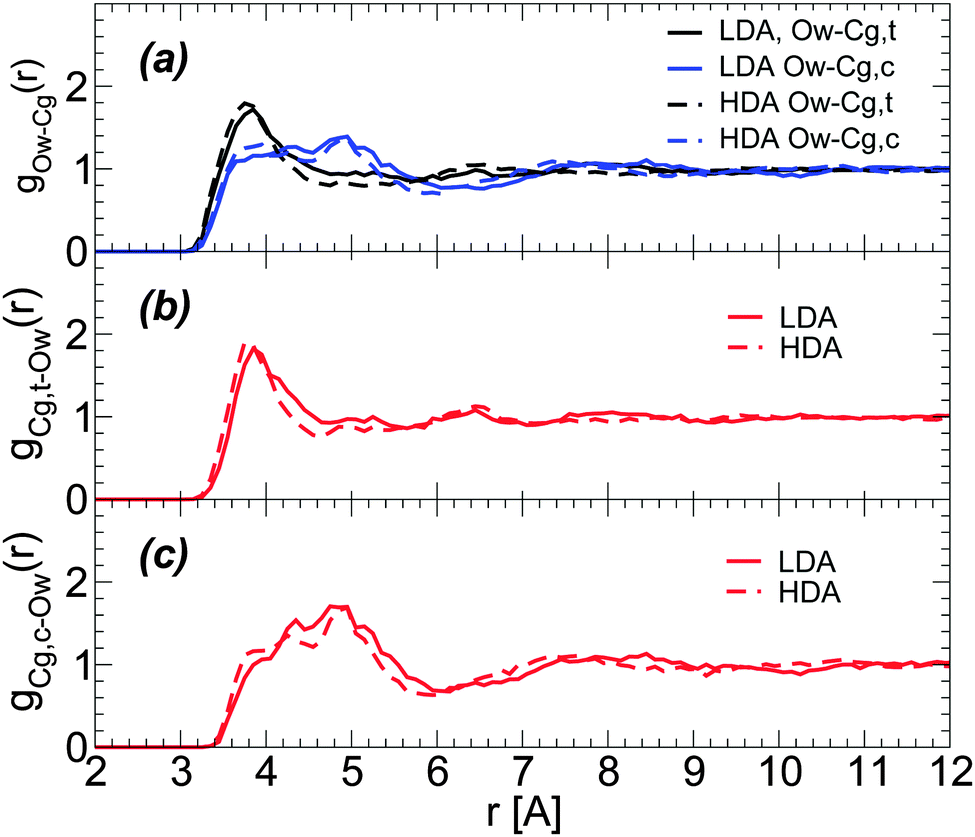
Glycerol has two terminal groups and one central OH group and hence, one may wonder if the collapse of the HB network is equally favored by both kinds of OH groups. We show that this is indeed the case by calculating the radial distribution of water oxygen atoms around glycerol central (Og,c–Ow) and terminal oxygens (Og,t–Ow). In the calculation of these RDFs, we remove the excluded volume effects due to the presence of the glycerol C–C–C backbone.74Fig. 8(a) and (b) show the Og,t–Ow and Og,c–Ow RDFs for the BC+TIP4P/2005 mixture; the corresponding RDFs for the case of R+TIP4P/2005 are shown in Fig. 8(c) and (d). The RDFs of the BC+TIP4P/2005 mixture for the case of the large system (N = 5832 and Ng = 184) are included in Fig. 8(e) and (f). In all cases, the structural changes next to glycerol's OH groups, accompanying the LDA-to-HDA transformation, seem to occur at both central and terminal OH groups of glycerol. This is supported by Fig. 8(e) and (f), where the noise is partially reduced due to the larger size of the system.
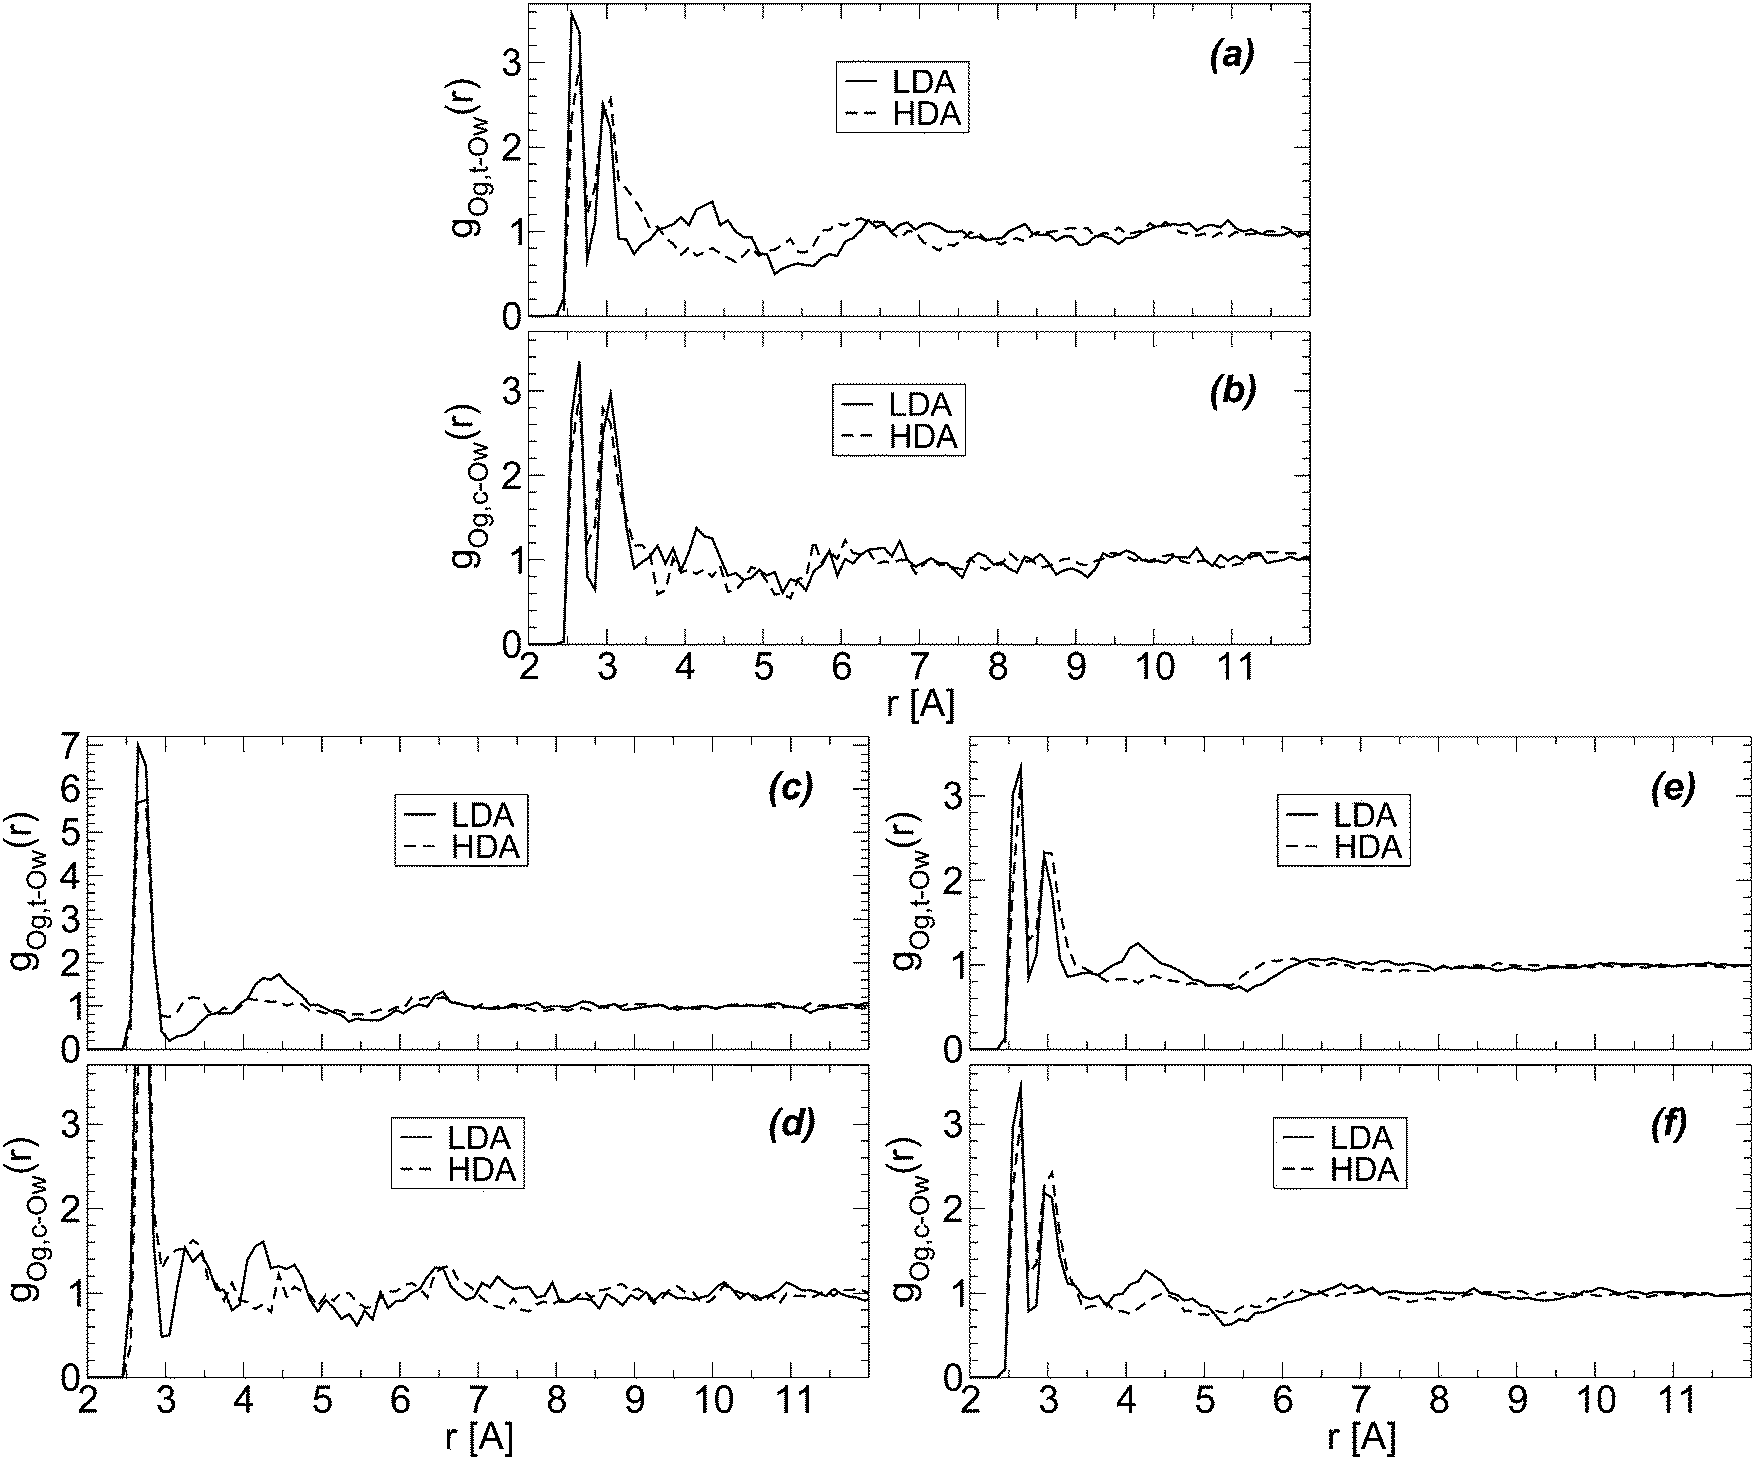 | ||
| Fig. 8 Radial distribution function of water oxygen (Ow) atoms around glycerol oxygens; Og,c and Og,t refer to glycerol central and terminal oxygens, respectively. Excluding volume effects due to the glycerol C–C–C backbone are taken into account.74 RDFs are for (a and b) BC+TIP4P/2005 and (c and d) R+TIP4P/2005 mixture models for a system of χg = 3.06%, N = 729, and Ng = 23. (e and f) The same as (a and b) for a larger system, N = 5832 and Ng = 184 (χg = 3.06%). T = 80 K and P ≈ 0.1 MPa. | ||
Characterizing the structural changes next to glycerol C atoms is less straightforward. This is partially because it is difficult to identify hydration shells for glycerol C atoms. Specifically, Fig. 9(a) shows that the radial distribution of glycerol C atoms around water O atoms is rather structureless for r > 6 Å, with only a clear first maximum at r ≈ 3.7 Å. During the LDA-to-HDA transformation, glycerol C atoms barely move towards water O atoms. Similar conclusions follow from the RDFs of water O atoms around glycerol central and terminal C atoms; see Fig. 9(b) and (c),74i.e., the first peak of the corresponding RDFs barely moves towards small values of r. We note that the RDFs in Fig. 9 are for the BC+TIP4P/2005 mixture (large system) but similar results hold in the case of the R+TIP4P/2005 mixture.
 | ||
| Fig. 9 (a) Radial distribution of glycerol carbon atoms around water oxygen (Ow) atoms for BC+TIP4P/2005 mixtures in the LDA and HDA states. Cg,c and Cg,t refer to glycerol central and terminal carbons, respectively. T = 80 K and P ≈ 0.1 MPa. RDFs are for a BC+TIP4P/2005 mixture with χg = 3.06%, for a system composed of N = 5832 water and Ng = 184 glycerol molecules. (b and c) Radial distributions of Ow atoms around Cg,c and Cg,t atoms (removing excluding volume effects due to the glycerol C–C–C backbone74). | ||
5.2 Glycerol conformations and hydrogen-bond network statistics
In this section we describe the microscopic structure of the water–glycerol mixtures in terms of glycerol conformations and HB network statistics. Glycerol is a flexible molecule and it is not evident what conformational changes it may adopt during the LDA–HDA transformation. Similarly, it is unclear how the water–glycerol HB network changes at the LDA–HDA transformation.We calculate the distribution of glycerol conformations during the compression/decompression cycles at all T and concentrations studied. Interestingly, in all cases, we find that the number of glycerol molecules in the αα, αβ, αγ, ββ, βγ, and γγ conformations remains practically constant at all pressures during the LDA-to-HDA and HDA-to-LDA transformations. The present MD simulations suggest a simple microscopic picture where cooling the glycerol–water solution at P = 0.1 MPa not only vitrifies the mixture at the macroscopic level but it also ‘vitrifies’ the conformation of glycerol molecules. Hence, our MD simulations suggest that glycerol molecules in the glass state may be thought of as ‘rigid’ molecules. It follows that the conformations of glycerol in the LDA and HDA mixtures are defined by the preparation process, i.e., by the cooling rate employed.
Next, we discuss the changes in the HB network of the glycerol–water mixtures accompanying the LDA–HDA transformations. We focus on the case of the BC+TIP4P/2005 mixture with N = 5832 and Ng = 184 since the larger the system, the more precise the HB network statistics. We employ the definition of HBs used in ref. 62, i.e., we assume that a HB between two OH groups is formed if (i) the O–O distance is dOO ≤ 3.5 Å and (ii) the distance between the acceptor O atom and the donated H atom is dOH ≤ 2.5 Å. We stress that the definition of the HB employed in computer simulations is rather arbitrary (see, e.g., ref. 75 and 76) and the specific values of 〈HB〉 in a particular state may vary (slightly) with the definition of the HB considered.77
The evolution of the HB network during the preparation of LDA (i.e., upon cooling the solution at P = 0.1 MPa at rate qc = 1 K ns−1, see Section 3) is shown in Fig. 10(a) and (b). Fig. 10(a) shows the average number of HBs (〈HB〉) formed by a glycerol molecule with water molecules, other glycerol molecules (intermolecular HBs), and within the glycerol molecule itself (intramolecular HBs). During the cooling process, glycerol molecules increase the total 〈HB〉 from ≈7.5 to ≈8.5. We note that this is close to the maximum number of HBs that a glycerol molecule is expected to form, i.e. ≈9 (or 3 HBs per OH group). Most of the changes in glycerol HBs occur at T > 200 K, i.e., in the liquid state. At these temperatures, glycerol reduces the number of HBs with water and increases the number of HBs with other glycerol molecules. Interestingly, in the case of the BC+TIP4P/2005 model, glycerol molecules have, on average, ≈1.2 intramolecular HBs at all temperatures. We note that, in the glass state (approx T < 140 K), glycerol–glycerol and glycerol–water 〈HB〉 barely change with temperature, in agreement with the conformational changes shown in Fig. 3. For comparison, we also include in Fig. 10(b) the 〈HB〉 that a water molecule forms with glycerol and other water molecules. The changes in water 〈HB〉 are qualitatively similar to the corresponding changes in glycerol's 〈HB〉 [Fig. 10(a)] but much milder, barely noticeable. In particular, we note that with the present definition of HBs, water molecules have a total 〈HB〉 = 4, as expected for a perfect tetrahedral liquid/glass. The number of 〈HB〉 formed by a water molecule with glycerol is 0.1, i.e., on average one out of ten water molecules forms one HB with glycerol.
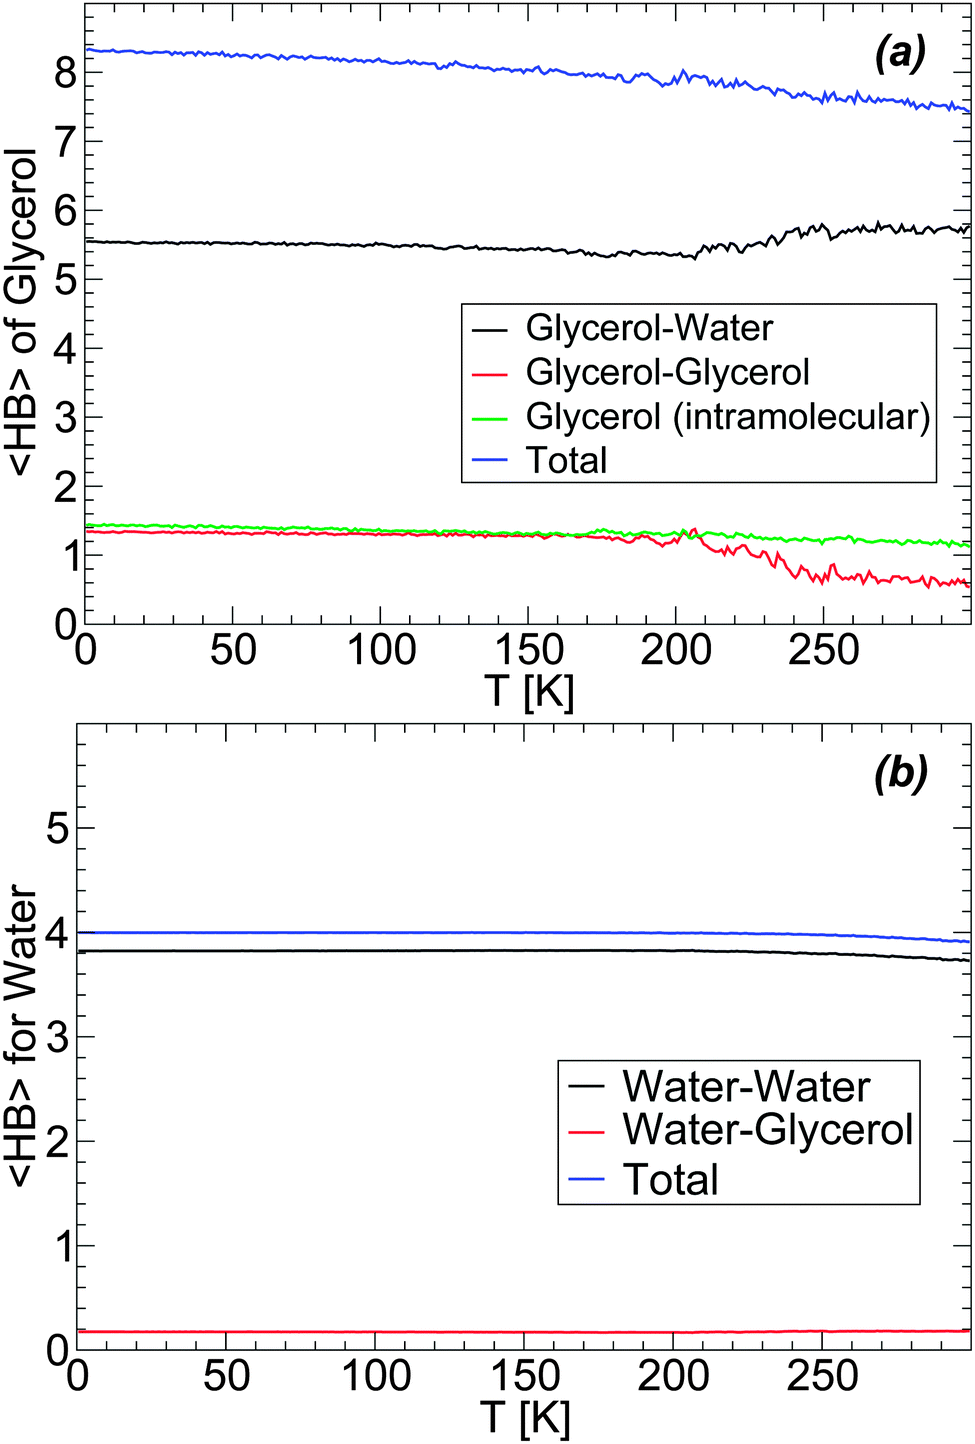 | ||
| Fig. 10 Average number of hydrogen bonds, 〈HB〉, of (a) glycerol and (b) water molecules upon cooling the BC+TIP4P/2005 solution at P = 0.1 MPa and rate qc = 1 K ns−1, from T = 300 K. The system is composed of N = 5832 water molecules and Ng = 184 glycerol molecules (χg = 3.06%). Practically no changes in the different 〈HB〉s occur in the glass state (approximately T < 140–150 K). | ||
The changes of glycerol and water 〈HB〉 during the compression-induced LDA-to-HDA transformation are shown in Fig. 11 for the case T = 80 K. In the case of glycerol [Fig. 11(a)], the intra- and inter-molecular glycerol–glycerol 〈HB〉 remain practically constant during compression and hence, pressure only affects the number of HBs that glycerol forms with water. During compression, glycerol 〈HB〉 increases continuously with most changes occurring once HDA is formed. The 〈HB〉 of the glycerol molecules with water increases by ≈2 when the mixture is compressed from P = 0.1 MPa (LDA) to P = 2000 MPa (HDA).
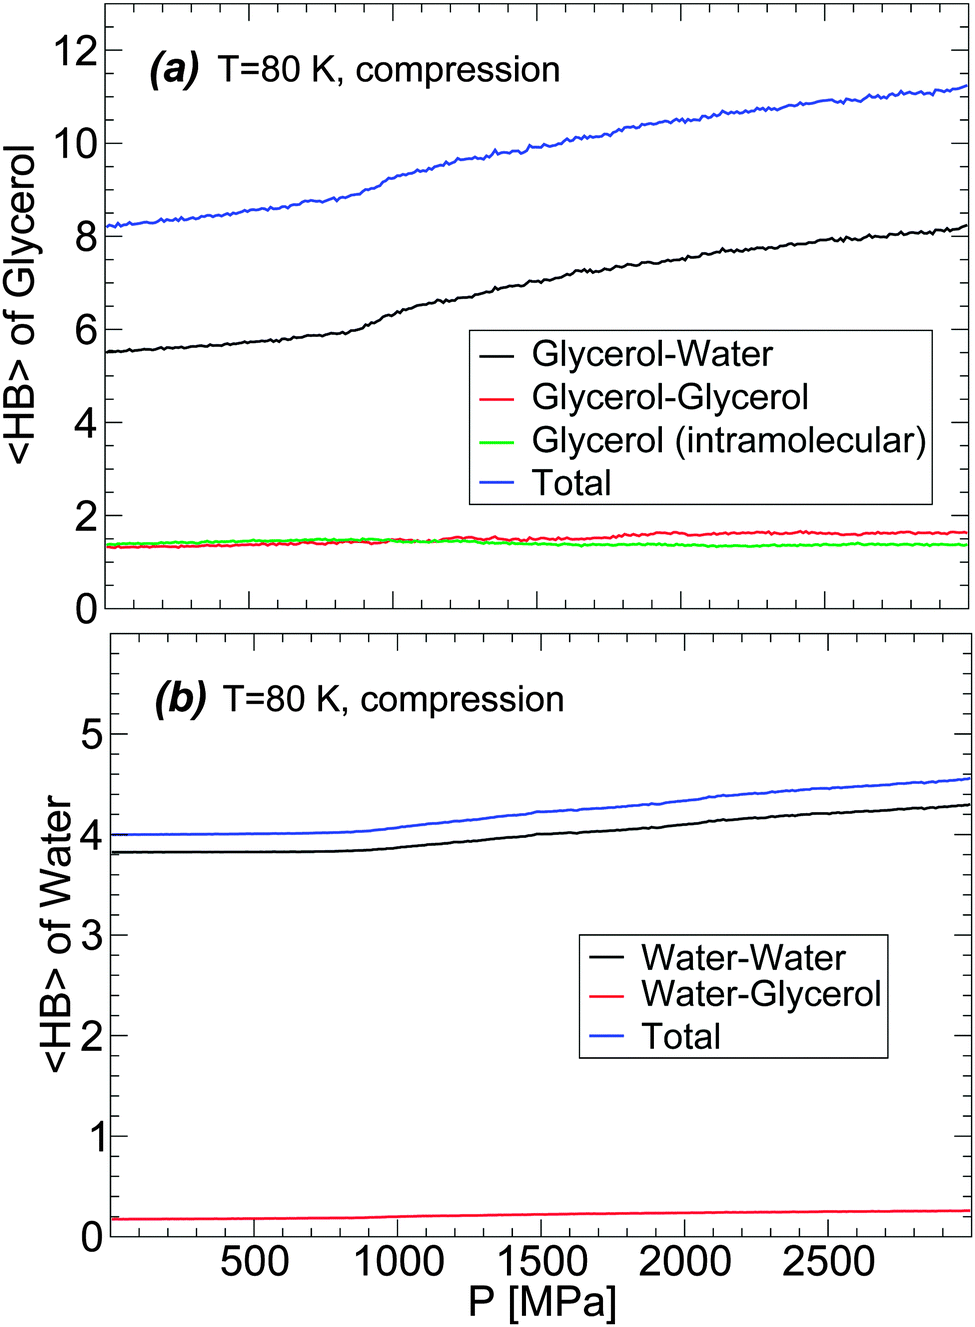 | ||
| Fig. 11 Average number of hydrogen bonds, 〈HB〉, of (a) glycerol and (b) water molecules upon compression of the BC+TIP4P/2005 solution at T = 80 K at rate qP = 100 MPa ns−1. In (a), we include the intramolecular 〈HB〉 of glycerol. The system is composed of N = 5832 water molecules and Ng = 184 glycerol molecules (χc = 3.06%). Most changes in the 〈HB〉 occur once HDA forms (approximately at P > 800 MPa). | ||
The changes in the average number of HBs of water during the LDA–HDA transformation are shown in Fig. 11(b). Not surprisingly, since most HBs of water are formed with other water molecules, the 〈HB〉 of water with glycerol is practically constant with pressure. Instead, water–water 〈HB〉 increases smoothly, with no discontinuity at the LDA–HDA transformation, from 〈HB〉 = 3.8 at P = 0.1 MPa (LDA) to 4.2 at P = 2000 MPa (HDA). It follows from Fig. 11(a) and (b) that the main changes in the mixture HB network are due to water, i.e., to changes in water–water and water–glycerol 〈HB〉.
In order to describe the effects of decompression on the HB network statistics, we include in Fig. 12(a) and (b) the total 〈HB〉 of water and glycerol during the compression/decompression cycle at T = 80 K; again, the main source of HB changes is from water–water and water–glycerol HBs. In the case of water, the total 〈HB〉 = 4–4.5 depending on pressure (0 ≤ P ≤ 3000 MPa). Interestingly, the 〈HB〉 of water in the LDA and HDA states, at P = 0.1 MPa, is ≈4 which is the value expected for a perfect tetrahedral network. Similarly, in the case of glycerol, 〈HB〉 increases by only ≈1 when going from LDA to recovered HDA at P = 0.1 MPa. These results suggest that the effect of pressure during the LDA–HDA transformation is not to change the connectivity (HBs) between molecules but to distort it. This may be unexpected given the large change in density during the transformation (≈10–20% for χ ≤ 5%). However, we note that the large density difference between LDA and recovered HDA mixtures is indeed accompanied by large changes in the coordination number (CN) of both glycerol and water; see Fig. 12(a) and (b).78 Specifically, at P = 0.1 MPa, the difference in CN of water molecules in the starting LDA and recovered HDA forms is ≈1.7.79 Similarly, in the case of glycerol, CN increases by ≈2.5.
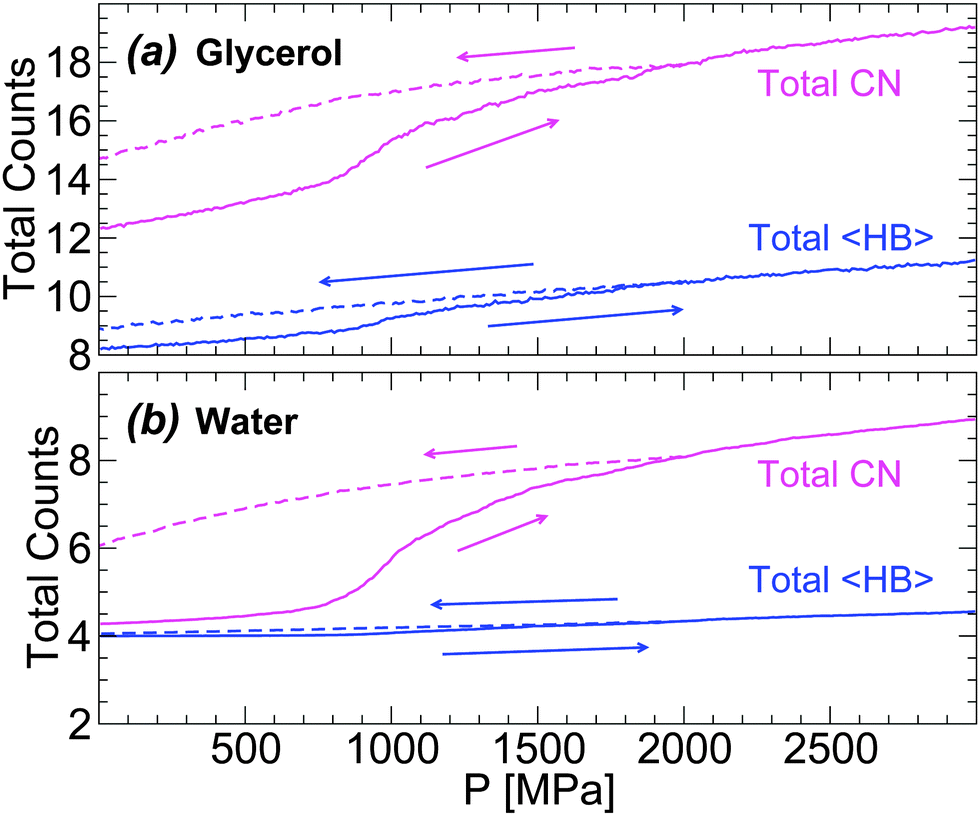 | ||
| Fig. 12 Total average number of hydrogen bonds, 〈HB〉, and coordination number, CN, of (a) glycerol and (b) water molecules during compression/decompression at T = 80 K at rate qP = 100 MPa ns−1. The system is composed of N = 5832 water molecules and Ng = 184 glycerol molecules (χc = 3.06%). At P = 0.1 MPa, water molecules in the starting LDA and recovered HDA have similar 〈HB〉 but show a large increase in CN. | ||
6 Summary and discussion
We present a detailed MD simulation study of glass polymorphism in water–glycerol mixtures at different temperatures and χg = 0–13%. The mixtures are prepared by isobaric hyperquenching at P = 0.1 MPa. Accordingly, there is no ice formation in our simulations. The present work is accompanied by an experimental study53 where we follow the same protocol employed here. However, in our experiments the cooling rates are much slower than those employed here and hence, crystallization occurs. The mixtures we simulate are homogeneous, similar to the experimental samples prepared in ref. 36 by cooling the solution under pressure.During the cooling process, the density of the final glassy mixtures rapidly increases with increasing glycerol content. For example, while the density of pure water LDA at T = 80 K is ≈0.95 g cm−3, close to the experimental value ≈0.94 g cm−3, the density of the mixture at χg = 7.01% is ≈1.12 g cm−3. This rapid increase in density of the hyperquenched mixtures with χg is critical because the density of the HDA form of the mixtures is practically independent of glycerol content (at least for χg ≤ 10%; see Fig. 6). Accordingly, the difference in density between the LDA and HDA forms of the mixtures vanishes rapidly with increasing glycerol content. For the present models and rates studied, we cannot clearly identify the LDA–HDA transformation at χg > χg,max ≈ 5%. This value is smaller than the maximum χg at which Suzuki and Mishima detect glass polymorphism, χg,max ≈ 10–12%. The absence of glass polymorphism with increasing glycerol content is also confirmed in the companion paper53 where the LDA–HDA transformation is shown to be absent at χg > 15%. The different values of χg,max found in our MD simulation and experiments could be due to (i) the different protocols used to prepare the LDA mixtures,36 (ii) the fast compression/decompression rates accessible to MD simulations (relative to experiments), and/or (iii) limitations of the mixture models employed. Nonetheless, the present MD simulations provide a simple explanation of the disappearance of glass polymorphism in glycerol–water mixtures (de-stabilization of the LDA mixture with increasing glycerol content). We stress that our MD simulations reproduce qualitatively the density changes observed experimentally during the pressure-induced LDA–HDA transformations36 (Fig. 4 and 5).
One of the more important contributions of this work is to provide a molecular-level characterization of the LDA–HDA transformation in glycerol–water mixtures. We found that during the LDA-to-HDA transformation, water molecules approach (a) other water molecules as well as (b) glycerol OH groups. Specifically, during the LDA-to-HDA transformation, water molecules move from the second hydration shell of a given water molecule towards its first hydration shell, filling the first interstitial shell of the given molecule. Similar structural changes seem to occur between water and glycerol OH groups, i.e., glycerol OH groups seem to move from the second hydration shell of a given water molecule towards its first hydration shell, filling the first interstitial shell of the given molecule. In this regard, glycerol OH groups play a similar role as water OH groups during the LDA-to-HDA transformation, i.e., the volume collapse of the system originates at the water–water and water–glycerol OH groups. This mechanism makes alcohols unique, different from non-hydrogen bonding solutes, such as salt–water solutions. Interestingly, in ionic aqueous solutions, water tends to form HDA (not LDA) upon cooling at low pressure.35,80 It also follows that molecules smaller than glycerol but with a high density of OH groups should favor glass polymorphism, provided they are also able to suppress crystallization. Candidates include, e.g., ethylene glycol and hydrogen peroxide. It follows that aqueous solutions containing ethylene glycol and hydrogen peroxide may be good solutions to search for LLPTs as well.
From the computational point of view, this work presents a detailed study of the role played by the glycerol model. This is technically important since glass polymorphism is very sensitive to the water model employed2,3,18,52 (the model we employed, the TIP4P/2005 water model, does a very good job in reproducing the experimental findings2). For the case of glycerol, we found that the FF indeed affects the molecular conformations adopted by glycerol molecules in the hyperquenched glasses. Moreover, these conformations remain unchanged during the compression/decompression cycles (i.e., glycerol molecules can be viewed as ‘rigid’ molecules once the mixture is in the glass domain). Nonetheless, we found that the thermodynamic changes occurring during the cooling (Fig. 2) and compression/decompression paths (Fig. 4) are not affected by the glycerol model employed. In addition, we found that the microscopic mechanism underlying the LDA-to-HDA transformation (i.e., filling of the water first interstitial shell; see the previous paragraph) holds for both glycerol models studied. These results are encouraging for future computational studies of binary aqueous solutions in the glass state that contain non-rigid organic molecules.
Appendix: system size effects on the pressure-induced LDA–HDA transformations
We discuss briefly whether our results obtained with out-of-equilibrium MD simulations are sensitive to the system size. Specifically, for the case of the BC+TIP4P/2005 mixture model with χg = 3.06%, we compare the density of the mixture for a system with Ng = 23 and N = 729 [Fig. 1(a) and 5(b)] with the densities obtained with a system 8 times larger, composed of Ng = 184 and N = 5182. That the structures of these mixtures are similar is confirmed by the RDFs shown in Fig. 7 and 8.The results are summarized in Fig. 13 and 14. Fig. 13 shows the density of both mixtures during cooling at P = 0.1 MPa with cooling rate qc = 1 K ns−1. The difference in density between the mixtures is <0.01 g cm−3 at all temperatures. This is smaller than the density difference found among independent LDA forms of pure TIP4P/2005 water (N = 512) obtained by following an identical cooling protocol as we employ in this work.2 Similarly, Fig. 14(a–c) show that the densities of the small and large systems practically overlap during the pressure-induced LDA–HDA transformations. Indeed, increasing the system size leads to smoother ρ(P), with smaller density fluctuations (as expected).
 | ||
| Fig. 13 Comparison of ρ(T) obtained upon cooling glycerol–water mixtures with the same concentration, χg = 3.06%, but with different system sizes. Simulations are performed using the BC+TIP4P/2005 model for a large system composed of Ng = 184 glycerol and N = 5832 water molecules and for a small system with Ng = 23 and N = 729. The cooling rate is qc = 1 K ns−1 and P = 0.1 MPa. Size effects on ρ(P) are negligible; the large system exhibits smaller fluctuations, as expected. Densities for the small system are taken from Fig. 1(a). | ||
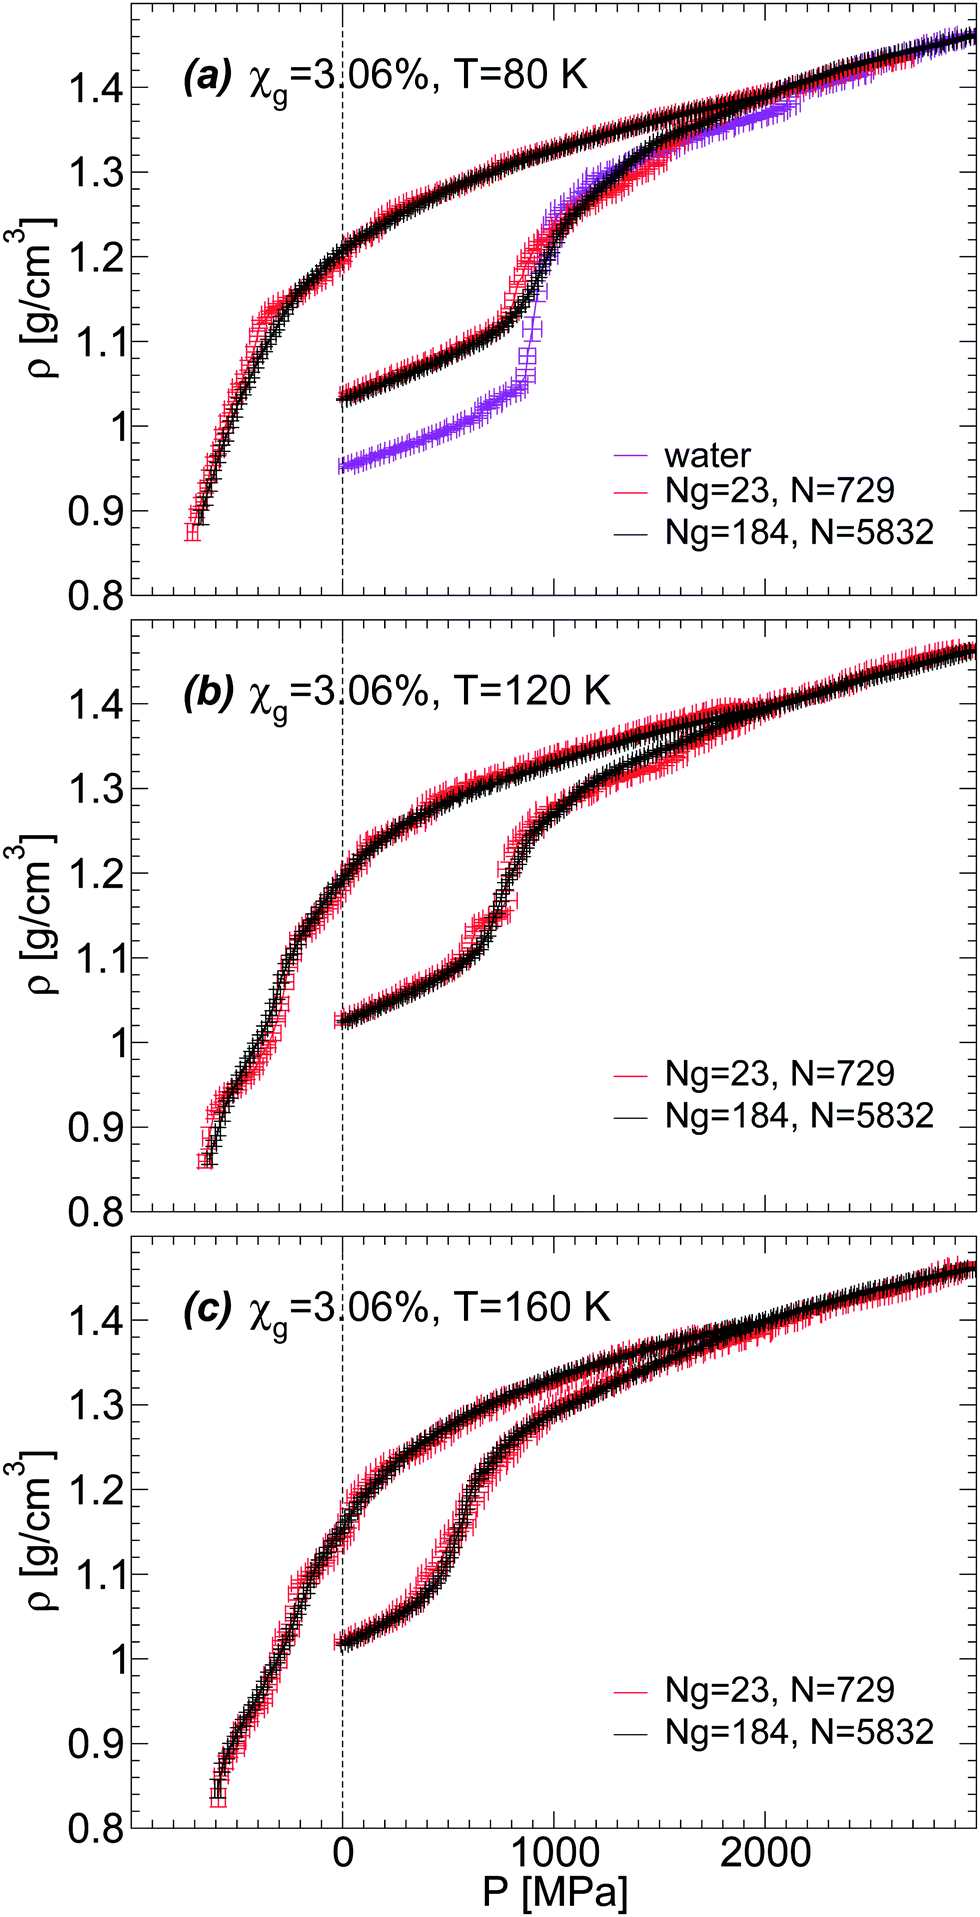 | ||
| Fig. 14 Density as a function of pressure during compression/decompression of glycerol–water mixtures of χg = 3.06% from MD simulations. Simulations are performed using the BC+TIP4P/2005 model for two different system sizes. The large system is composed of Ng = 184 glycerol and N = 5832 water molecules; the small system is composed of Ng = 23 and N = 729. The compression/decompression rate is qP = 100 MPa ns−1. Size effects on ρ(P) are negligible; the large system exhibits smaller fluctuations, as expected. Densities for the small system are taken from Fig. 5(b). | ||
Acknowledgements
Support for this project was provided by a PSC-CUNY Award, jointly funded by The Professional Staff Congress and The City University of New York. T. L. is grateful for financial support from the Austrian Science Fund FWF (bilateral project I1392). This research was supported, in part, under National Science Foundation Grants CNS-0959856, CNS-0958379 and CNS-0855217 and the City University of New York High Performance Computing Center at the College of Staten Island.References
- J. Zarzycki, Glasses and the Vitreous State, Cambridge University Press, Cambridge, U.K., 1991 Search PubMed.
- J. Wong, D. A. Jahn and N. Giovambattista, J. Chem. Phys., 2015, 143, 074501 CrossRef PubMed.
- J. Chiu, F. W. Starr and N. Giovambattista, J. Chem. Phys., 2013, 139, 184504 CrossRef PubMed.
- O. Mishima, L. D. Calvert and E. Whalley, Nature, 1985, 314, 76–78 CrossRef CAS.
- S. Klotz, Th. Strässle, R. J. Nelmes, J. S. Loveday, G. Hamel, G. Rousse, B. Canny, J. C. Chervin and A. M. Saitta, Phys. Rev. Lett., 2005, 94, 025506 CrossRef CAS PubMed.
- O. Andersson, Proc. Natl. Acad. Sci. U. S. A., 2011, 108, 11013–11016 CrossRef CAS PubMed.
- O. Mishima, J. Chem. Phys., 1994, 100, 5910–5912 CrossRef CAS.
- K. Winkel, M. Bauer, E. Mayer, M. Seidl, M. S. Elsaesser and T. Loerting, J. Phys.: Condens. Matter, 2008, 20, 494212 CrossRef.
- K. Winkel, E. S. Elsaesser, E. Mayer and T. Loerting, J. Chem. Phys., 2008, 128, 044510 CrossRef PubMed.
- M. M. Koza, H. Schober, H. E. Fischer, T. Hansen and F. Fujara, J. Phys.: Condens. Matter, 2003, 15, 321 CrossRef CAS.
- P. H. Poole, F. Sciortino, U. Essmann and H. E. Stanley, Nature, 1992, 360, 324–328 CrossRef CAS.
- P. H. Poole, U. Essmann, F. Sciortino and H. E. Stanley, Phys. Rev. E: Stat. Phys., Plasmas, Fluids, Relat. Interdiscip. Top., 1993, 48, 4605–4610 CrossRef CAS.
- J. L. Finney, A. Hallbrucker, I. Kohl, A. K. Soper and D. T. Bowron, Phys. Rev. Lett., 2002, 88, 225503 CrossRef CAS PubMed.
- J. Chiu, F. W. Starr and N. Giovambattista, J. Chem. Phys., 2013, 140, 114504 CrossRef PubMed.
- K. Ammann-Winkel, C. Gainaru, P. H. Handle, M. Seidl, H. Nelson, R. Böhmer and T. Loerting, Proc. Natl. Acad. Sci. U. S. A., 2013, 110, 17720–17725 CrossRef PubMed.
- N. Giovambattista, T. Loerting, B. R. Lukanov and F. W. Starr, Sci. Rep., 2012, 2, 390 Search PubMed.
- P. G. Debenedetti, J. Phys.: Condens. Matter, 2003, 15, R1669–R1726 CrossRef CAS.
- T. Loerting and N. Giovambattista, J. Phys.: Condens. Matter, 2006, 18, R919–R977 CrossRef CAS.
- C. A. Angell, Annu. Rev. Phys. Chem., 2004, 55, 559–583 CrossRef PubMed.
- O. Mishima and H. E. Stanley, Nature, 1998, 396, 329–335 CrossRef CAS.
- M. Grimsditch, Phys. Rev. Lett., 1984, 52, 2379–2381 CrossRef CAS.
- M. H. Bhat, V. Molinero, E. Soignard, V. C. Solomon, S. Sastry, J. L. Yarger and C. A. Angell, Nature, 2007, 448, 787–791 CrossRef CAS PubMed.
- H. W. Sheng, H. Z. Liu, Y. Q. Cheng, J. Wen, P. L. Lee, W. K. Luo, S. D. Shastry and E. Ma, Nat. Mater., 2007, 6, 192–197 CrossRef CAS PubMed.
- J. C. Palmer, F. Martelli, Y. Liu, R. Car, A. Z. Panagiotopoulos and P. G. Debenedetti, Nature, 2014, 510, 385–388 CrossRef CAS PubMed.
- Y. Liu, J. C. Palmer, A. Z. Panagiotopoulos and P. G. Debenedetti, J. Chem. Phys., 2012, 137, 214505 CrossRef PubMed.
- P. Poole, R. K. Bowles, I. Saika-Voivod and F. Sciortino, J. Chem. Phys., 2013, 138, 034505 CrossRef PubMed.
- F. Smallenburg and F. Sciortino, Phys. Rev. Lett., 2015, 115, 015701 CrossRef PubMed.
- A. Scala, F. W. Starr, E. La Nave, H. E. Stanley and F. Sciortino, Phys. Rev. E: Stat. Phys., Plasmas, Fluids, Relat. Interdiscip. Top., 2000, 62, 8016–8020 CrossRef CAS.
- F. Sciortino, E. La Nave and P. Tartaglia, Phys. Rev. Lett., 2003, 91, 155701 CrossRef PubMed.
- E. B. Moore and V. Molinero, Nature, 2011, 479, 506–508 CrossRef CAS PubMed.
- K. Winkel, E. Mayer and T. Loerting, J. Phys. Chem. B, 2011, 115, 14141–14148 CrossRef CAS PubMed.
- T. Loerting, V. Fuentes-Landete, P. H. Handle, M. Seidl, K. Ammann-Winkel, C. Gainaru and R. Böhmer, J. Non-Cryst. Solids, 2015, 407, 423–430 CrossRef CAS PubMed.
- O. Mishima and H. E. Stanley, Nature, 1998, 392, 164–168 CrossRef CAS.
- O. Mishima, Phys. Rev. Lett., 2000, 85, 334–336 CrossRef CAS PubMed.
- Y. Suzuki and O. Mishima, J. Chem. Phys., 2013, 138, 084507 CrossRef PubMed.
- Y. Suzuki and O. Mishima, J. Chem. Phys., 2014, 141, 094505 CrossRef PubMed.
- L. Liu, S.-H. Chen, A. Faraone, C.-W. Yen and C.-Y. Mou, Phys. Rev. Lett., 2005, 95, 117802 CrossRef PubMed.
- F. Mallamace, M. Broccio, C. Corsaro, A. Faraone, D. Majolino, V. Venuti, L. Liu, C.-Y. Mou and S.-H. Chen, Proc. Natl. Acad. Sci. U. S. A., 2007, 104, 424–428 CrossRef CAS PubMed.
- F. Mallamace, M. Broccio, C. Corsaro, A. Faraone, U. Wanderlingt, L. Liu, C.-Y. Mou and S.-H. Chen, J. Chem. Phys., 2006, 124, 161102 CrossRef CAS PubMed.
- E. Mamontov, C. J. Burnham, S.-H. Chen, A. P. Moravsky, C.-K. Loong, N. R. de Souza and A. I. Kolesnikov, J. Chem. Phys., 2006, 124, 194703 CrossRef CAS PubMed.
- X.-Q. Chu, A. I. Kolesnikov, A. P. Moravsky, V. Garcia-Sakai and S.-H. Chen, Phys. Rev. E: Stat., Nonlinear, Soft Matter Phys., 2007, 76, 021505 CrossRef PubMed.
- O. Mishima and Y. Suzuki, J. Chem. Phys., 2001, 115, 4199–4202 CrossRef CAS.
- J. W. Biddle, V. Holten and M. A. Anisimov, J. Chem. Phys., 2014, 141, 074504 CrossRef PubMed.
- S. Chatterjee and P. G. Debenedetti, J. Chem. Phys., 2006, 124, 154503 CrossRef PubMed.
- D. Corradini, M. Rovere and P. Gallo, J. Chem. Phys., 2010, 132, 134508 CrossRef CAS PubMed.
- P. Kumar, S. V. Buldyrev, F. W. Starr, N. Giovambattista and H. E. Stanley, Phys. Rev. E: Stat., Nonlinear, Soft Matter Phys., 2005, 72, 051503 CrossRef PubMed.
- P. Gallo, M. Rovere and S.-H. Chen, J. Phys. Chem. Lett., 2010, 1, 729 CrossRef CAS.
- K.-I. Murata and H. Tanaka, Nat. Mater., 2012, 11, 436–443 CrossRef CAS PubMed.
- I. Popov, A. Greenbaum, A. P. Sokolov and Y. Feldman, Phys. Chem. Chem. Phys., 2015, 17, 18063–18071 RSC.
- N. Giovambattista, H. E. Stanley and F. Sciortino, Phys. Rev. Lett., 2003, 91, 115504 CrossRef PubMed.
- N. Giovambattista, P. G. Debenedetti, F. Sciortino and H. E. Stanley, Phys. Rev. E: Stat., Nonlinear, Soft Matter Phys., 2005, 71, 061505 CrossRef PubMed.
- N. Giovambattista, H. E. Stanley and F. Sciortino, Phys. Rev. E: Stat., Nonlinear, Soft Matter Phys., 2005, 72, 031510 CrossRef PubMed.
- J. Bachler, V. Fuentes-Landete, D. A. Jahn, J. Wong, N. Giovambattista and T. Loerting, Phys. Chem. Chem. Phys., 2016 10.1039/C5CP08069J.
- J. L. F. Abascal and C. Vega, J. Chem. Phys., 2005, 123, 234505 CrossRef CAS PubMed.
- R. Chelli, P. Procacci, G. Cardini, R. G. D. Valle and S. Califano, Phys. Chem. Chem. Phys., 1999, 1, 871–877 RSC.
- J. Blieck, F. Affouard, P. Bordat, A. Lerbret and M. Descamps, Chem. Phys., 2005, 317, 253–257 CrossRef CAS.
- W. D. Cornell, P. Cieplak, C. I. Bayly, I. R. Gould, K. M. Merz, D. M. Ferguson, D. M. Spellmeyer, T. Fox, J. W. Caldwell and P. A. Kollman, J. Am. Chem. Soc., 1995, 117, 5179–5197 CrossRef CAS.
- S. Reiling, M. Schlenkrich and J. Brickmann, J. Comput. Chem., 1996, 17, 450–468 CrossRef CAS.
- R. E. Bruccoleri, B. D. Olafson, D. J. States, S. Swaminathan and M. Karplus, J. Comput. Chem., 1983, 4, 187–217 CrossRef.
- L. Nilsson and M. Karplus, J. Comput. Chem., 1986, 7, 591–616 CrossRef CAS.
- F. O. Akinkunmi, D. A. Jahn and N. Giovambattista, J. Phys. Chem. B, 2015, 119, 6250–6261 CrossRef CAS PubMed.
- D. A. Jahn, F. O. Akinkunmi and N. Giovambattista, J. Phys. Chem. B, 2014, 118, 11284–11294 CrossRef CAS PubMed.
- P. Brüggeller and E. Mayer, Nature, 1980, 288, 569–571 CrossRef.
- T. Loerting, W. Schustereder, K. Winkel, C. G. Salzmann, I. Kohl and E. Mayer, Phys. Rev. Lett., 2006, 96, 025702 CrossRef PubMed.
- M. Pagliaro and M. Rossi, The Future of Glycerol, Royal Society of Chemistry, Cambridge, U.K., 2010 Search PubMed.
- O. Bastiansen, Acta Chem. Scand., 1949, 3, 415–421 CrossRef CAS.
- J. J. Towey, A. K. Soper and L. Dougan, Phys. Chem. Chem. Phys., 2011, 13, 9397–9406 RSC.
- M. Soltwisch and B. Z. Steffen, Z. Naturforsch., A: Phys. Sci., 1981, 36, 1045–1051 Search PubMed.
- M. Garawi, J. C. Dore and D. C. Champeney, Mol. Phys., 1987, 62, 475–487 CrossRef CAS.
- C. S. Callam, S. J. Singer, T. L. Lowary and C. M. Hadad, J. Am. Chem. Soc., 2001, 123, 11743–11754 CrossRef CAS PubMed.
- R. Chelli, F. L. Gervasio, C. Gellini, P. Procacci, G. Cardini and V. Schettino, J. Phys. Chem. A, 2000, 104, 5351–5357 CrossRef CAS.
- A. B. Yongye, B. L. Foley and R. J. Woods, J. Phys. Chem. A, 2008, 112, 2634–2639 CrossRef CAS PubMed.
- A. V. Egorov, A. P. Lyubartsev and A. Laaksonen, J. Phys. Chem. B, 2011, 115, 14572–14581 CrossRef CAS PubMed.
- Specifically, for a given glycerol O atom (either Og,c or Og,t), we define a plane passing through the C atom of the corresponding C–OH group that is perpendicular to the CO covalent bond. Such a plane divides the system into two halves and we calculate the radial distributions of Ow atoms around the given Og atom by considering only the half of the system that contains the OH group.
- A. Luzar and D. Chandler, J. Chem. Phys., 1993, 98, 8160 CrossRef CAS.
- F. W. Starr, J. K. Nielsen and H. E. Stanley, Phys. Rev. Lett., 1999, 82, 2294 CrossRef CAS.
- An alternative definition of HBs employed in computer simulations of, e.g., water, is that two OH groups form a HB if (i′) dOO ≤ 3.5 Å and (ii′) the OHO angle ≤30°. Increasing the pressure shortens dOH while it may distort the local tetrahedral angle, affecting the OHO angles. Hence, one can expect that a definition of HBs based on the condition dOH ≤ 2.5 Å may lead to a slightly larger 〈HB〉 than a definition of HBs based on condition (ii′). As we explain in ref. 62, a HB definition that takes into consideration the OHO angles is not appropriate for our study since such a definition tends to omit the formation of intramolecular HBs of glycerol [glycerol internal (dihedral, bond, and angle) potential interactions constrain the OHO angles formed between two OH bonds of the same molecule to be larger than 20°].
- The CN of a water molecule is defined as the total number of O atoms from other water or glycerol molecules that are within a distance dOO ≤ 3.5 Å from the given water molecule's O. Similarly, the CN of the glycerol molecule is the total number of O atoms (from other glycerol or water molecules) within a distance dOO of any O of the given glycerol molecule.
- Experiments and simulations show that, in the case of pure water, the increase in water's CN in the LDA and recovered HDA mixtures at P = 0.1 MPa is ≈1.18 In these cases, HDA ice is decompressed usually from P0 < 1500 MPa. The value we find in the mixture with χg = 3.06% is ≈1.7 which is slightly larger. However, note that we decompress the mixtures from P0 = 2000 MPa and the density of recovered HDA increases slightly with increasing P052.
- G. N. Ruiz, L. E. Bove, H. R. Corti and T. Loerting, Phys. Chem. Chem. Phys., 2014, 16, 18553–18562 RSC.
| This journal is © the Owner Societies 2016 |