 Open Access Article
Creative Commons Attribution 3.0 Unported Licence
Degradation mechanism of a high-performance real micro gas sensor, as determined by spatially resolved XAFS†
Takahiro
Wada
 ab,
Naoyoshi
Murata
c,
Hiromitsu
Uehara
c,
Takuya
Suzuki
c,
Hiroaki
Nitani
d,
Yasuhiro
Niwa
d,
Motohiro
Uo
a and
Kiyotaka
Asakura
*e
aGraduate School of Medical and Dental Sciences, Tokyo Medical and Dental University, Tokyo 113-8549, Japan
bICAT Research Fellow, Institute for Catalysis, Hokkaido University, Sapporo 001-0021, Japan
cCorporate R & D Headquarters, Fuji Electric Co., Ltd, Tokyo 191-8502, Japan
dPhoton Factory, Institute of Materials Structure Science, High Energy Accelerator Research Organization (KEK), Tsukuba 305-0801, Japan
eInstitute for Catalysis, Hokkaido University, Sapporo 001-0021, Japan. E-mail: askr@cat.hokudai.ac.jp
First published on 9th February 2016
Abstract
Of late, battery-driven high-performance gas sensors have gained acceptability in practical usage, whose atomic-scale structure has been revealed by μ-fluorescence X-ray absorption fine structure analysis. We studied the chemical distribution of Pd species in the Pd/Al2O3 catalyst overlayer in the real gas sensor at various degrees of deterioration. In a freshly prepared sensor, all Pd species were in the PdO form; in a heavily deteriorated sensor, Pd/Al2O3 in the external region changed to metallic Pd particles, while the PdO structure in the inner region near the heater remained unchanged. The Pd species distribution was in agreement with the simulated thermal distribution. Temperature control was crucial to maintain the high performance of the gas sensor. The improved sensor allows homogeneous heating and has a lifetime of more than 5 years.
1. Introduction
Natural gas is now used as a household energy resource because it is user- and environment-friendly with low CO2 emission. In 2011, natural gas was used for 1/5th of residential energy consumption in Japan.1,2 For further spreading the use of natural gas as a residential energy resource, safety measures such as a gas-leakage sensor should be developed. SnO2 is the most important sensor material for such a purpose, because its electric conductivity changes with the gas composition at high temperatures.3 When reductive gases (such as methane, hydrogen, alcohol, and carbon monoxide) are present, the surface oxygen content decreases and more conduction electrons are created so that the gas conductivity increases. High temperatures are necessary for this surface reaction to occur and an AC power supply is required for heating the gas sensor. Moreover, the AC power supply hinders the daily use of the SnO2 gas sensor for domestic purposes because of the limited installation sites in a house and its bulkiness. Therefore, it is desirable that a battery-driven gas sensor with a long lifetime should be developed.Suzuki et al. developed a new SnO2 battery-driven sensor using a micro electro mechanical system (MEMS) to achieve low power consumption.4,5 The key factors of this MEMS are the use of catalysts and a pulsed heating system. The new battery-driven SnO2 sensor has a multilayer structure composed of a Pd/Al2O3 catalyst overlayer, a Pt–SnO2 catalyst layer, a SnO2 sensor layer, an electrode, and a heater, which are sequentially deposited on a Si chip, affording the sensor high sensitivity and selectivity for methane—the main ingredient of natural gas. In particular, Pd/Al2O3 increases the selectivity of the sensor for methane.6 Murata et al. developed a model sensor on a few-cm2 Si substrate, where a SnO2 thin layer and Pt–SnO2 and Pd/Al2O3 layers were deposited sequentially on the substrate. They characterized the structure under in situ conditions, where the sample was heated to high temperature in a flow of hydrogen or methane gas, using an X-ray absorption fine structure (XAFS).7,8 They found that their model sensor comprised atomically dispersed Pt in SnO2, which was the active species that enhanced the sensor activity, and that PdO was present in the Pd/Al2O3 catalyst overlayer and it increased the methane sensitivity of the sensor.
The selectivity of the sensor for methane decreased during the operations. Therefore, the lifetime of the battery-driven sensor was shorter than that of the battery itself. In order to understand the origin of the deterioration mechanism of the sensor, we characterized the structure of a real micro gas sensor using a μ-fluorescence X-ray absorption fine structure (μ-XAFS), with the spatial resolution in the order of a few tens of μm. The μ-XAFS with μm or nm resolution has been applied to various fields, e.g. catalysis9–13 and biomedical,14–17 geological and environmental sciences.18–20 In our previous report we found that PdO particles in the fresh μ-gas sensor were reduced to Pd metal as the methane selectivity decreased.13 Based on these results, we inferred that the Pd metal formation was responsible for the deterioration of the sensor performance. We had a question: why the methane selectivity was completely lost when the sensor still had plenty of PdO species? In order to answer this question, we further investigated the Pd structure and its change in each part of the Pd/Al2O3 overlayer present in the μ-gas sensor. We measured the Pd K-edge μ-XAFS using a micro beam and found that the Pd metal particle was not homogeneously distributed in the Pd/Al2O3 overlayer. We determined the distribution of PdO and the Pd metal inside the Pd/Al2O3 overlayer in the deteriorated sensor chip. In this paper, we discuss the origin of the loss of the methane selectivity of a high-performance μ-gas sensor and the importance of homogeneous heating in the μ-gas sensor.
2. Experimental
2.1. Samples
The μ-gas sensors were prepared as described in previous reports.4,5,7,13,21,22 The sample was heated by a pulsed heating system. When the sample was heated inhomogeneously, its selectivity decreased with time; however, when it was homogeneously heated at 703 K, its selectivity was not hampered. The overall Pd structure has been reported in a previous paper.13 The samples were subjected to a flow of 500 ppm H2 and 99% relative humidity (RH), which were more severe operation conditions than general operation conditions. Selectivity (Sel) is defined as follows:| Sel = Rhydrogen/Rmethane |
2.2. XAFS measurements
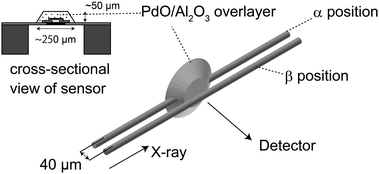
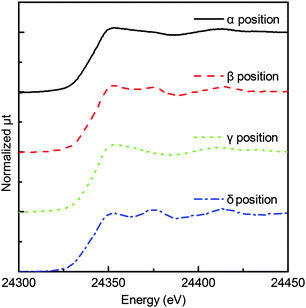
Pd K-edge μ-XAFS experiments were performed at the NW-10A beamline at the Photon Factory (Institute for Materials Structure Science, High Energy Accelerator Research Organization, KEK-IMSS-PF) using a Si(311) double-crystal monochromator in the fluorescence mode.23 The original beam size of this beam line was 1 mm × 1 mm. The X-ray beam was further focused by a polycapillary lens having a focal distance of 9.5 mm and a transmission efficiency of ∼8% at 25 keV (XOS Inc., USA), as described in a previous paper.13 The incident X-ray beam intensities were monitored by a 170 mm-long ionization chamber. The X-ray fluorescence was detected by a 19-element germanium solid state detector (Ortec, USA). The focal spot was about 25 μm in diameter (full-width at half-maximum, FWHM) measured by knife-edge scans. The XAFS spectra were analyzed using the REX2000 software (Ver. 2.5, Rigaku, Japan).24We set the X-ray parallel to the sensor base denoted as the α position (shown in Fig. 1), where the maximum-fluorescence X-ray intensity was obtained. In the α position, X-ray passes through the Pd/Al2O3 overlayer. Since the beam size was a little less than the thickness of the Pd/Al2O3 overlayer (40 μm), we shifted the sensor by 40 μm to ensure the beam glances the top surface region, as shown in Fig. 1 (denoted as the β position). We also set the incidence X-ray direction at 45° with the chip surface. We allowed the X-ray to pass through the central region which gives maximum-fluorescence X-ray intensity, with its position denoted as the γ position. The beam was shifted by 100 μm to pass it through the peripheral region of the Pd/Al2O3 overlayer (donated as the δ position), as shown in Fig. 2.
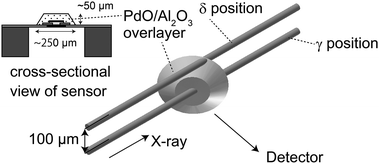 | ||
| Fig. 2 Alignments of an X-ray μ-beam and a μ-gas sensor. The sample was mounted vertically at 45° of the incident X-ray direction. | ||
3. Results
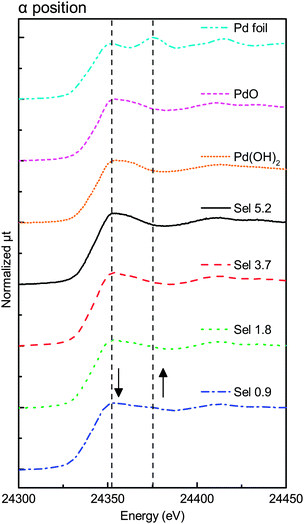
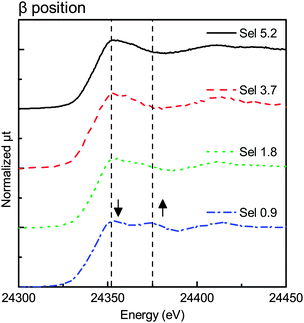
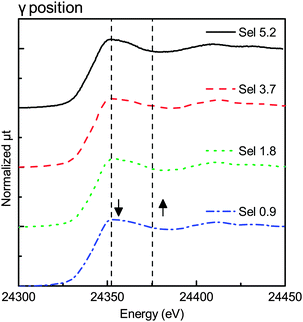
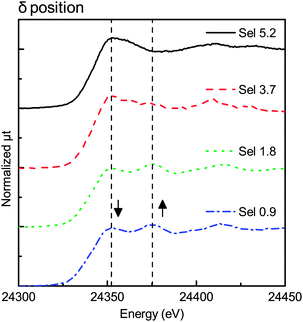
Fig. 3–6 show the X-ray absorption near-edge structure (XANES) spectra at various degrees of degradation in α, β, γ, and δ positions, respectively. In the Sel 5.2 sample (fresh sample), Pd was in the PdO form in all X-ray positions (α, β, γ, and δ positions).The XANES spectra in β and δ positions changed with the change in the degree of degradation. The first edge peak (24![[thin space (1/6-em)]](https://www.rsc.org/images/entities/char_2009.gif) 350 eV) decreased in intensity while the new structure appeared at the higher-energy side (24
350 eV) decreased in intensity while the new structure appeared at the higher-energy side (24![[thin space (1/6-em)]](https://www.rsc.org/images/entities/char_2009.gif) 375 eV). Fig. 4 shows the XANES spectra of the β position with different degradation degrees. As mentioned above, the peak at 24
375 eV). Fig. 4 shows the XANES spectra of the β position with different degradation degrees. As mentioned above, the peak at 24![[thin space (1/6-em)]](https://www.rsc.org/images/entities/char_2009.gif) 350 eV decreased in intensity with the increase of the peak at 24
350 eV decreased in intensity with the increase of the peak at 24![[thin space (1/6-em)]](https://www.rsc.org/images/entities/char_2009.gif) 375 eV. The XANES spectra of the Sel 0.9 sample had a feature characteristic of Pd foil.
375 eV. The XANES spectra of the Sel 0.9 sample had a feature characteristic of Pd foil.
On the other hand, Fig. 3 and 5 show no remarkable change in the XANES spectra, indicating that the Pd species were mostly in the PdO state in the α and γ positions. Although Fig. 5 shows little change in the spectra, the spectra in Fig. 3 had a small shoulder at 24![[thin space (1/6-em)]](https://www.rsc.org/images/entities/char_2009.gif) 375 eV, probably due to Pd metal in the α position. The change was observed only in the α position, indicating that the effect of the top surface region could be neglected because the thickness of the reduced metal portion on the top surface region was smaller than that of the reduced metal portion on the peripheral region.
375 eV, probably due to Pd metal in the α position. The change was observed only in the α position, indicating that the effect of the top surface region could be neglected because the thickness of the reduced metal portion on the top surface region was smaller than that of the reduced metal portion on the peripheral region.
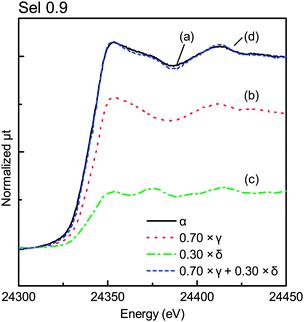
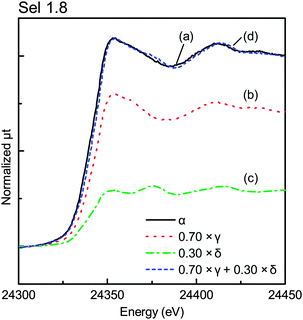
We carried out deconvolution analysis of the XANES spectra in the α position, where the spectra were composed of those of the central and peripheral regions. Assuming that the effect of the top surface region was negligible on the XANES spectra of the γ position, the XANES spectra at the body could be approximated as those of the γ position. The XANES spectra at the peripheral region could be considered equal to those of the δ position. The spectra at the α position could be expressed as shown in eqn (1):
| μα(E) = a × μγ(E) + (1 − a) × μδ(E) | (1) |
| 1 ≧ a ≧ 0 | (2) |
Fig. S1(a) and (b) (ESI†) show the three- (3D) and two-dimensional (2D) rough sketches of the Pd/Al2O3 overlayer on the gas sensor. The distance between the δ and the γ positions is ∼100 μm and the micro-beam spot is 25 μm in diameter, as shown in Fig. S1(c) (ESI†). Considering these positions, we defined the peripheral region as the dark-shaded ridge, as shown in Fig. S1 (ESI†), and the rest was defined as the center region, as shown in Fig. S1(d) (ESI†). Fig. S1(e) (ESI†) shows the 3D sketch of the central and the peripheral regions. Based on this rough assumption about the peripheral and the central regions, we calculated the contribution of these regions to X-ray absorption. The path lengths for the central and peripheral regions were ∼160 and ∼80 μm (=40 μm × 2), respectively, where both the peripheral regions are considered.
| a = 80/240 = 0.66 | (3) |
In addition to the peripheral region, the XAFS spectra in the β position show that the thin top surface region on the top of the gas sensor was also reduced. The X-ray was irradiated on the sample under glancing conditions to weaken the signal, but the spectra showed that PdO was reduced as the deactivation proceeded. Considering that the metal component was absent in the spectrum in the γ position, the thickness of the top surface region might be less than 1 μm.
As a result, the Pd/Al2O3 overlayer is roughly divided into 3 regions: the central region, the peripheral region, and the thin top surface region.
Fig. 9 shows the XANES of Sel 0.9 on each X-ray position. Only the spectrum in the γ position, corresponding to the central position, was similar to that of PdO and those in the β and δ positions were like the spectra of Pd foil rather than those of PdO, which in turn corresponded to the top surface and the peripheral regions, respectively.
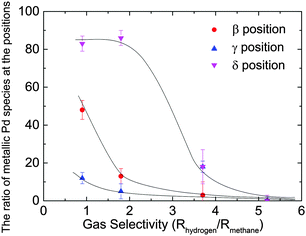
Table 1 shows the metallic Pd content of each sample calculated from the linear combination fitting of the Pd K-edge XANES spectra of Pd foil and PdO. We carried out two-component regression analysis since we found isosbestic points in the spectra shown in Fig. S3 (ESI†) though there were possibilities for the presence of other Pd oxide species. The errors in these calculations were estimated using the Hamilton ratio method at a confidence level of 95%.25 In the Sel 5.2 sample, we found PdO in all regions. The selectivity decreased with the increase of the metallic Pd content in the peripheral and the top surface regions.
| Target region | Top surface | Bulk | Peripheral | Average |
|---|---|---|---|---|
| Fresh (Sel 5.2) | 0 ± 3 | 0 ± 2 | 0 ± 3 | 0 (2 ± 3) |
| Sel 3.7 | 3 ± 7 | 18 ± 3 | 18 ± 9 | 18 ± 5 (14 ± 3) |
| Sel 1.8 | 13 ± 4 | 5 ± 4 | 86 ± 4 | 29 ± 4 (23 ± 4) |
| Sel 0.9 | 48 ± 5 | 12 ± 3 | 83 ± 4 | 36 ± 6 (38 ± 5) |
The average values of the metallic Pd content were calculated in the sample. Since the thickness of the top surface region was too small, metallic Pd contents in the two regions were averaged based on their volumes calculated from the 3D model, as shown in Fig. S1(e) (ESI†).
| Vc ∼ 7 × 105 μm3 |
| Vp ∼ 3 × 105 μm3 |
| Vs = 0 |
More than 80% of the PdO particles in the peripheral region for Sel 0.9 and Sel 1.8 samples were reduced to Pd metal, as shown in Fig. 10, while nearly 50% of the Pd particles in the β position were also reduced. Maybe the top surface region was too thin and the X-ray in the β position may include the central region information.
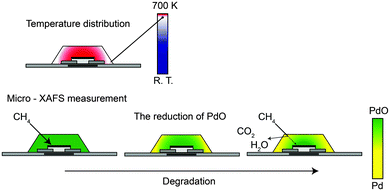
Finally, we have proposed the model structure of Pd/Al2O3 after degradation where PdO in the central region was covered with metallic Pd particles supported on Al2O3 in the peripheral and top surface regions, which are named as external regions hereafter. Such an inhomogeneous structure might have led to the effective deterioration of performance even though the majority of the Pd species was still in the PdO state. Interestingly the metal distribution corresponded to the simulated temperature distribution. The temperature simulation showed that there was a temperature difference of ∼70 K between the Pd/Al2O3 at the external regions and around the heater (703 K) as shown in Fig. S2 (ESI†).
4. Discussion
Previous research showed that the Pd/Al2O3 catalyst improved the selectivity of the sensor for methane6 and the formation of the Pd metal was related to the degradation of the sensor performance.13 The chemical state of Pd in Pd/Al2O3 is an important factor to determine the response of the sensor toward methane and other gases. PdO is more active than Pd metal for other gases (such as hydrogen, alcohol, and carbon monoxide).6,26–28Fig. 11 shows the degradation mechanism schematically. PdO in the Pd/Al2O3 overlayer can burn out other gases more quickly than methane so that methane reaches the SnO2 sensor through the Pd/Al2O3 overlayer because methane is the most inert gas. The formation of Pd metal in the external regions of the Pd/Al2O3 overlayer changes the selectivity of the sensor for methane. The methane gas is combusted by the Pd metal in the external regions. Consequently, methane cannot reach the sensor part and the sensor selectivity for methane decreases tremendously, even if PdO is mainly present in the Pd/Al2O3 catalyst overlayer. It is necessary to keep the PdO species in the external regions of the Pd/Al2O3 overlayer for selective combustion and to increase the sensor selectivity. It is necessary that the Pd metal should not be present in the external parts of the sensor for selective combustion and to increase the sensor selectivity.
Pd/Al2O3 in the external regions is more severely reduced than that in the central region because of the following two reasons: the first is that the regions are directly exposed to environmental gases, which always contain small amounts of reducing agents such as alcohol and oils. The second is that Pd is not heated up sufficiently to reach the desired temperature, say ∼703 K. We carried out temperature dependent in situ XAFS measurements on the Pd/Al2O3 film on Si under various atmospheres. We found that the PdO was partially reduced around 573 K in the 1000 ppm H2 containing air. The reduced PdO was reoxidized at more than ∼700 K.29 In the real senor, the temperature in the external regions might be decreased by 10%, which was not sufficient for the reoxidation. This work on μ-XAFS has clearly demonstrated that in order to maintain the high performance of the sensor, the entire sensor must be heated to 703 K. Pd metal has high activity to oxidize the methane, so it deteriorates the selectivity of the sensor for methane. We reported this μ-XAFS to the factory and they devised a homogeneous heating method by the modification of the structure of the Pd/Al2O3 overlayer. Consequently, the sensor lifetime has tremendously increased and reached a practically available level.13 In our previous study,13 we could not determine why small amounts of Pd metal species severely deteriorated the activity of the entire sensor, even though PdO was still a major component. Our present work on μ-XAFS has shown that a Pd metal barrier formed in the external regions of the Pd/Al2O3 overlayer effectively removed methane and hindered its arrival to the SnO2 layer. Consequently, the methane selectivity of the gas sensor decreased.
5. Conclusions
Each region in the real μ-gas sensor was measured by μ-XAFS using an X-ray μ-beam made by a polycapillary lens. The methane selectivity of the sensor decreased with time under severe operation conditions. We found that the PdO of the sensor was inhomogeneously reduced, which decreased the methane selectivity of the sensor. The reduction of the Pd species mainly occurred in the external regions of the Pd/Al2O3 overlayer. The Pd metal formed in the external regions combusted the methane gas completely, and hence, the methane gas could not approach the sensor part (i.e., the SnO2 thin layer). This work demonstrated that in order to understand the mechanism, it is important to analyze the inhomogeneity of the catalysts. The μ-XAFS is a powerful analytical tool that gives structural information on the inhomogeneity of the sensor that helps in understanding the catalytic mechanism of a real device such as a μ-gas sensor.Acknowledgements
All XAFS measurements were conducted at the Photon Factory, KEK, (PAC no. 2012G680). The investigation was performed under the support of the New Energy and Industrial Technology Development Organization (NEDO). This work was supported by JSPS KAKENHI (Grant Number 24890061 and 15K20426).References
- Ministry of Economy, Trade and Industry, Japan's Energy White Paper 2014 (Japanese), 2014, 144–154.
- 2010 Energy Statistics Yearbook, http://unstats.un.org/UNSD/energy/yearbook/default.htm, accessed Jun. 5.
- C. X. Wang, L. W. Yin, L. Y. Zhang, D. Xiang and R. Gao, Sensors, 2010, 10, 2088–2106 CrossRef CAS PubMed.
- T. Suzuki, K. Kunihara, M. Kobayashi, S. Tabata, K. Higaki and H. Ohnishi, Sens. Actuators, B, 2005, 109, 185–189 CrossRef CAS.
- S. Tabata, K. Higaki, H. Ohnishi, T. Suzuki, K. Kunihara and M. Kobayashi, Sens. Actuators, B, 2005, 109, 190–193 CrossRef CAS.
- J. C. Kim, H. K. Jun, J.-S. Huh and D. D. Lee, Sens. Actuators, B, 1997, 45, 271–277 CrossRef CAS.
- N. Murata, T. Suzuki, M. Kobayashi, F. Togoh and K. Asakura, Phys. Chem. Chem. Phys., 2013, 15, 17938–17946 RSC.
- N. Murata, M. Kobayashi, Y. Okada, T. Suzuki, H. Nitani, Y. Niwa, H. Abe, T. Wada, S. Mukai, H. Uehara, H. Ariga, S. Takakusagi and K. Asakura, Rev. Sci. Instrum., 2015, 86, 034102 CrossRef PubMed.
- J.-D. Grunwaldt and A. Baiker, Catal. Lett., 2005, 99, 5–12 CrossRef CAS.
- J.-D. Grunwaldt, B. Kimmerle, A. Baiker, P. Boye, C. G. Schroer, P. Glatzel, C. N. Borca and F. Beckmann, Catal. Today, 2009, 145, 267–278 CrossRef CAS.
- M. Tada, N. Ishiguro, T. Uruga, H. Tanida, Y. Terada, S.-i. Nagamatsu, Y. Iwasawa and S.-i. Ohkoshi, Phys. Chem. Chem. Phys., 2011, 13, 14910–14913 RSC.
- L. Mino, E. Borfecchia, C. Groppo, D. Castelli, G. Martinez-Criado, R. Spiess and C. Lamberti, Catal. Today, 2014, 229, 72–79 CrossRef CAS.
- T. Wada, N. Murata, T. Suzuki, H. Uehara, H. Nitani, Y. Niwa, M. Uo and K. Asakura, Nano-Micro Lett., 2015, 7, 255–260 CrossRef.
- M. Uo, K. Asakura, K. Watanabe and F. Watari, Chem. Lett., 2010, 39, 852–853 CrossRef CAS.
- T. Sugiyama, M. Uo, T. Wada, D. Omagari, K. Komiyama, T. Noguchi, Y. Jinbu and M. Kusama, BioMetals, 2015, 28, 11–20 CrossRef CAS PubMed.
- T. Sugiyama, M. Uo, T. Wada, D. Omagari, K. Komiyama, S. Miyazaki, C. Numako, T. Noguchi, Y. Jinbu, M. Kusama and Y. Mori, Sci. Rep., 2015, 5, 10672 CrossRef PubMed.
- I. J. Pickering, R. C. Prince, D. E. Salt and G. N. George, Proc. Natl. Acad. Sci. U. S. A., 2000, 97, 10717–10722 CrossRef CAS PubMed.
- N. Fukuda, A. Hokura, N. Kitajima, Y. Terada, H. Saito, T. Abe and I. Nakai, J. Anal. At. Spectrom., 2008, 23, 1068–1075 RSC.
- S. Kikuchi, H. Makita, S. Mitsunobu, Y. Terada, N. Yamaguchi, K. Takai and Y. Takahashi, Chem. Lett., 2011, 40, 680–681 CrossRef CAS.
- M. J. Pushie, I. J. Pickering, M. Korbas, M. J. Hackett and G. N. George, Chem. Rev., 2014, 114, 8499–8541 CrossRef CAS PubMed.
- T. Suzuki, K. Onodera, F. Inoue and K. Tsuda, Jpn. Pat., JP3812215, 2006 Search PubMed.
- T. Suzuki, K. Onodera, F. Inoue and K. Tsuda, Jpn. Pat., P4376093, 2009 Search PubMed.
- M. Nomura, Y. Koike, M. Sato, A. Koyama, Y. Inada and K. Asakura, AIP Conf. Proc., 2007, 882, 896–898 CrossRef CAS.
- T. Taguchi, AIP Conf. Proc., 2007, 882, 162–164 CrossRef CAS.
- W. C. Hamilton, Acta Crystallogr., 1965, 18, 502–510 CrossRef CAS.
- T. Maillet, C. Solleau, J. Barbier Jr and D. Duprez, Appl. Catal., B, 1997, 14, 85–95 CrossRef CAS.
- V. Choudhary, A. Gaikwad and S. Sansare, Catal. Lett., 2002, 83, 235–239 CrossRef CAS.
- M. G. Jones, T. G. Nevell, R. J. Ewen and C. L. Honeybourne, Appl. Catal., 1991, 70, 277–286 CrossRef CAS.
- N. Murata, PhD dissertation, Hokkaido University, Hokkaido, Japan, 2016.
Footnote |
| † Electronic supplementary information (ESI) available: Fig. S1: calculation of the volume of the central and peripheral regions. Fig. S2: simulation results of the temperature distribution of the Pd/Al2O3 overlayer. Fig. S3: the normalized Pd K-edge XANES spectra of Pd foil, PdO and the α position with various deterioration degrees. See DOI: 10.1039/c6cp00065g |
| This journal is © the Owner Societies 2016 |

