 Open Access Article
Creative Commons Attribution 3.0 Unported Licence
Carrier separation and charge transport characteristics of reduced graphene oxide supported visible-light active photocatalysts†
Ramalingam
Vinoth
a,
Peramaiah
Karthik
a,
Chellamuthu
Muthamizhchelvan
b,
Bernaurdshaw
Neppolian
*a and
Muthupandian
Ashokkumar
*c
aSRM Research Institute, SRM University, Kattankulathur, Kancheepuram 603203 (D.t.), Tamil Nadu, India. E-mail: neppolian.b@res.srmuniv.ac.in; Fax: +91-44-2745-6702; Tel: +91-44-2741-7916
bCenter for Materials Science and Nano Devices, Department of Physics, SRM University, Kattankulathur, Kancheepuram 603203 (D.t.), Tamil Nadu, India
cThe School of Chemistry, University of Melbourne, Parkville, Melbourne, Victoria 3010, Australia. E-mail: masho@unimelb.edu.au; Fax: +61-9347-5180; Tel: +61-8344-7090
First published on 15th January 2016
Abstract
Extending the absorption to the visible region by tuning the optical band-gap of semiconductors and preventing charge carrier recombination are important parameters to achieve a higher efficiency in the field of photocatalysis. The inclusion of reduced graphene oxide (rGO) support in photocatalysts is one of the key strategies to address the above-mentioned issues. In this study, rGO supported AgI–mesoTiO2 photocatalysts were synthesized using a sonochemical approach. The physical effects of ultrasound not only improved the crystallinity of AgI–mesoTiO2 but also increased the surface area and loading of the AgI–mesoTiO2 nanocomposite on rGO sheets. The low intense oxygen functionalities (C–O–C and COOH groups) peak observed in the high resolution C1s spectrum of a hybrid AgI–mesoTiO2–rGO photocatalyst clearly confirmed the successful reduction of graphene oxide (GO) to rGO. The interfacial charge transfer between the rGO and the p–n junction of heterostructured photocatalysts has decreased the band-gap of the photocatalyst from 2.80 to 2.65 eV. Importantly, the integration of rGO into AgI–mesoTiO2 composites serves as a carrier separation centre and provides further insight into the electron transfer pathways of heterostructured nanocomposites. The individual effects of photo-generated electrons and holes over rGO on the photocatalytic degradation efficiency of rhodamine (RhB) and methyl orange (MO) using AgI–mesoTiO2–rGO photocatalysts were also studied. Our experimental results revealed that photo-generated superoxide (O2−˙) radicals are the main reactive species for the degradation of MO, whereas photo-generated holes (h+) are responsible for the degradation of RhB. As a result, 60% enhancement in MO degradation was observed in the presence of rGO in comparison to that of the pure AgI–mesoTiO2 photocatalyst. This is due to the good electron acceptor and the ultrafast electron transfer properties of rGO that can effectively reduce the molecular oxygen to produce a large amount of reactive O2−˙ radicals. However, in the case of RhB degradation, h+ is the main reactive species which showed a slightly increased photocatalytic activity (12%) in the presence of rGO support where the role of rGO is almost negligible. This study suggests the effective roles of rGO for the degradation of organics, i.e., the rate of photocatalytic degradation also depends on the nature of compound rather than rGO support.
1. Introduction
Methyl orange (MO) and rhodamine B (RhB) are commonly used dyes in textile industries, which are toxic and carcinogenic in nature. The expulsion of these dyes to the ground water system by industries causes severe health issues. These textile dyes are very difficult to degrade because of their complex structures.1–3 The photocatalytic degradation of organic pollutants using semiconductor photocatalysts is one of the environmentally friendly techniques.4,5 TiO2 is the most promising photocatalyst owing to its attractive properties such as good catalytic activity, strong oxidizing capability, high stability and non-toxic nature.6,7 TiO2 with different nanostructures has been used as effective photocatalysts. Kim et al. reported that mesoporous TiO2 with a high surface area showed better photocatalytic performance than commercial Degussa P25 (TiO2).8In recent years, low band gap silver-halide (AgI, AgCl and AgBr) based composites have been used as visible light active photocatalysts.9–14 Among them, AgI has been considered as a promising visible light photocatalyst because of its smaller band gap than AgBr and AgCl.15 It has been intensively studied that β-AgI is a direct band-gap semiconductor, while AgBr and AgCl are indirect bandgap semiconductors. Hence, the absorption co-efficient of the direct bandgap semiconductor material is higher than indirect bandgap semiconductors.16 This suggests that direct bandgap materials are much more efficient for photocatalytic applications over indirect bandgap materials. The blending of AgI with TiO2 considerably shifts the absorption of TiO2 towards the visible region.17 Hu et al. synthesized visible light active AgI–TiO2 photocatalysts using the deposition–precipitation method for the degradation of azo dyes.18 Li et al. prepared highly efficient nanostructured AgI–TiO2 visible light active photocatalysts for the degradation of crystal-violet and 4-chlorophenol.19 The AgI–TiO2 composite was also prepared using the same deposition–precipitation method and it was found to be a stable photocatalyst with bactericidal properties under visible light irradiation.20 Moreover, AgI with different morphological structures has also been demonstrated as an effective visible light active photocatalyst.9,21
In order to further increase the photocatalytic activity of silver and silver halide based photocatalysts, graphene oxide (GO) has been used as a solid support.22 Graphene is a two dimensional material made up of carbon atoms with a honeycomb lattice structure. The two dimensional graphene sheets possess interesting electronic properties such as zero bandgap, high charge carrier mobility and zero effective mass.23–25 In addition to this, graphene could also dissociate the excited charge carrier at very fast rate to increase the photocatalytic activity. Recently, Wang et al. prepared the Ag–AgBr/TiO2/rGO nanocomposite using the solvothermal-photoreduction method and demonstrated it as an efficient photocatalyst for the degradation of penicillin G in the presence of visible light.26 Wang and co-workers synthesized visible light active AgBr coupled with graphene oxide sheets for the degradation of aqueous rhodamine B.27 However, there is no report available for the preparation of graphene supported AgI–TiO2 photocatalysts using ultrasound for the degradation of organic pollutants. As mentioned earlier, the use of AgI has several advantages over AgBr. The use of ultrasound during the preparation of metal–oxides could enhance the rate of hydrolysis and may lead to the formation of metal–oxide composites with improved crystalline phase, high surface area and controlled size distribution with unique morphologies, etc.28 Moreover, the shear forces produced by ultrasound helps in incorporating the metal and metal–oxide nanoparticles over rGO support.29 Hence, the current research work is mainly focused on the synthesis and photocatalytic properties of AgI–mesoTiO2–rGO photocatalysts.
2. Experimental section
2.1. Materials
Graphite flakes (particle size +100 mesh (≥75% min)) were purchased from Sigma Aldrich. Analytical grade silver nitrate and titanium tetraisopropoxide were purchased from SRL Chemicals, India and analytical grade potassium iodide was obtained from Rankem, India. All other reagents and solvents were of analytical grade and were used as received without any further purification.2.2. Synthesis of graphene oxide (GO)
GO was synthesized using modified Hummer's method.30 Briefly, 2 g of graphite powder and 1 g of NaNO3 were added to 46 mL of conc. H2SO4. This mixture was stirred for 30 min. 6 g of KMnO4 was then added under ice cold conditions to prevent the temperature not exceed 20 °C, after that this suspension was stirred at 35 °C for 30 min. Furthermore, 92 mL of deionized water was slowly added and the reaction mixture was heated up to 98 °C for 30 min. To remove excess KMnO4, an appropriate amount of 3% aqueous H2O2 solution was added dropwise into the mixture until no bubbles were observed. The mixture was centrifuged and washed with deionized water until neutral pH was reached. Finally, the collected product was freeze dried.2.3. Synthesis of mesoporous TiO2
Mesoporous TiO2 was prepared as reported in a previous report.31 In brief, titanium tetraisopropoxide (0.032 mol) and glacial acetic acid (0.016 mol) were dissolved in 20 mL of absolute ethanol and the mixture was stirred for 1 h. Then this mixture was added to 100 mL of deionized water drop by drop under sonication. During the whole process, the sonication cell was kept in an ice bath to avoid overheating. The mixture was sonicated for 3 h (3 s on, 1 s off, amplitude 40%) using a 13 mm diameter high intensity probe (Sonics and Materials, VCX-750, 20 KHz). The products were collected by centrifugation and washed with Milli-Q water several times and dried at 100 °C using a hot air oven. Finally, the as prepared powder was calcined at 400 °C for 1 h.2.4. Synthesis of AgI–mesoTiO2 and AgI–mesoTiO2–rGO composites
103 mg of KI and 500 mg of as prepared mesoporous TiO2 were added to 50 mL of DI water under constant stirring. Then this mixture was stirred for 30 min and then sonicated for 30 min using an ultrasonic bath (Labman scientific, 40 kHz, 250 W). To this mixture, a required amount of GO and 5 mL of 22 mg mL−1 AgNO3 solution were added. The above mixture was sonicated for 1 h, centrifuged, washed with Milli-Q water several times and dried at 80 °C for 12 h. Similarly, the AgI–mesoTiO2 photocatalyst was prepared as reported earlier with a minor modification.32 Finally, the prepared AgI–mesoTiO2 and AgI–mesoTiO2–rGO samples were calcinated at 350 °C for 2 h. For comparison, the AgI–mesoTiO2–rGO photocatalyst was also prepared in the absence of ultrasound.2.5. Characterization
Diffuse reflectance spectra (DRS) were recorded using a Shimadhzu UV-2600 UV-vis spectrophotometer in the DRS mode. X-ray diffraction (XRD) patterns were recorded on a PANaltical X'pert powder diffractometer using Cu Kα radiation. The morphological studies with energy dispersive spectrum (EDX) were analyzed using a Field Emission-Scanning Electron Microscope (FEI Quanta FEG 200 HR-SEM). Transmission electron microscopic (TEM) images were taken using JEM-2100 JEOL, Japan. Raman spectra were obtained using (Horiba Jobin Yvon) and He–Ne laser (λ = 630 nm). Fourier Transform Infrared (FTIR) analysis was carried out using a FTIR spectrophotometer (Agilent resolution pro). X-ray photoelectron spectroscopy (XPS) measurements were obtained using K-alpha instruments, USA, Al as a source, size 400 microns and range 0 to 1350 eV. The surface area and average pore size of the photocatalyst were measured using a Quantachrome Nova-1000 surface analyzer. The photocatalytic degradation of MO and RhB was monitored using a UV-visible spectrophotometer (Specord-200 plus, Analytikjena, Germany).2.6. Photocatalytic activity
For photocatalytic degradation reaction, methyl orange (MO) and rhodamine (RhB) were chosen as model pollutants. 80 mg of the prepared photocatalyst was added to 80 mL of aqueous solution containing the appropriate dye (10 mg L−1 for MO and 5 mg L−1 for RhB). Prior to reaction, the dye solution with catalysts was stirred in the dark for 30 min to attain adsorption–desorption equilibrium. The light source used for degradation was a 150 W tungsten lamp (λ > 420 nm) [Heber scientific, India]. Samples were collected at regular time interval during irradiation, centrifuged and the clear solutions were transferred to a 3 mL quartz cuvette for measuring absorbance.2.7. Photoelectrochemical studies
Photoelectrochemical measurements were carried out using an electrochemical workstation (CHI608E) in a conventional three electrode configuration with Pt-wire and Ag/AgCl (in saturated KCl) as counter and reference electrodes, respectively. A 250 W Xe arc lamp (OSRAM, Germany) was utilized as the light source. A 0.1 M Na2SO4 aqueous solution was used as the electrolyte. For the preparation of the working electrode, 50 mg of the photocatalyst was ground with 150 μL of PEG (MW 400) and 125 μL of ethanol to make slurry. Then, the slurry was coated on a 2.5 × 2.5 cm2 fluorine-doped tin oxide (FTO) glass substrate with an active area of about 1 × 1 cm2 by the doctor-blade method using scotch tape as a spacer. Finally, the electrode was dried in an oven and annealed at 350 °C for 45 min.3. Results and discussion
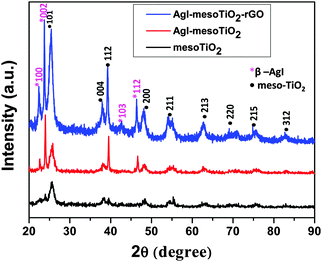
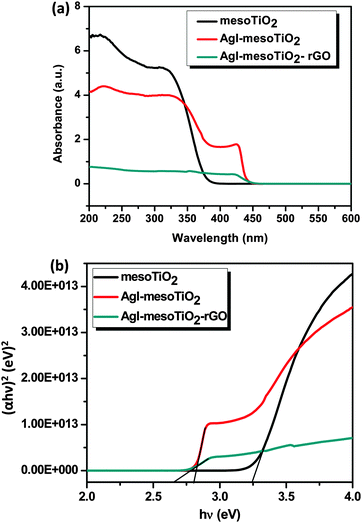
The XRD data of the synthesized photocatalysts are shown in Fig. 1. The mesoTiO2 exhibits characteristic diffraction peaks at 2θ values of 25.8, 38, 39.5, 48, 55, 62.6, 69.7, 75.7 and 83°, which correspond to (101), (004), (112), (200), (211), (213), (220), (215) and (312) planes, respectively. This result confirms that mesoTiO2 exists in all the composites in a pure anatase form (JCPDS Card #: 89-4921). The AgI nanoparticles in the composite show the diffraction patterns at 22.6, 24, 43 and 46.6° corresponding to the (100), (002), (103) and (112) planes, which could be attributed to the β-AgI structure (JCPDS Card #: 78-1614).19 It is seen that β-AgI is the most prominent phase in both AgI–mesoTiO2 and AgI–mesoTiO2–rGO composites. During calcination at 350 °C, oxygen rich functional groups (epoxy groups) present on GO surfaces were reduced and rGO was obtained.33 However, no characteristic XRD peak for rGO was observed. This might be attributed to a less loading amount of rGO (4 wt%).34–36 It is also very difficult to distinguish the diffraction pattern of rGO from the broader (101) plane of anatase TiO2.37Fig. 2(a) shows the UV-vis absorption spectra of the prepared photocatalysts recorded in DRS mode. The absorption edge of mesoTiO2 is observed at 382 nm, whereas both AgI–mesoTiO2 and AgI–mesoTiO2–rGO composites exhibit a red shift and its absorption edge corresponds to 440 and 470 nm, respectively. This shift in the absorption edge is due to the presence of AgI nanoparticles and rGO. Huang et al. reported that the chemical bonding between TiO2 and active sites of graphene causes a red shift in the absorption edge.35 Zhang et al. reported that the addition of graphene with P25-TiO2 shifted the absorption edge towards a higher wavelength region.38 As can be seen in Fig. 2(b), the calculated bandgap energies of mesoTiO2, AgI–mesoTiO2 and AgI–mesoTiO2–rGO are 3.24, 2.80 and 2.65 eV, respectively. The slightly reduced bandgap of rGO loaded composite implies that unpaired π electrons from graphene may bond with free electrons of TiO2. Meng et al. reported that graphene in Ag2Se/TiO2 nanocomposites shifted the bandgap toward the visible region.39
The valence band (VB) and the conduction band (CB) potentials of semiconductors are two important factors for the effective separation of photogenerated electron–hole pairs to generate ˙OH radicals and superoxide anions. The VB and CB potential edges were calculated using the following empirical formulae.40,41
| EVB = χ − Ee + 0.5(Eg) |
| ECB = EVB − Eg |
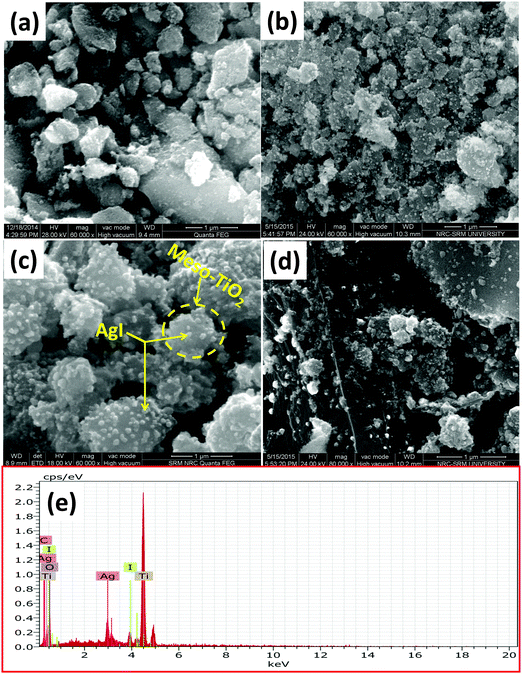
FE-SEM micrographs of mesoTiO2, AgI–mesoTiO2 and AgI–mesoTiO2–rGO photocatalysts are shown in Fig. 3(a–d). As shown in Fig. 3(b) and (c) the small spherical shaped AgI nanoparticles are well anchored as well as uniformly distributed on the surface of TiO2 nanoparticles. It can be clearly seen from Fig. 3(c), rGO supported AgI–mesoTiO2 prepared in the presence of ultrasound shows the formation of controllable and uniform thickness of the nanoparticles.42 However, the same nanocomposites prepared in the absence of ultrasound shows irregular-shaped nanoparticle formation as displayed in Fig. 3(d). As shown in Fig. 3(e), the elemental X-ray analysis suggests that the rGO loaded composite composed of Ti, Ag, I, C and O.
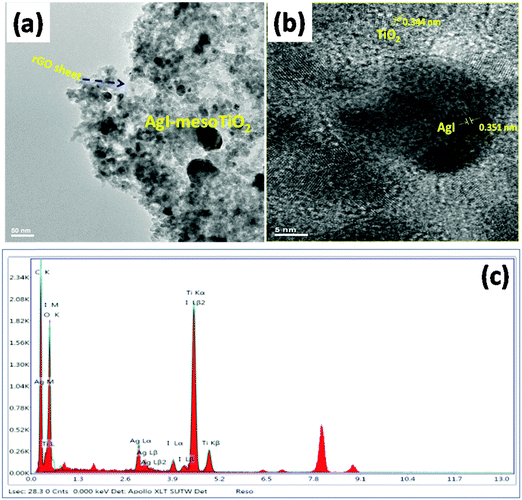 | ||
| Fig. 4 (a) TEM images of synthesized AgI–mesoTiO2–rGO, (b) magnified view image of AgI–mesoTiO2–rGO and (c) EDX of the AgI–mesoTiO2–rGO photocatalyst. | ||
The TEM images of the prepared AgI–mesoTiO2–rGO are shown in Fig. 4(a) and (b). It can be clearly seen from Fig. 4(a) that the prepared nanocomposites are uniformly distributed on the rGO sheet. The average crystalline size of the AgI nanoparticle and mesoTiO2 is 11 and 31 nm. The magnified view of the AgI–mesoTiO2–rGO sample is given in Fig. 4(b). The interplanar spacing values of TiO2 and AgI nanoparticles are 0.344 nm and 0.351 nm, which correspond to the (101) plane of the anatase TiO2 and β-AgI structure.19 This result is consistent with the XRD data. The TEM EDX [Fig. 4(c)] spectrum reconfirms that the AgI–mesoTiO2–rGO composite is composed of Ti, Ag, I, C and O.
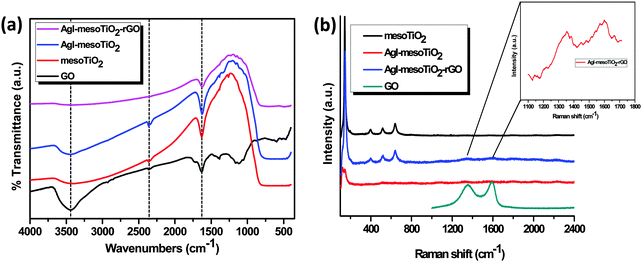
The FTIR spectra of GO, mesoTiO2, AgI–mesoTiO2 and AgI–mesoTiO2–rGO are shown in Fig. 5(a). The FTIR spectrum of GO exhibits a broad absorption band located at ∼3440 cm−1, which corresponds to the stretching vibration of hydroxyl groups. The absorption peaks observed at 1631 and 1384 cm−1 are associated with the stretching vibration of aromatic C![[double bond, length as m-dash]](https://www.rsc.org/images/entities/char_e001.gif) C and the bending vibration of O–H groups, respectively.43 The absorption peaks centered at 1733, 1054 and 1118 cm−1 are related to the stretching vibrations of C–O, C–OH and C
C and the bending vibration of O–H groups, respectively.43 The absorption peaks centered at 1733, 1054 and 1118 cm−1 are related to the stretching vibrations of C–O, C–OH and C![[double bond, length as m-dash]](https://www.rsc.org/images/entities/char_e001.gif) O groups, respectively.44 The broad absorption band observed at around 350–750 cm−1 for all the photocatalysts except GO corresponds to the characteristic vibrations of TiO2. In addition, a broad band at 3441 and a sharp peak at 1624 cm−1 are assigned to the vibrations of surface adsorbed water moieties and hydroxyl groups present over TiO2.31 The FTIR spectra of AgI–mesoTiO2 and AgI–mesoTiO2–rGO photocatalysts show an absorption band at 390–560 cm−1 which is assigned to the Ag–I bond. More interestingly, the AgI–mesoTiO2–rGO photocatalyst exhibits only the characteristic peaks of TiO2 and AgI, whereas the intensities of the oxygen containing groups (O–H, C–O, C–OH and C
O groups, respectively.44 The broad absorption band observed at around 350–750 cm−1 for all the photocatalysts except GO corresponds to the characteristic vibrations of TiO2. In addition, a broad band at 3441 and a sharp peak at 1624 cm−1 are assigned to the vibrations of surface adsorbed water moieties and hydroxyl groups present over TiO2.31 The FTIR spectra of AgI–mesoTiO2 and AgI–mesoTiO2–rGO photocatalysts show an absorption band at 390–560 cm−1 which is assigned to the Ag–I bond. More interestingly, the AgI–mesoTiO2–rGO photocatalyst exhibits only the characteristic peaks of TiO2 and AgI, whereas the intensities of the oxygen containing groups (O–H, C–O, C–OH and C![[double bond, length as m-dash]](https://www.rsc.org/images/entities/char_e001.gif) O) have completely disappeared. These observations confirmed the successful reduction of GO to rGO.
O) have completely disappeared. These observations confirmed the successful reduction of GO to rGO.
The Raman spectra of GO, mesoTiO2, AgI–mesoTiO2 and AgI–mesoTiO2–rGO are shown in Fig. 5(b). The mesoTiO2 exhibits five characteristic Raman bands at 144, 193, 398, 518 and 638 cm−1, which are mainly attributed to the anatase phase TiO2 structure.27 The intensities of the Raman bands of TiO2 are greatly suppressed in both AgI–mesoTiO2 and AgI–mesoTiO2–rGO composites, which might be due to the loading of AgI with TiO2. GO shows the characteristic D and G bands at 1352 and 1591 cm−1, respectively. The ID/IG value of GO was calculated to be 0.93. As shown in the inset of Fig. 5(b), D and G bands of rGO in AgI–mesoTiO2 are observed at 1352 and 1598 cm−1 and the corresponding ID/IG value was estimated to be 0.97. Therefore, the increase in the ID/IG value of rGO supported AgI–mesoTiO2 compared to its ID/IG value of GO clearly indicates that the incorporation of TiO2 and AgI induces defective sites on the surface of the rGO sheets.
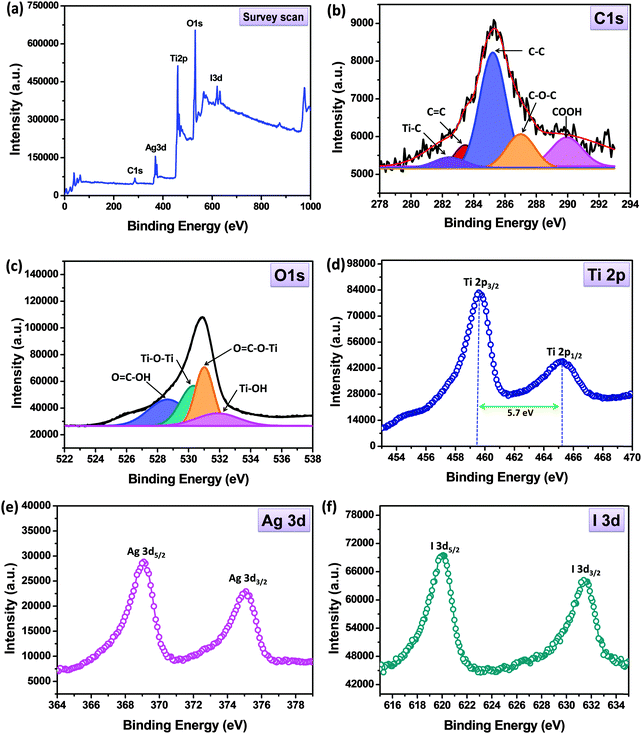
XPS analysis was carried out to identify the chemical oxidation states of the elements (Ag, I, Ti, C and O) and also to confirm the reduction of GO to rGO. As shown in Fig. 6(a), the XPS survey scan spectrum clearly indicates the existence of C, O, Ti, Ag and I elements in AgI–mesoTiO2–rGO nanocomposites. The Gaussian–Lorentz fitting was adopted to identify the constituents of the spectrum. Fig. 6(b) displays the high resolution C1s spectrum deconvoluted into five peaks. An intense peak observed at 285.1 eV corresponds to C–C bonds.45 A low binding energy peak located at 282.2 eV is attributed to the Ti–C bond.46 In addition, three more less intense binding energy peaks are noted at 283.5, 286.9 and 289.9 eV, which are assigned to C![[double bond, length as m-dash]](https://www.rsc.org/images/entities/char_e001.gif) C, C–O–C and COOH bonds, respectively.45 These results support the fact that the preparation of photocatalysts using the ultrasonication method followed by calcination considerably reduces the oxygen rich functional groups and thereby reduces GO into rGO.47 A similar result was also obtained in our previous studies on CuO–TiO2–rGO and Pt loaded TiO2–rGO photocatalysts.29,47,48Fig. 6(c) presents the high resolution O1s spectrum deconvoluted into four peaks with the binding energies centered at 528.7, 530.2, 530.9 and 531.8 eV, which are attributed to O
C, C–O–C and COOH bonds, respectively.45 These results support the fact that the preparation of photocatalysts using the ultrasonication method followed by calcination considerably reduces the oxygen rich functional groups and thereby reduces GO into rGO.47 A similar result was also obtained in our previous studies on CuO–TiO2–rGO and Pt loaded TiO2–rGO photocatalysts.29,47,48Fig. 6(c) presents the high resolution O1s spectrum deconvoluted into four peaks with the binding energies centered at 528.7, 530.2, 530.9 and 531.8 eV, which are attributed to O![[double bond, length as m-dash]](https://www.rsc.org/images/entities/char_e001.gif) C–OH, Ti–O–Ti, Ti–O–C
C–OH, Ti–O–Ti, Ti–O–C![[double bond, length as m-dash]](https://www.rsc.org/images/entities/char_e001.gif) O and Ti–OH, respectively.47 As illustrated in Fig. 6(d), a high resolution Ti 2p spectrum exhibits two main peaks centered at 459.5 and 465.3 eV corresponding to Ti 2p3/2 and Ti 2p1/2, respectively. The binding energy difference between the Ti 2p3/2 and Ti 2p1/2 core level is calculated to be 5.7 eV, which clearly suggesting the presence of normal Ti4+ in anatase TiO2.49,50 It is worth noting that these results are in good agreement with the XRD data, as shown in Fig. 1. Likewise, the high resolution spectrum of Ag 3d exhibits two peaks at 369 and 375 eV for Ag 3d5/2 and Ag 3d3/2, respectively [Fig. 6(e)]. These results clearly confirmed the presence of Ag+ in AgI, however there is no binding energy peak for metallic Ag observed.51 Similarly the high resolution I 3d spectrum shows the appearance of two peaks at 619.9 and 631.3 eV which are assigned to I 3d5/2 and I 3d3/2 [Fig. 6(f)], which confirms the I− state of iodine in AgI.19
O and Ti–OH, respectively.47 As illustrated in Fig. 6(d), a high resolution Ti 2p spectrum exhibits two main peaks centered at 459.5 and 465.3 eV corresponding to Ti 2p3/2 and Ti 2p1/2, respectively. The binding energy difference between the Ti 2p3/2 and Ti 2p1/2 core level is calculated to be 5.7 eV, which clearly suggesting the presence of normal Ti4+ in anatase TiO2.49,50 It is worth noting that these results are in good agreement with the XRD data, as shown in Fig. 1. Likewise, the high resolution spectrum of Ag 3d exhibits two peaks at 369 and 375 eV for Ag 3d5/2 and Ag 3d3/2, respectively [Fig. 6(e)]. These results clearly confirmed the presence of Ag+ in AgI, however there is no binding energy peak for metallic Ag observed.51 Similarly the high resolution I 3d spectrum shows the appearance of two peaks at 619.9 and 631.3 eV which are assigned to I 3d5/2 and I 3d3/2 [Fig. 6(f)], which confirms the I− state of iodine in AgI.19
The specific surface area, the average pore size and the total pore volume of the AgI–mesoTiO2–rGO photocatalyst were analyzed through nitrogen adsorption–desorption isotherms. As shown in Fig. 7, the AgI–mesoTiO2–rGO composite exhibits a typical type (IV) isotherm pattern with an H3 hysteresis loop ranging from 0.44 to 0.88 P/P0. It is well known that the type (IV) isotherm is the characteristic isotherm of mesoporous materials.52,53 The measured Brunauer–Emmett–Teller (BET) surface area of AgI–mesoTiO2–rGO is 48.69 m2 g−1. The average pore size and the total pore volume of AgI–mesoTiO2–rGO photocatalyst were calculated using the Barrett–Joyner–Halenda (BJH) method and the values are 8.8 nm and 0.108 cc g−1, respectively (inset Fig. 7). Thus, the mesoporous nature of the AgI–mesoTiO2–rGO hybrid is clearly seen from the above observations.
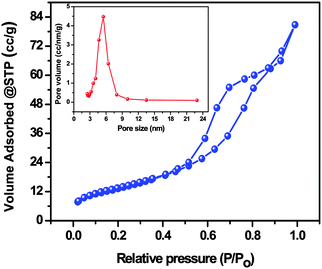 | ||
| Fig. 7 Nitrogen adsorption–desorption isotherms of the AgI–mesoTiO2–rGO composite and the inset figure shows the pore size distribution and the pore volume. | ||
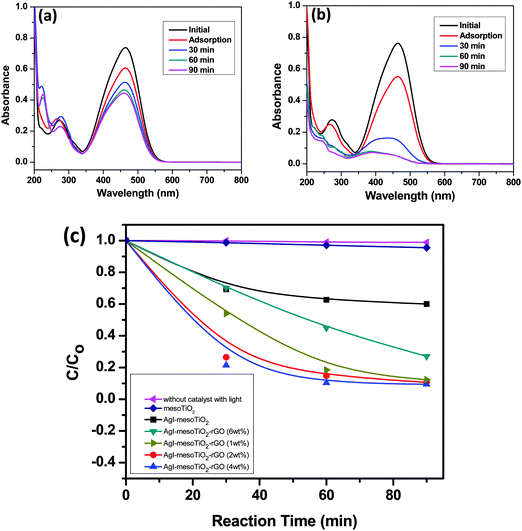
The photocatalytic performance of the prepared catalysts was evaluated using an aqueous MO dye as a model compound under visible light irradiation. It is well known that the adsorption of dye molecules on the catalyst surface is one of the key factors for the degradation of organic pollutants. In particular, carbon based materials have shown excellent adsorption capacity.54 Compared to AgI–mesoTiO2, the rGO loaded composite shows a higher adsorption of dye molecules (Fig. 8). This increase in dye adsorption on catalytic surfaces plays a significant role in achieving higher photocatalytic activity. Fig. 8(a) and (b) show a decrease in absorbance at 464 nm with an increase in irradiation time for AgI–mesoTiO2 and AgI–mesoTiO2–rGO composites under visible light irradiation. It can be observed that the photocatalytic degradation efficiency of AgI–mesoTiO2–rGO is substantially high.
As shown in Fig. 8(c), when experiments were carried out without a catalyst, no degradation of MO was observed indicating that MO was not degraded when exposed to visible light only as previously reported.55 This observation clearly attributes that the degradation of MO is only due to the action of the photocatalyst. In order to evaluate the effect of rGO loading, different weight percentages of rGO (0, 1, 2, 4 and 6 wt%) loaded AgI–mesoTiO2 photocatalysts were prepared and their photocatalytic performance was also tested under identical experimental conditions. The composites with 1, 2 and 4 wt% rGO showed increased photocatalytic degradation compared to pure AgI–mesoTiO2 and mesoTiO2 photocatalysts, whereas 6 wt% rGO loaded AgI–mesoTiO2 photocatalysts decreased the photocatalytic activity. The reason is that a higher loading of rGO could increase the recombination rate instead of effective carrier separation thereby affecting the photocatalytic performance and also it masks the penetration of light into the particle. It can be seen in Fig. 8(c) that the AgI–mesoTiO2 photocatalyst with 4 wt% rGO exhibits 92% MO degradation within 90 min but only 35% of degradation occurred by AgI–mesoTiO2 under visible light irradiation. This ∼3 fold increase in degradation was achieved due to the contribution of rGO. This is due to an efficient overlap of the conduction bands of TiO2 and rGO resulting in an effective separation of charge carriers between the graphene and the semiconductor (TiO2) interface. Since 4 wt% rGO loaded AgI–mesoTiO2 was found to show an optimum efficiency, rest of the studies were carried out with 4 wt% rGO loaded AgI–mesoTiO2 photocatalysts.
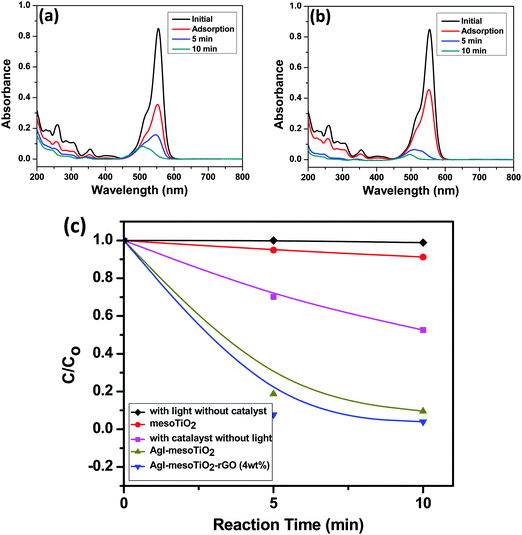
The synthesized mesoTiO2, AgI–mesoTiO2 and AgI–mesoTiO2–rGO (4 wt%) photocatalysts were also demonstrated for RhB degradation. The prominent absorption peak centered at 554 nm gradually decreased with increasing irradiation time for AgI–mesoTiO2 and AgI–mesoTiO2–rGO (4 wt%) photocatalysts [Fig. 9(a) and (b)]. As shown in Fig. 9(c), the RhB with a catalyst – without light and with light – without a catalyst was also examined to investigate the role of the catalyst. No degradation of RhB could be observed either under visible light irradiation or alone. This suggests that the degradation reaction was effective due to photocatalysis. The mesoTiO2 does not exhibit photodegradation under visible light due to its wide bang gap which lies in the UV region. The AgI–mesoTiO2 gives only ∼88% of degradation within 10 min. The 4 wt% rGO loaded composite shows complete degradation (∼97%) of RhB in 10 min. The presence of rGO in composites completely degraded the RhB within a very short span of time.
In general, during photocatalysis, hydroxyl radicals (˙OH) and superoxide anions (O2−˙) are the reactive species for the degradation of organic pollutants. In order to understand the role of rGO in the photocatalytic activity for the degradation of RhB and MO on the AgI–mesoTiO2–rGO photocatalyst, a series of free radical trapping experiments were carried out, as shown in Fig. 10. In the presence of an ˙OH radical scavenger such as benzoic acid (0.5 mM), only 12 and 20% degradation was decreased than that of the scavenger-free photocatalytic systems for RhB and MO, as shown in Fig. 10(a) and (b). These results clearly suggested that the photocatalytic degradation of both RhB and MO dyes was not only mediated through the ˙OH radical reaction. In order to further examine the exact reactive species that are involved in RhB degradation, 10 vol% of triethanolamine (TEOA), as an effective h+ scavenger was added into the RhB reaction solution. The rate of RhB degradation was drastically suppressed, i.e. only 4% of RhB degradation was noticed [Fig. 10(a)]. This result confirmed that the photoinduced holes (h+) are one of the main reactive species for the degradation of RhB. Recently, Xue et al. reported that O2−˙ is the main reactive species for MO degradation using the AgI–TiO2 photocatalyst.32 In order to further prove the degradation process induced by photogenerated electrons in the photocatalytic degradation of MO, another experiment was performed under a N2 atmosphere as shown in Fig. 10(b). A high purity N2 gas was continuously purged throughout the reaction process under ambient conditions, which eliminates the dissolved oxygen content from the reaction solution and thereby prevents the formation of O2−˙. As a result, only 35% in MO degradation was observed after 90 min of visible light illumination instead of 92% under normal atmospheric conditions. This reduction in the % degradation (∼60%) in the presence of N2 gas is a clear evidence that O2−˙ radicals are the main responsible reactive species for MO degradation. On the other hand, around 10% decrease on the percentage degradation of other dye RhB under a N2 atmosphere was observed, which clearly showed that the degradation of RhB was not influenced by O2−˙ radicals. These results clearly emphasized that MO degradation mainly depends on superoxide radicals, whereas RhB degradation depends on photogenerated holes and ˙OH radicals.
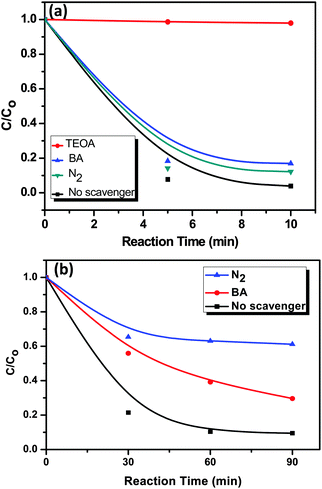 | ||
| Fig. 10 A series of trapping experiments for the degradation of (a) RhB and (b) MO over the AgI–mesoTiO2–rGO photocatalyst under visible light irradiation. | ||
Similarly, the difference in the photocatalytic activity for the degradation of RhB and MO with and without rGO can be described using above observations. The possible photocatalytic reaction pathway mechanism of RhB and MO over the rGO supported photocatalyst is illustrated in Fig. 11. When AgI–mesoTiO2–rGO was irradiated with visible light, electrons from the valence band (VB) of AgI are excited to the conduction band (CB) of AgI leaving positively charged holes in the VB. Since the CB energy level of TiO2 is lower than the CB of AgI, photogenerated electrons can easily move to the CB of TiO2. Moreover, interfacial carrier separations take place with the help of rGO. Since the CB work function of TiO2 matches with the CB work function of graphene, reported elsewhere,37 electrons can be easily transferred from the CB of TiO2 to rGO. As a result, the oxygen sites can readily accept electrons and undergo reduction reaction to generate more O2−˙ radicals. Thus, the presence of rGO in photocatalysts can produce an excess amount of reactive O2−˙ radicals due to the good electron acceptor and transporter behaviour of rGO. Therefore, the ultrafast transportation of photogenerated electrons over the rGO sheet can directly reduce O2 to produce O2−˙ radicals which leads to enhanced MO degradation (around 60% higher). On the other hand, the degradation of RhB is facilitated only through the h+ but not through either ˙OH or O2−˙ radicals as discussed above. As a matter of fact, rGO is not a good carrier of h+ which resulted in only a slight enhancement in RhB degradation by the addition of rGO to the AgI–mesoTiO2 photocatalyst. These results suggest that the rate of photocatalytic degradation not only depends on rGO but also on the nature of the organics.
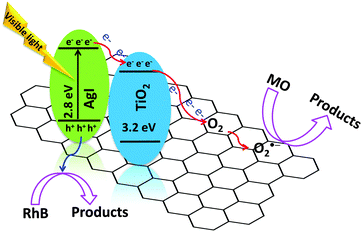 | ||
| Fig. 11 Plausible photocatalytic reaction pathway mechanism of RhB and MO over the AgI–mesoTiO2–rGO photocatalyst. | ||
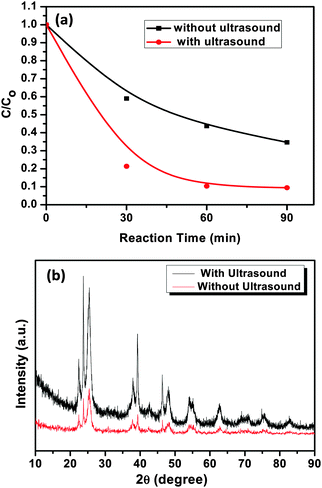
In order to evaluate the specific role of ultrasound in the photocatalytic degradation activity, the AgI–mesoTiO2–rGO photocatalyst was prepared in the absence of ultrasound and photodegradation was carried out using MO. It is known that the physical effects of ultrasound can influence the physical and functional properties of materials due to the shear forces generated during acoustic cavitation.56,57 As is shown in Fig. 12(a), the photocatalyst prepared in the absence of ultrasound exhibits only 60% photodegradation, whereas the photocatalyst prepared in the presence of ultrasound shows 92% of MO degradation. The preparation of photocatalysts using ultrasound might help in increasing the surface active sites of the photocatalysts apart from particle size reduction. Thus, higher active sites can increase the reactive species generation on the surface of the photocatalysts.58,59 As shown in Fig. 12(b), the XRD patterns of the rGO supported photocatalysts prepared in the presence of ultrasound shows more crystalline phases compare to that of the photocatalyst synthesized in the absence of ultrasound. This includes an added advantage for the better enhancement in photodegradation reaction. Furthermore, shear forces of ultrasound not only helps in binding the AgI nanoparticles strongly on the surface of TiO2 nanoparticles but also enhances the uniform distribution and loading of particles on rGO as clearly seen from FE-SEM images (see Fig. 3), As a result, the transport of photo-formed electrons is highly facilitated in the interfacial regions in the presence of rGO. Therefore, the present result strongly suggests that during the synthesis of nanomaterials, ultrasound plays a vital role in enhancing the photocatalytic efficiency of catalysts.
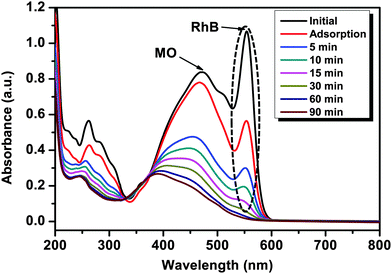
As discussed earlier, the degradation of both dyes is independent of each other, i.e., the MO dye depends on superoxide radicals (conduction band electrons), whereas RhB depends on holes that are produced in the valence band. In order to check the mechanism again, an additional experiment was carried out with a mixed dye solution which consisted of both RhB and MO. Fig. 13, shows the photodegradation of mixed dyes using the AgI–mesoTiO2–rGO (4 wt%) photocatalyst. The absorption peaks of both dyes centered at 464 and 554 nm correspond to MO and RhB, respectively. As can be seen from Fig. 13, 90% of RhB degradation is observed within 15 min and 70% of MO photocatalytic degradation is noted in 90 min of visible light irradiation. The rate of degradation of both dyes is ∼10% less than that of individual dye degradation. This is interesting that both dyes are degraded by the prepared catalysts independently without affecting each other. Therefore, the above mixed dye degradation results strongly support the fact that photoinduced holes and superoxide radicals are the reactive species for RhB and MO degradation, as described in trapping experiments (see Fig. 10).
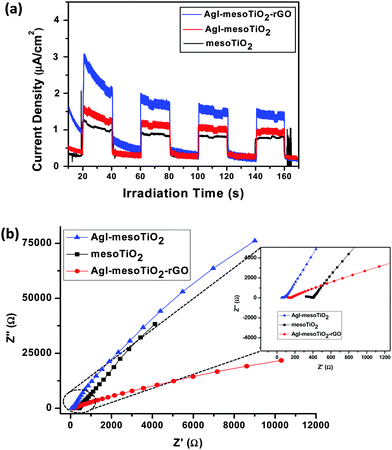
Transient photocurrent measurements were carried out to provide further evidence for our proposed photocatalysis mechanism of rGO loaded AgI–mesoTiO2. The transient photocurrent responses of mesoTiO2, AgI–mesoTiO2 and AgI–mesoTiO2–rGO photocatalysts irradiated under visible light are shown in Fig. 14(a). It is seen from Fig. 14(a) that photocurrents generated for all samples are quite stable and reproducible with several on–off cycles. Notably, the AgI–mesoTiO2–rGO composite exhibits highest photocurrent response than bare mesoTiO2 and AgI–mesoTiO2. Firstly, the AgI present in the composites can absorb visible light and generate photoinduced electron–hole pairs. The exact matching at the conduction band energy levels between AgI and TiO2 causes the separation of photogenerated electron–hole pairs into free electrons and holes at the AgI–TiO2 interfaces. Secondly, the rGO in composites can efficiently separate and transport the carriers due to its superior electrical conductivity with excellent electron acceptor and transporter properties. The charge transfer behavior and the interfacial charge carrier separation of the photocatalysts were investigated from electrochemical impedance analysis. The Nyquist plots of mesoTiO2, AgI–mesoTiO2 and AgI–mesoTiO2–rGO are depicted in Fig. 14(b). As can be seen from the inset of Fig. 14(b), the arc radius of the AgI–mesoTiO2–rGO is smaller as compared to that of bare mesoTiO2 and AgI–mesoTiO2–rGO. This observation strongly suggests that the rGO in composites can assist the efficient separation of photogenerated electron–hole pairs, which is in good agreement with transient photocurrent measurements.
4. Conclusions
In this study, the rGO supported AgI–mesoTiO2 photocatalyst was synthesized via a simple ultrasonic method. This composite showed extended absorbance in the visible region and subsequently reduced the bandgap compared to bare AgI–mesoTiO2 and mesoTiO2 photocatalysts. The 4 wt% rGO loaded composite exhibited high photocatalytic activity for the degradation of both MO and RhB dyes. The remarkable enhancement in the photodegradation efficiency for the degradation of MO was due to the presence of the rGO sheet, which possesses good dye adsorptivity, high carrier transportation and effective charge carrier separation properties. More interestingly, photo-generated superoxide (O2−˙) radicals and photo-generated holes (h+) over rGO supported photocatalysts are the main reactive species for the degradation of MO and RhB, respectively. Furthermore, the photocatalyst synthesized in the presence of ultrasound attributed much better photodegradation efficiency than the photocatalysts prepared without ultrasound. This method provides a simple and effective way for the development of graphene supported nanomaterials for photocatalytic applications.Acknowledgements
This work was supported by Science and Engineering Research Board-Department of Science and Technology (SERB-DST), New Delhi, India [File No: EMR/2014/000645].References
- S. J. Kim and M. Shoda, Appl. Environ. Microbiol., 1999, 65, 1029–1035 CAS.
- B. Neppolian, H. C. Choi, S. Sakthivel, B. Arabindoo and V. Murugesan, J. Hazard. Mater., 2002, 89, 303–317 CrossRef CAS PubMed.
- P. R. Gogate, M. Sivakumar and A. B. Pandit, Sep. Purif. Technol., 2004, 34, 13–24 CrossRef CAS.
- B. Neppolian, Y. Kim, M. Ashokkumar, H. Yamashita and H. Choi, J. Hazard. Mater., 2010, 182, 557–562 CrossRef CAS PubMed.
- B. Neppolian, M. V. Shankar and V. Murugesan, J. Sci. Ind. Res., 2002, 61, 224–230 CAS.
- M. R. Hoffmann, S. T. Martin, W. Choi and D. W. Bahnemann, Chem. Rev., 1995, 95, 69–96 CrossRef CAS.
- A. Ajmal, I. Majeed, R. N. Malik, H. Idriss and M. A. Nadeem, RSC Adv., 2014, 4, 37003–37026 RSC.
- E. Y. Kim, D. S. Kim and B. T. Ahn, Bull. Korean Chem. Soc., 2009, 30, 193–196 CrossRef CAS.
- B. Cai, J. Wang, S. Gan, D. Han, Z. Wu and L. Niu, J. Mater. Chem. A, 2014, 2, 5280–5286 CAS.
- Y. Bi, S. Ouyang, J. Cao and J. Ye, Phys. Chem. Chem. Phys., 2011, 13, 10071–10075 RSC.
- Y. Xu, H. Xu, J. Yan, H. Li, L. Huang, Q. Zhang, C. Huang and H. Wan, Phys. Chem. Chem. Phys., 2013, 15, 5821–5830 RSC.
- P. Wang, B. Huang, X. Qin, X. Zhang, Y. Dai and M. H. Whangbo, Inorg. Chem., 2009, 48, 10697–10702 CrossRef CAS PubMed.
- J. Cao, B. Xu, B. Luo, H. Lin and S. Chen, Appl. Surf. Sci., 2011, 257, 7083–7089 CrossRef CAS.
- C. An, J. Wang, J. Liu, S. Wang and Q. H. Zhang, RSC Adv., 2014, 4, 2409–2413 RSC.
- R. H. Victora, Phys. Rev. B: Condens. Matter Mater. Phys., 1997, 56, 4417–4421 CrossRef CAS.
- D. N. Bose and P. A. Govindacharyulu, Bull. Mater. Sci., 1980, 2, 221–231 CrossRef.
- J. Liu, Y. Yu, Z. Liu, S. Zuo and B. Li, Int. J. Photoenergy, 2012, 2012, 1–7 Search PubMed.
- C. Hu, X. X. Hu, L. S. Wang, J. H. Qu and A. M. Wang, Environ. Sci. Technol., 2006, 40, 7903–7907 CrossRef CAS PubMed.
- Y. Z. Li, H. Zhang, Z. M. Guo, J. J. Han, X. J. Zhao, Q. N. Zhao and S. J. Kim, Langmuir, 2008, 24, 8351–8357 CrossRef CAS PubMed.
- M. Azimzadehirani, M. Elahifard, S. Haghighic and M. Gholami, Photochem. Photobiol. Sci., 2013, 12, 1787–1794 CAS.
- C. An, W. Jiang, J. Wang, S. Wang, Z. Ma and Y. Li, Dalton Trans., 2013, 42, 8796–8801 RSC.
- C. J. Miller, H. Yu and T. D. Waite, Colloids Surf., A, 2013, 435, 147–153 CrossRef CAS.
- K. I. Bolotin, K. J. Sikes, Z. Jiang, M. Klima, G. Fudenberg, J. Hone, P. Kim and H. L. Stormer, Solid State Commun., 2008, 146, 351–355 CrossRef CAS.
- R. Vinoth, S. Ganesh Babu, D. Bahnemann and B. Neppolian, Sci. Adv. Mater., 2015, 7, 1443–1449 CrossRef CAS.
- R. Kim, M. Bae, D. G. Kim, H. Cheng, B. H. Kim, D. H. Kim, M. Li, J. Wu, F. Du, H. S. Kim, S. Kim, D. Estrada, S. W. Hong, Y. Huang, E. Pop and J. A. Rogers, Nano Lett., 2011, 11, 3881–3886 CrossRef CAS PubMed.
- J. Wang, C. An, J. Liu, G. Xi, W. Jiang, S. Wang and Q. H. Zhang, J. Mater. Chem. A, 2013, 1, 4718–4727 Search PubMed.
- P. Wang, Y. Tang, Z. Dong, Z. Chen and T. T. Lim, J. Mater. Chem. A, 2013, 15, 2827–2832 Search PubMed.
- H. Xu, B. W. Zeiger and K. S. Suslick, Chem. Soc. Rev., 2013, 42, 2555–2567 RSC.
- B. Neppolian, C. Wang and M. Ashokkumar, Ultrason. Sonochem., 2014, 21, 1948–1953 CrossRef CAS PubMed.
- W. S. Hummers, J. Richard and E. Offeman, J. Am. Chem. Soc., 1958, 80, 1339 CrossRef CAS.
- J. C. Yu, L. Zhang and J. Yu, New J. Chem., 2002, 26, 416–420 RSC.
- B. Xue, T. Sun, J. K. Wu, F. Mao and W. Yang, Ultrason. Sonochem., 2015, 22, 1–6 CrossRef PubMed.
- Z. L. Wang, D. Xu, Y. Huang, Z. Wu, L. M. Wang and X. B. Zhang, Chem. Commun., 2012, 48, 976–978 RSC.
- S. Vadivel, M. Vanitha, A. Muthukrishnaraj and N. Balasubramanian, J. Water Process Eng., 2014, 1, 17–26 CrossRef.
- Q. Huang, S. Tian, D. Zeng, X. Wang, W. Song, Y. Li, W. Xiao and C. Xie, ACS Catal., 2013, 7, 1477–1485 CrossRef.
- H. Zhang, X. Lv, Y. Li, Y. Wang and J. Li, ACS Nano, 2010, 4, 380–386 CrossRef CAS PubMed.
- S. D. Perera, R. G. Mariano, K. Vu, N. Nour, O. Seitz, Y. Chabal and K. J. Balkus, ACS Catal., 2012, 2, 949–956 CrossRef CAS.
- Y. Zhang, Z. R. Tang, X. Fu and Y. Jun Xu, ACS Nano, 2010, 4, 7303–7314 CrossRef CAS PubMed.
- Z. D. Meng, L. Zhu, T. Ghosh, C. Y. Park, K. Ullah, V. Nikam and W. C. N. Oh, Bull. Korean Chem. Soc., 2012, 33, 3761–3766 CrossRef CAS.
- X. Lin, J. Xing, W. Wang, Z. Shan, F. Xu and F. Huang, J. Phys. Chem. C, 2007, 111, 18288–18293 CAS.
- L. Chen, D. Jiang, T. He, Z. Wu and M. Chen, CrystEngComm, 2013, 15, 7556–7563 RSC.
- K. Vinodgopal, B. Neppolian, I. V. Lightcap, F. Grieser, M. Ashokkumar and P. V. Kamat, J. Phys. Chem. Lett., 2010, 1, 1987–1993 CrossRef CAS.
- D. A. Reddy, J. Choi, S. Lee, R. Ma and T. K. Kim, RSC Adv., 2015, 5, 67394–67404 RSC.
- D. A. Reddy, R. Ma and T. K. Kim, Ceram. Int., 2015, 41, 6999–7009 CrossRef CAS.
- B. Qiu, Y. Zhou, Y. Ma, X. Yang, W. Sheng, M. Xing and J. Zhang, Sci. Rep., 2015, 5, 8591–8596 CrossRef CAS PubMed.
- L. R. Radovic, Chemistry and Physics of Carbon, CRC Press, Taylor and Francis group, 2013 Search PubMed.
- S. Ganesh Babu, R. Vinoth, B. Neppolian, D. D. Dionysiou and M. Ashokkumar, J. Hazard. Mater., 2015, 291, 83–92 CrossRef PubMed.
- B. Neppolian, V. Sáez, J. G. García, F. Grieser, R. Gómez and M. Ashokkumar, J. Solid State Electrochem., 2014, 18, 3163–3171 CrossRef CAS.
- G. An, W. Ma, Z. Sun, Z. Liu, B. Han, S. Miao, Z. Miao and K. Ding, Carbon, 2007, 45, 1795–1801 CrossRef CAS.
- X. Wang, Q. Xiang, B. Liu, L. Wang, T. Luo, D. Chen and G. Shen, Sci. Rep., 2013, 3, 2007–2014 Search PubMed.
- K. Vignesh, A. Suganthi, B. K. Min, M. Rajarajan and M. Kang, RSC Adv., 2015, 5, 576–585 RSC.
- Y. Z. Li, H. Zhang, Z. M. Guo, J. J. Han, X. J. Zhao, Q. N. Zhao and S. J. Kim, Langmuir, 2008, 24, 8351–8357 CrossRef CAS PubMed.
- B. Neppolian, Q. Wang, H. Yamashita and H. Choi, Appl. Catal., A, 2007, 333, 264–271 CrossRef CAS.
- B. Neppolian, A. Bruno, C. L. Bianchi and M. Ashokkumar, Ultrason. Sonochem., 2012, 19, 9–15 CrossRef CAS PubMed.
- G. Yang, Z. Jiang, H. Shi, T. Xiao and Z. Yan, J. Mater. Chem., 2010, 20, 5301–5309 RSC.
- B. Neppolian, Q. Wang, H. Jung and H. Choi, Ultrason. Sonochem., 2008, 15, 649–658 CrossRef CAS PubMed.
- S. H. Jhung, K. C. Yoo, Y. K. Hwang and J. S. Chang, Bull. Korean Chem. Soc., 2007, 28, 2401–2404 CrossRef CAS.
- M. Lirong, S. Jianjun, Z. Ming and H. Jie, Bull. Korean Chem. Soc., 2014, 35, 3521–3525 CrossRef.
- S. Pankaj and M. Ashokkumar, Theoretical and Experimental Sonochemistry Involving Inorganic Systems, Springer Science & Business Media, 2011 Search PubMed.
Footnote |
| † Electronic supplementary information (ESI) available. See DOI: 10.1039/c5cp08041j |
| This journal is © the Owner Societies 2016 |

