Synthesis of morphology-controlled bismutite for selective applications†
Received
7th December 2015
, Accepted 10th February 2016
First published on 12th February 2016
Abstract
Bismutite (Bi2O2CO3) possessing diverse morphologies, namely nanosheets, nanodiscs and nanoplatelets, was synthesized by a simple controllable method using bismuth nitrate pentahydrate and urea as precursors in a water/ethylene glycol mixture. The as-synthesized samples showed unique physical and chemical properties, such as varying morphology, phase identification, chemical composition, surface area and surface potential. Bi2O2CO3 nanosheets exhibited excellent adsorption capabilities for anionic dyes (acid orange 7 and methyl orange) and high photocatalytic performance for the decolorization of cationic dyes (rhodamine B and methylene blue) under simulated solar illumination. Furthermore, the electrochemical performance of Bi2O2CO3 nanosheets showed good capacitance properties and hence could be a potential candidate for electrode materials in energy related applications.
Introduction
In general adsorption and photocatalysis are used in wastewater treatment (environmental remediation) for the removal/degradation of inorganic (heavy metals), organic (dyes, drugs and herbicides), and biological pollutants (virus and bacteria).1–5 Often, the selective adsorption of pollutants is a major issue and hence the development of better adsorbents is an active area of research.6 Zhu et al. successfully developed the selective adsorption of cationic dyes using anionic metal–organic frameworks through guest–guest exchange between mixtures of aqueous dye solutions.7 Ma et al. effectively prepared microporous anionic metal–organic frameworks for the selective adsorption of cationic dye from a mixture of organic dyes using the charge-selective separation ion exchange method.8 Both cases comprised topologically controlled structures. Over the past few years, innovative synthesis of various materials for dye adsorption and selective photocatalysis has been reported.5,9–22 The defects/oxygen vacancies play an important role in the adsorption and photocatalytic behavior of these materials.10,12,16,17,22 Alternatively, oxygen-rich compounds showed better adsorption and photocatalytic properties due to their unique physicochemical properties.18,21 Nevertheless, the photocatalytic activity of a photocatalyst depends upon band gap, surface area, surface potential and morphologies exposed facets.23,24 Bismuth based oxides possess a narrow band gap, high charge carrier efficiency with good thermoelectric properties due to the overlap between 6s (Bi) and 2p (O) of a valance band.25 Moreover, bismuth containing compounds have been used in many studies.6,17–22,24–27 Among these Bi2O2CO3 (bismutite) is an emerging material and used as an antibacterial, photocatalyst, sensor, supercapacitor, adsorbent and precursor for Bi2O3.24,26,28–41 Bismutite belongs to Sillén phase compounds demonstrating inter-layer structures with alternative polymeric cationic (BiO)nn+ and anionic (CO32−) layers and has been widely used as a photocatalyst for the degradation of toxic pollutants such as organic dyes and gaseous compounds such as nitric oxide (NO).26,29–34,40–48 Greaves et al. first reported the synthesis of Bi2O2CO3 through a simple chemical method and later, several methodologies have been reported for the synthesis of bismutite with various morphologies such as microflowers, microspheres (rose, plate, pinon-like, sponge-like, and hollow), persimmon-like, nanosheets, nanotubes, egg-tart and micro/nanostructures.28–37,42–55 Chen et al. reported the synthesis of bismuth micro/nanospheres by a simple chemical method using ethylene glycol as a non-toxic solvent.56 Numerous methods are available in the literature regarding the size and shape control of Bi2O2CO3via solvothermal, surfactant-assisted hydrothermal and vacuum heat treatments.57–59 The concentration of precursors (citrate ion, nitrate ion, etc.), additives or precipitants (urea, sodium carbonate and ammonium carbonate, etc.) also plays a major role in achieving diverse morphologies of Bi2O2CO3.60–63 Likewise, the effect of co-solvent (water/ethanol or water/ethylene glycol) for various other materials has been extensively studied in order to attain excellent physicochemical characteristics.64–66 These interesting approaches have also been implemented to attain tunable properties like surface area, surface potentials, band alignment with functional morphologies.65–69 Hence, researchers are interested to achieve multifunctional behavior with highly efficient and excellent selective applications through composition-structural engineering aspects. Until now, to the best of our knowledge, the synthesis of Bi2O2CO3 with mixed solvent (water/ethylene glycol) has not been reported and also extensively studied for selective applications. Herein, we report on the synthesis and characterization of Bi2O2CO3 with various morphologies through a simple and controllable method to explore their applications in dye adsorption and photocatalytic activity. In addition, the electrochemical performance of as-synthesized samples was tested to evaluate its suitability as a supercapacitor.
Experimental
Chemicals
All chemicals were of analytical grade and used without further purification. Bismuth(III) nitrate pentahydrate (ACS reagent, 98%), urea (AR grade, 99%), acid orange 7 (AO7: 85%), methyl orange (MO; 85%), methyl red (MR), rhodamine B (Rh B; 95%), methylene blue (MB) and sodium sulfate were purchased from Sigma-Aldrich. Vulcan XC-72 and polyvinylidenefluoride (PVDF) were purchased from Fluka. N-Methyl-2-pyrrolidene (NMP), ethylene glycol (≥99%) and nitric acid (ACS reagent) were purchased from Merck.
Synthesis of diverse bismutite nanostructures
About 6.29 g of bismuth(III) nitrate pentahydrate was dissolved in 43 mL of ethylene glycol which was then mixed with 33 mL of urea solution (6.05 mol dm−3) in a 100 mL round bottom flask. The initial pH of the reaction mixture was 1.2, which was then adjusted to 0.9 using concentrated nitric acid (2.1 mL). Then, the reaction mixture was refluxed at 110 °C for 9 h under atmospheric pressure with constant stirring. After completion of the reaction, white bismutite nanosheet powder was collected and washed with distilled water several times and then dried at 80 °C for 4 h. The nanoplatelet morphology was obtained by following similar experimental conditions but without the addition of concentrated nitric acid, whereas the nanodisc morphology was obtained by refluxing at 80 °C for 9 h keeping other conditions similar.
Characterization
The surface morphology was observed using a field emission scanning electron microscope (FESEM model JEOL 7401F) and a transmission electron microscope (TEM model JEOL JEM 2010). Chemical composition and elemental analysis were carried out using energy dispersive X-ray spectroscopy (EDS, Oxford Inc.). The phase identification and crystal structures of the samples were determined by powder X-ray diffraction (XRD) using a Rigaku D/max-2500 diffractometer with a Ni-filtered Cu Kα radiation source (40 kV, 30 mA, λ = 1.5406 Å). Fourier transform infrared (FTIR) spectra were recorded on a Nicolet iS50 infrared spectrophotometer using the KBr pellet technique. Micro-Raman spectra of the sample were recorded by backscattering configuration using an EnSpectr RS-532 Raman system. X-ray photoelectron spectroscopy (XPS) measurements were recorded on a Physical Electronics PHI 5600 spectrophotometer with monochromatic Al Kα (1486.6 eV) X-ray as the excitation source. The nitrogen gas adsorption–desorption measurements were performed using a Micromeritics ASAP2010 at liquid nitrogen temperature (77 K) and surface area was calculated using the Brunauer–Emmett–Teller (BET) equation. Surface charge (ζ-potential) of the samples was measured at different pH values using a zeta-check-zeta-potential analyzer (Microtrac) apparatus. UV-visible absorption spectra (diffuse reflectance mode; DRS) were recorded using an ultraviolet-visible (UV-vis) spectrophotometer (T90+, PG instruments, UK) with an integrating sphere using BaSO4 as a standard. The photoluminescence (PL) spectra of the samples were performed using a Shimadzu (RF5301PC) spectrofluorometer at an excitation wavelength (370 nm) under ambient conditions. The photocurrent measurement was performed using an AUTOLAB12/FRA2 in a three-electrode system; as-synthesized samples were coated on FTO as a working electrode and platinum (Pt) the counter as well as reference electrode with polymer ion gel being used as a solid electrolyte under a xenon illumination source (150 W with standard 85 mW cm−2).
Adsorption studies
Adsorption studies were performed by magnetically stirring the mixture at room temperature (natural pH). In a typical process, 25 mg of the samples was taken in a 125 ml borosilicate glass bottle which contained 100 mL of organic dye solution (1 × 10⁻⁴ mol L−1: AO7 and MO; 5 × 10⁻⁵ mol L−1: MR, Rh B and MB). The suspension was constantly stirred and at regular time intervals about 4 mL aliquots of reaction mixtures were removed and filtered using a PVDF syringe filter (0.45 μm) to estimate the amount adsorbed. The amount of adsorbed dyes was quantified using a UV-vis spectrophotometer (T90+, PG instruments, UK). The removal ratios (RR) of adsorption for dyes was calculated using the formula RR = (C0 − C)/C0 × 100%. Then, the adsorption capacity of each dyes on the samples was calculated using Qm = (C0 − C) × V/m. Here, the Qm is the adsorption capacity (mg g−1), C0 and C are the concentrations of the dye (mg L−1) before and after adsorption, respectively, V is the volume of solution (L) and m the mass of the samples taken (g). Furthermore, the selective adsorption of anionic dye (AO7 and MO) from a mixture (AO7 in MB and MO in MB) was studied under similar concentrations with as-synthesized samples as adsorbents.
Photocatalytic activity
Photocatalytic experiments of the synthesized samples were carried out at natural pH under ambient atmospheric conditions using a 150 W tungsten halogen lamp (λ ≥ 400 nm; the intensity of incident radiation was 80![[thin space (1/6-em)]](https://www.rsc.org/images/entities/char_2009.gif) 600 ± 10 Lux measured using Extec, USA). The samples (50 mg of catalyst) were dispersed in a 125 mL borosilicate glass bottle which contained 100 mL of organic dye solution (5 × 10⁻⁵ mol L−1: Rh B and MB). Prior to illumination, the suspension was magnetically stirred in the dark for 30 min to attain adsorption/desorption equilibrium. During irradiation, 4 mL of solution was collected at regular time intervals from the suspension mixtures and the catalyst was filtered using a PVDF syringe filter (0.45 μm). The photocatalytic activity of synthesized samples was calculated by measuring the remaining concentration of organic dye using a UV-vis spectrophotometer (T90+, PG instruments, UK).
600 ± 10 Lux measured using Extec, USA). The samples (50 mg of catalyst) were dispersed in a 125 mL borosilicate glass bottle which contained 100 mL of organic dye solution (5 × 10⁻⁵ mol L−1: Rh B and MB). Prior to illumination, the suspension was magnetically stirred in the dark for 30 min to attain adsorption/desorption equilibrium. During irradiation, 4 mL of solution was collected at regular time intervals from the suspension mixtures and the catalyst was filtered using a PVDF syringe filter (0.45 μm). The photocatalytic activity of synthesized samples was calculated by measuring the remaining concentration of organic dye using a UV-vis spectrophotometer (T90+, PG instruments, UK).
Electrochemical measurements
The working electrode was fabricated as described below: about 75 wt% bismutite, 20 wt% Vulcan XC-72 carbon (conductive agent) and 5 wt% of PVDF (binder) were ground in a mortar, and then a few drops of NMP solution was added to form a slurry. The slurry was then coated onto a pretreated SS plate (active electrode area was 1.0 cm2) and dried at 100 °C under vacuum for 12 h. Capacitance measurements were performed using a standard three-electrode system containing the above prepared SS plate as a working electrode, Pt foil as a counter electrode, and Ag/AgCl as a reference electrode in 1 M Na2SO4 aqueous solution as an electrolyte. Cyclic voltammetry (CV), galvanostatic (GV) charge–discharge and electrochemical impedance spectroscopy (EIS) techniques were performed at room temperature by using a potentiostat/galvanostat (AUTOLAB 302N module) as a testing system. The supercapacitor performance of the as-synthesized sample was measured at different scan rates (5, 10, 20, 40, 80 and 160 mV s−1) within the potential range of −0.1 to +0.4 V. Then, a long term galvanostatic charge–discharge performance was carried out up to 1000 cycles at a current density of 0.1 mA cm−2 in the potential range of −0.1 to +0.4 V. The specific capacitance (SC) for as-prepared working electrodes was calculated from galvanostatic discharge curves using eqn (1).| |  | (1) |
where, I is the current applied (amperes), t is the discharging time in seconds, m is the mass of the sample present on the electrode in grams and ΔE is the operating potential window in volts of charge and discharge. Furthermore, the electrochemical impedance spectroscopic measurements were carried out in the alternating current frequency range of 0.1 Hz–100 kHz at open circuit voltage with an excitation signal of 10 mV for an impedance spectrum analysis.
Results and discussion
Microscopic observations
Morphological features of the as-synthesized sample (refluxed at 110 °C for 9 h in the presence of concentrated nitric acid) are shown in Fig. 1a and b. The low magnification FESEM image (Fig. 1a) shows that the as-synthesized sample has a sheet-like morphology. A high magnification image (Fig. 1b) shows that each sheet is about 200–300 nm in length and 5–10 nm in thickness. Platelet-like morphology (Fig. 1c and d) is seen for the preparation procedure in the absence of concentrated nitric acid, while under similar reaction conditions, upon refluxing at 80 °C for 9 h disc-like morphology with 50–100 nm diameter and 10–15 nm thickness is produced (Fig. 1e and f). TEM results of the synthesized sample (refluxed at 110 °C for 9 h in the presence of concentrated nitric acid) reveal nanosheet morphology with immensely porous architecture and lateral dimensions of 200–300 nm in length and 300–500 nm in width (Fig. 2a and b). The observed lattice fringe d space of 0.271 nm in HRTEM is in good agreement with the (110) plane of interplanar distance for nanosheets of bismutite (Fig. 2c). Furthermore, the selected area electron diffraction (SAED) patterns of nanosheets confirm that diffraction rings which are in good agreement with the polycrystalline nature of the tetragonal structure of bismutite (Fig. 2d). The EDS spectrum (Fig. 2e) of nanosheets shows the presence of Bi, C and O elements confirming that synthesized material is pure Bi2O2CO3.
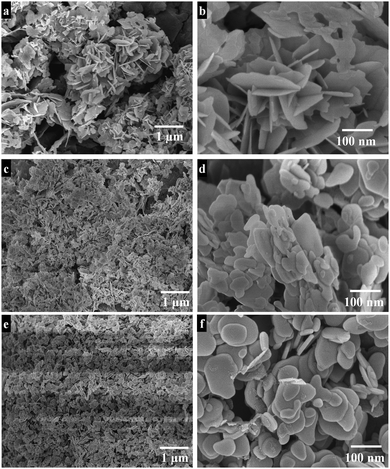 |
| | Fig. 1 Low and High magnification FESEM images of Bi2O2CO3 nanosheets (a and b), nanoplatelets (c and d) and nanodiscs (e and f). | |
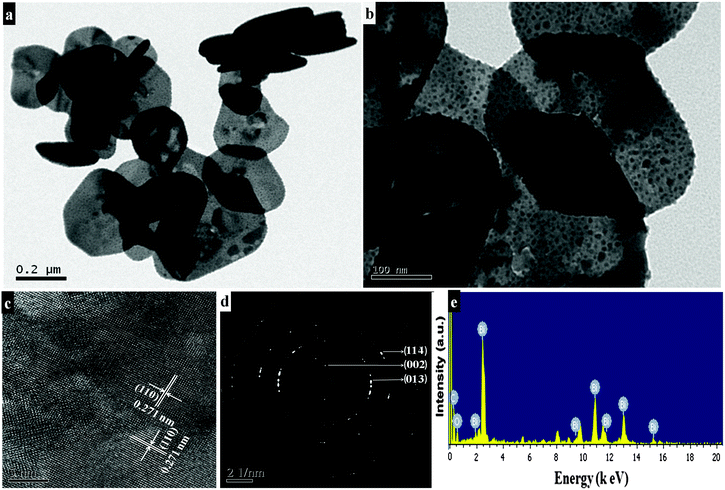 |
| | Fig. 2 TEM images (a and b), HRTEM image (c), SAED pattern (d) and EDS spectrum (e) of Bi2O2CO3 nanosheets. | |
Spectroscopic data
Powder XRD patterns of as-synthesized samples are shown in Fig. 3. All diffraction lines can be indexed to the tetragonal phase of Bi2O2CO3 which are in good agreement with analogous JCPDS card no. 41-1488. Here, the distinct diffraction patterns at (2θ) 30.2, 32.6 and 46.8 lines correspond to (013), (110) and (020) planes, respectively indicating the diverse nanostructures obtained during the reaction process. The intensity of diffraction lines attributes to the control over different growth orientations (crystallographic direction).17 In addition, the line broadening at 30.2 (013 plane) for nanosheets indicates smaller crystallites when compared with other morphologies. While all other morphologies show high crystallinity with the pure tetragonal phase of bismutite. The crystal sizes of as-synthesized samples are found to be 24, 28 and 29 nm for nanosheets, nanodiscs and nanoplatelets, respectively, calculated using Debye–Scherrer's formula for the most intense line at 30.2 (013 plane). The unit cell parameters of as-synthesized samples can be calculated using the least squares method and are given in Table ST1 (see ESI†). The FTIR spectrum of nanosheets is shown in Fig. 4a. The spectrum confirms the presence of carbonate ion (CO32−) characteristic peaks which could be observed at 1036 cm−1 for symmetric vibration (ν1), 1376 cm−1 and 1462 cm−1 (broad shoulder) for anti-symmetric vibration (ν3), 838 cm−1 for outer-plane bending (ν2) and a shoulder at 690 cm−1 for inner-plane deformation (ν4).30 Also, the additional vibration peak at 2424 cm−1 is attributed to the presence of carbonate ions.43 Other peaks at 3424 cm−1 and 1760 cm−1 could be assigned to the presence of surface O–H stretching due to chemisorbed and/or physisorbed water molecules. No additional characteristic vibration peaks are observed under a typical synthetic process which confirms the purity of Bi2O2CO3. Similarly, the FT-IR spectra of nanodisc and nanoplatelet morphologies clearly indicate the formation of highly pure Bi2O2CO3 (Fig. S1, see ESI†). Typical Raman spectra of Bi2O2CO3 nanosheets are shown in Fig. 4b in which the characteristic peaks of CO32− ions are observed at 1360, 1070 and 670 cm−1, which could be attributed to ν3, ν1 and ν4 vibrations, respectively. The metal–oxygen (Bi![[double bond, length as m-dash]](https://www.rsc.org/images/entities/char_e001.gif) O) stretching vibration peak could be observed at 518 cm−1. Characteristic peaks at 161, 362 and 426 cm−1 are also obtained due to external vibration modes for Raman analysis.45,70 The crystal lattice of anions (CO32−) is hidden under the general positions (C1) for bismutite. Therefore, all vibrational modes become active for both FTIR and Raman analysis (degeneracies are removed).70 The chemical state of the elements and surface compositions of as-synthesized Bi2O2CO3 nanosheets were confirmed by XPS (as shown in Fig. 4c–f). The survey spectrum (Fig. 4c) indicates the presence of Bi, C and O elements, which are located at 160, 288 and 530 eV for chemical binding energy states, respectively. Nevertheless, the core-level XPS signal of the Bi 4f element (Fig. 4d) displays two peaks at 159.0 and 164.3 eV for Bi 4f7/2 and Bi 4f5/2 which could be assigned for spin–orbit splitting of Bi3+ in the Bi2O2CO3 sample. Although, C 1s spectra (Fig. 4e) obviously show two characteristic peaks at 285.0 and 288.9 eV which are due to carbonate ions (CO32−) whereas the spectrum in Fig. 4f demonstrates the O 1s state, confirmed by two peaks at 529.8 and 532.1 eV for Bi–O binding energy and carbonate ion species adsorbed with chemisorbed OH− in the water molecule on to the surface of the sample, respectively.31,45,46 Thus, the XPS spectrum also confirms that the as-synthesized sample is highly pure.
O) stretching vibration peak could be observed at 518 cm−1. Characteristic peaks at 161, 362 and 426 cm−1 are also obtained due to external vibration modes for Raman analysis.45,70 The crystal lattice of anions (CO32−) is hidden under the general positions (C1) for bismutite. Therefore, all vibrational modes become active for both FTIR and Raman analysis (degeneracies are removed).70 The chemical state of the elements and surface compositions of as-synthesized Bi2O2CO3 nanosheets were confirmed by XPS (as shown in Fig. 4c–f). The survey spectrum (Fig. 4c) indicates the presence of Bi, C and O elements, which are located at 160, 288 and 530 eV for chemical binding energy states, respectively. Nevertheless, the core-level XPS signal of the Bi 4f element (Fig. 4d) displays two peaks at 159.0 and 164.3 eV for Bi 4f7/2 and Bi 4f5/2 which could be assigned for spin–orbit splitting of Bi3+ in the Bi2O2CO3 sample. Although, C 1s spectra (Fig. 4e) obviously show two characteristic peaks at 285.0 and 288.9 eV which are due to carbonate ions (CO32−) whereas the spectrum in Fig. 4f demonstrates the O 1s state, confirmed by two peaks at 529.8 and 532.1 eV for Bi–O binding energy and carbonate ion species adsorbed with chemisorbed OH− in the water molecule on to the surface of the sample, respectively.31,45,46 Thus, the XPS spectrum also confirms that the as-synthesized sample is highly pure.
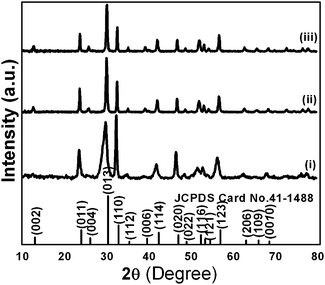 |
| | Fig. 3 Powder XRD patterns of Bi2O2CO3 nanosheets (i), nanoplatelets (ii) and nanodiscs (iii). | |
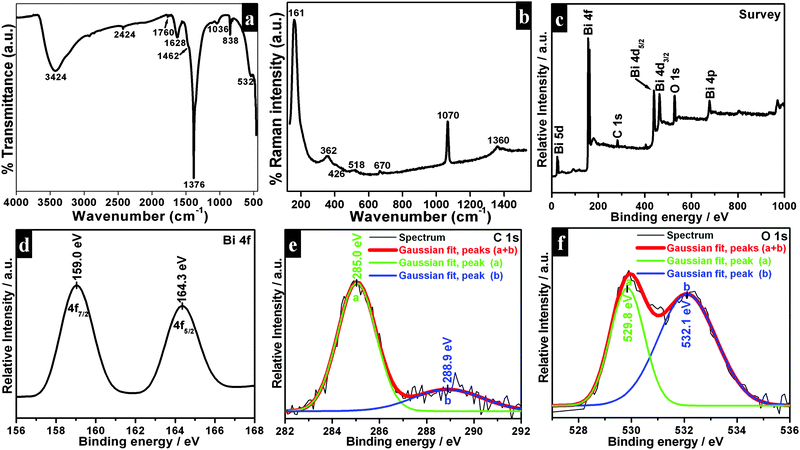 |
| | Fig. 4 FT-IR (a), Raman (b) and XPS spectrum (c–f) of Bi2O2CO3 nanosheets. | |
Mechanism for the formation of diverse nanostructures
A schematic illustration for the formation of bismutite with diverse morphologies is shown in Scheme 1. Reactions (2)–(5) show the formation of Bi2O2CO3. Bi(NO3)3·5H2O was dissolved in ethylene glycol to produce glycolate complex solution (A) [reaction (2)].71 Urea solution (B) was prepared by dissolving in double distilled water. When solutions (A) and (B) were mixed and heated to 110 °C, urea underwent hydrolysis to produces NH4+ and OH− ions [reactions (3) and (4)]. During the course of reaction, the glycolate complex reacted with the product to generate unique nanocrystals of Bi2O2CO3 [reaction (5)].| | | Bi(NO3)3·5H2O + 3HOCH2CH2OH → Bi(OCH2CH2OH)3 + 5H2O + 3HNO3 | (2) |
| | | CO(NH2)2 + H2O → 2NH3 + CO2 | (3) |
| | | NH3 + H2O → NH4+ + OH− | (4) |
| | | 2Bi(OCH2CH2OH)3 + CO2 + 12OH− → Bi2O2CO3 + 6(HOCH2CH2OH) + 3H2O + 3O2 | (5) |
Here, ethylene glycol acts as a complexing agent as well as a co-solvent. However, the addition of concentrated nitric acid to the reaction mixture leads to the controlled complex formation between Bi(III) and EG due to the common ion effect (NO3−) which may affect the initial nucleation and growth to generate unique nanocrystals.9 As a result, thinner Bi2O2CO3 nanosheets are formed, whereas in the absence of concentrated nitric acid, intrinsic growth of nuclei leads to plate-like morphology. Experiments performed at lower temperature (80 °C) leads to the formation of only disc-like morphology due to the much slower rate of production of NH4+ and OH− ions from urea hydrolysis. In order to understand the nanosheet growth process, experiments were performed at different time periods (1.5, 3 and 6 h) under identical conditions. The obtained samples were analyzed by both SEM and powder XRD (Fig. 5). In the case of the 1.5 h experiment, the obtained product is only nanocrystals of Bi2O2CO3, whereas in the case of the 3 h experiment smaller nanocrystals aggregate into nanosheet-like morphology. In the case of the 6 h experiment nanosheet morphology is noticed due to Oswald ripping processes, whereas in the case of the 9 h experiment a well developed product, i.e., Bi2O2CO3 nanosheets of 200–300 nm length and 5–10 nm thickness, is obtained. The powder XRD patterns also further support such nanosheet formation.
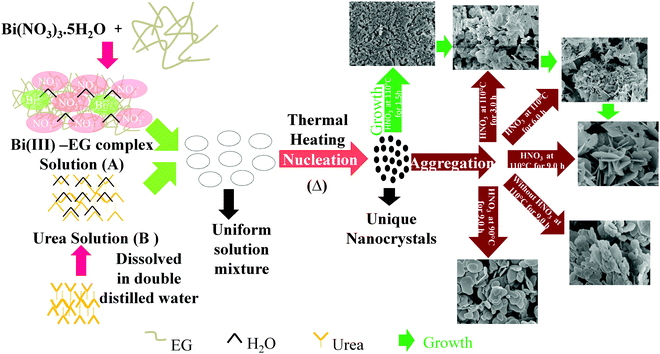 |
| | Scheme 1 Schematic illustration for the formation of diverse nanostructures of Bi2O2CO3. | |
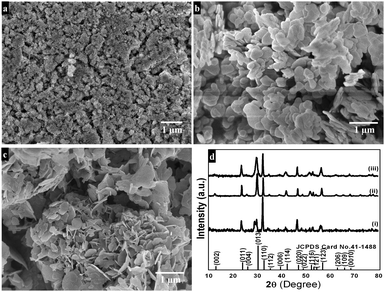 |
| | Fig. 5 FESEM images of Bi2O2CO3 nanosheets at 1.5 h (a), 3.0 h (b) and 6.0 h (c). Powder XRD patterns of Bi2O2CO3 nanosheets (d) at 1.5 h (i), 3.0 h (ii) and 6.0 h (iii). | |
Surface area, pore size distributions and ζ-potential measurements
The nitrogen (N2) adsorption–desorption isotherms and Barrett–Joyner–Halenda (BJH) pore size distribution of as-synthesized Bi2O2CO3 nanosheets are shown in Fig. 6a. The adsorption isotherms resemble type-III which possess a macroporous surface with monolayer-multilayer adsorption. Also the adsorption hysteresis loops clearly indicate H3 type without any limiting adsorption at high P/P0 values which may be due to the existence of plate-like particles or slit-like pores.72,73 The calculated specific surface area of Bi2O2CO3 nanosheets is about 30 m2 g−1 calculated using the Brunauer–Emmett–Teller (BET) equation. The specific surface areas of Bi2O2CO3 nanoplatelet and nanodisc morphologies are about 11 and 16 m2 g−1, respectively (Fig. 6b and c). The surface charges of as-synthesized Bi2O2CO3 samples were determined by ζ-potential measurement: ζ-potential vs. pH is shown in Fig. 6d. It could be seen that it is positive at low pH and negative at high pH. The isoelectric point for all samples is below pH 7.
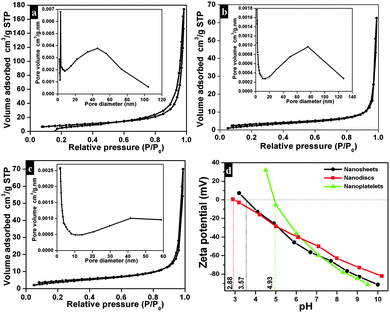 |
| | Fig. 6 Nitrogen gas adsorption/desorption isotherm of Bi2O2CO3 nanosheets (a), nanoplatelets (b) and nanodiscs (c) (inset shows BHJ pore size distribution curves for the appropriate samples). The ζ-potential curve of Bi2O2CO3 nanosheets, nanoplatelets and nanodiscs (d). | |
Adsorption of dyes
The adsorption capacities of as-synthesized Bi2O2CO3 samples were evaluated by dispersing the samples in aqueous solutions containing dyes. AO7, MO, MR, Rh B and MB were chosen as model dye pollutants. Fig. 7a–e show UV-vis absorption spectra of above mentioned dyes. The percentage of the adsorption profile (RR) reveals that about 96% of AO7 adsorbed on Bi2O2CO3 nanosheets in 60 min (Fig. 7a). The spectra shown in Fig. 7b indicate that the rate of adsorption of MO on Bi2O2CO3 nanosheets is faster than that of AO7. However, only negligible amounts of neutral (MR) and cationic (Rh B and MB) dyes were adsorbed on as-synthesized Bi2O2CO3 nanosheets (Fig. 7c–e). From the results, it could be suggested that Bi2O2CO3 nanosheets exhibit selective adsorption towards anionic dyes only. Likewise experiments performed with the other morphologies (nanodiscs and nanoplatelets) show a percentage of the adsorption profile (RR) of about 75 and 21% towards AO7 and 78% and 40% for MO under identical conditions (Fig. S2, see ESI†). In addition, the adsorption capacities were calculated for as-synthesized samples and illustrated in Fig. 7f (statistical plot for AO7 and MO adsorption). Obviously, the nanosheets show enhanced adsorption capacity of AO7 about 139.8 mg g−1 which is significantly high compared with nanodiscs and nanoplatelets (105.2 mg g−1 and 30.4 mg g−1, respectively). Likewise, MO shows higher adsorption on nanosheets (117.8 mg g−1) compared to nanodiscs (98.5 mg g−1) and nanoplatelets (51.5 mg g−1). In order to explain the adsorption behavior of anionic, neutral and cationic dye molecules on as-synthesized Bi2O2CO3 a possible mechanism is proposed and illustrated in Scheme 2.
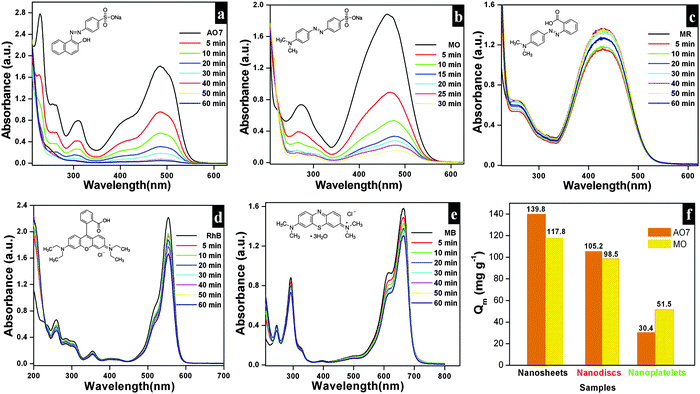 |
| | Fig. 7 Time dependence UV-vis absorption spectrum of Bi2O2CO3 nanosheets in the presence of AO7 (a), MO (b), MR (c), Rh B (d) and MB (e) in the dark. The adsorption capacity profile for different morphologies of Bi2O2CO3 in the presence of AO7 and MO (f). | |
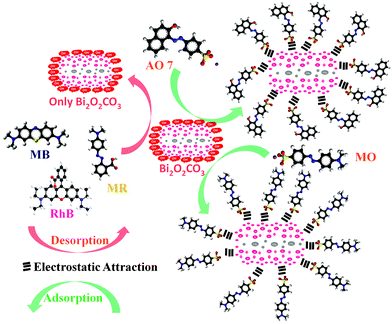 |
| | Scheme 2 Schematic representation of adsorption and desorption of dyes for as-synthesized Bi2O2CO3 samples. | |
The observed negative ζ-potential values (−58, −49 and −59 mV for nanosheets, nanodiscs and nanoplatelets) suggest that the prepared samples have OH groups adsorbed on the surface.74,75 In the case of anionic dye, adsorption is caused by electrostatic stabilization/interaction between the adsorbent (as-synthesized Bi2O2CO3 samples) and surface OH groups (negative ζ-potential), whilst in the case of neutral and cationic dyes there are no such electrostatic stabilization/interactions.9,74 Molecular and microstructural level changes have taken place upon adsorption of anionic dye which could be confirmed by FESEM (undetermined morphology), FT-IR (characteristic band changes due to structural complexation) and powder XRD results (no changes in the tetragonal phase) (Fig. S3, see ESI†). Also experiments were carried out under identical conditions to understand the preferential adsorption of certain dye in a dye mixture. In the case of AO7 and MB dye mixtures AO7 is selectively adsorbed (Fig. 8a) whereas MO and MB dyes adsorb due to co-adsorption caused by the inductive effect of dye molecules (Fig. 8b). Nevertheless, for AO7 and MB dye mixtures such an inductive effect caused by the MB molecule is prevented due to the steric hindrance of the AO7 structure (OH functional group is in the cis position towards –N![[double bond, length as m-dash]](https://www.rsc.org/images/entities/char_e001.gif) N– and the intra molecular hydrogen network) whereas in the MO molecular structure (the –N
N– and the intra molecular hydrogen network) whereas in the MO molecular structure (the –N![[double bond, length as m-dash]](https://www.rsc.org/images/entities/char_e001.gif) N– azo group is in the trans position between two aromatic rings) no such steric hindrance is observed.9
N– azo group is in the trans position between two aromatic rings) no such steric hindrance is observed.9
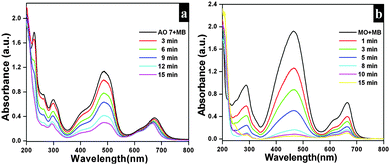 |
| | Fig. 8 (a) UV-vis absorption spectrum of Bi2O2CO3 nanosheets in the presence of AO7 in MB (a) and MO in MB (b). | |
Photocatalytic activity and optical properties
The photocatalytic efficiencies of as-synthesized samples were evaluated using Rh B and MB (cationic dyes) as model pollutants. Fig. 9a shows the absorption spectra observed for Rh B solution during photocatalytic degradation in the presence of Bi2O2CO3 nanosheets as a photocatalyst. Upon irradiation for 240 min, the characteristic absorption peak at 553 nm for Rh B gradually decreased. The photocatalytic degradation efficiency (D) for Rh B was calculated using eqn (6).where A and A0 are Rh B concentrations after and before degradation, respectively. For comparison, similar experiments were performed with Bi2O2CO3 nanodiscs and nanoplatelets and as well as without any catalyst (blank test) and the results are shown in Fig. 9b. Bi2O2CO3 nanosheets showed 98% decolorization of Rh B after 240 min under simulated solar illumination, while in the absence of a photocatalyst (blank test) only 3% decolorization was observed (Fig. 9b). For Bi2O2CO3 nanodisc and nanoplatelet morphologies about 80 and 70% decolorization of Rh B were observed under identical conditions. The higher photocatalytic activity for Rh B decolorization under Bi2O2CO3 nanosheets could be attributed to its high surface area (30 m2 g−1), morphology and distinct textural properties (negative ζ-potential value).23,43 Similarly, the photocatalytic degradation of other cationic dye (MB) was performed under identical conditions using as-synthesized Bi2O2CO3 samples as the photocatalyst (Fig. S4, see ESI†). Bi2O2CO3 nanosheets showed 95% decolorization of MB after 600 min under illumination whereas 48 and 66% were observed in the case of nanoplatelets and nanodiscs, respectively (Fig. S4, see ESI†). However, the photocatalysts do not show similar catalytic activity due to their molecular structure (Rh B has both partially positive and negative ions whereas MB has only positive ions).9,76 In addition, possible adsorption/desorption of the dye molecules with specific textural characteristics of Bi2O2CO3 samples influences the photocatalytic process.75 Furthermore, the effect of photocatalytic activity was explained by facilitated optical absorption/emission characteristics (band gap/holes and electrons). The light absorption performance of Bi2O2CO3 samples is shown in Fig. 9c. In addition absorption coefficients of as-synthesized samples were examined by Tauc plots. The optical absorption band gap of the semiconductor was calculated using eqn (7).77| |  | (7) |
where α is the absorption coefficient, C is a constant, hν is the photon energy and Ebulkg is the band gap. The estimated band gaps of as-synthesized Bi2O2CO3 samples are 3.02, 3.12 and 3.21 eV for nanosheets, nanodiscs and nanoplatelets, respectively, by the extrapolation of the linear region of (αhν)1/2versus photon energy hν plots (Fig. 9d).77 The emission spectra of as-synthesized Bi2O2CO3 show a strong emission peak at 428 nm (λex = 370 nm), which could be attributed to photo-generated holes and electrons on the surface (Fig. 9e).78 The emission intensity of Bi2O2CO3 nanosheets is less intense due to the reduction in the recombination rate and separation of photogenerated carriers leading to a higher photocatalytic activity.22 To support this, photocurrent density measurements were performed for as-synthesized Bi2O2CO3 samples and are shown in Fig. 9f. Bi2O2CO3 nanosheets obviously showed a much higher photocurrent response, which implies superior photocatalytic activity than that of nanodiscs and nanoplatelets (Fig. 9f). Based on the results of these studies for photocatalytic activity, a mechanism is suggested in Scheme 3. Here, the valance band (VB) and conduction band (CB) potentials of as-synthesized Bi2O2CO3 samples can be calculated (Table ST2 (see ESI†)) using the following eqn (8)–(9)where X is the absolute electronegativity of Bi2O2CO3, which is defined as the geometric average of the absolute electronegativities of the constituent atoms. Ee is the energy of free electrons on the hydrogen scale (Ee = 4.5 eV). X was found to be 6.543 eV for Bi2O2CO3. However, the positioned CB value at 0.438 to 0.533 eV of as-synthesized Bi2O2CO3 samples given in Table ST2 (ESI†) is more positive than that of O2/O2˙− (−0.28 eV vs. NHE) which implies that photoreduction through the electron and the position of ˙OH/H2O (+2.27 eV vs. NHE) displays more positive than that of the VB suggesting photooxidation through holes, respectively. Meanwhile, the dye molecules are stable under simulated solar illumination (without a catalyst) and in the presence of a photocatalyst (dark condition). Under illumination, the dye is excited and leading to electron injection from the excited state of the dye into the CB of the photocatalyst (self-sensitization degradation).79 In general, such photosensitization of photocatalysts is limited and follows the reactions proposed for photocatalytic degradation (reactions (10)–(14)).80| | | Bi2O2CO3 + hν → Bi2O2CO3 (eCB−) + Bi2O2CO3 (hVB+) | (11) |
| | | H2O + Bi2O2CO3 (hVB+) → Bi2O2CO3 + (˙OH + H+) | (12) |
| | | O2 + Bi2O2CO3 (eCB−) → Bi2O2CO3 + (O2˙−) | (13) |
| | | (˙OH + H+) + (O2˙−) + Dye* → degradation products | (14) |
The results of as-synthesized Bi2O2CO3 samples indicated that ECB has more positive potential than that of Rh B dye (CB: −1.42 eV) and the highest light absorption wavelength at 553 nm in the visible region possesses photo-generated electrons from the excited Rh B (dye*) which leads to higher photocatalytic activity.81 Although the favorable light absorption of Rh B and the amount of carboxylic groups (–COOH) leading to the interaction with the surface site of the photocatalyst are much more when compared with MB (unavailable functional group), whereas, in the case of MB with the CB (−3.60 eV vs. vacuum) with light absorption at 664 nm apparently slower inclusion (week self-sensitization) for photo-generated electrons from the excited state and poor interaction with a photocatalyst surface site lead to lower photocatalytic activity. Therefore, as-synthesized Bi2O2CO3 samples might have higher photocatalytic activity for Rh B than MB caused by the self-sensitization degradation process upon simulated solar illumination. In addition, the photocatalytic effect for the dye degradation process indeed influenced their physical parameters such as band gap, surface area, surface potential and morphology of as-synthesized samples.23 Then, the materials' sustainability and reusability were studied after photodegradation by powder XRD, FESEM and FTIR analysis and the results are shown in Fig. S5 (see ESI†).
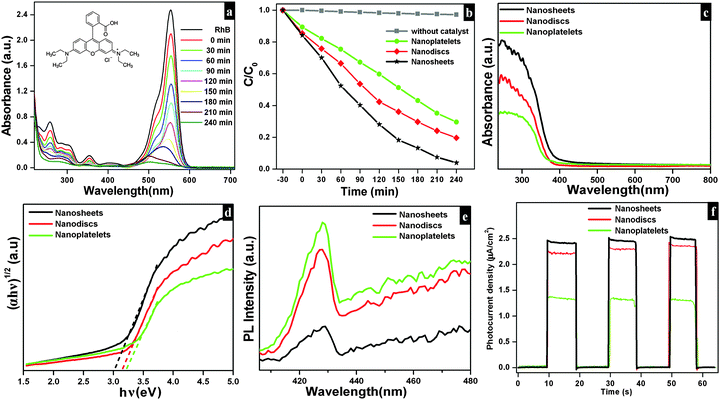 |
| | Fig. 9 Time dependence UV-vis absorption spectrum of Bi2O2CO3 nanosheets in the presence of Rh B (a) under illumination. The photocatalytic degradation curve for different morphologies of Bi2O2CO3 in the presence of Rh B (b). DRS absorption spectrum (c), corresponding Tauc plot (d), PL emission (e) and photocurrent responses (f) of Bi2O2CO3 samples. | |
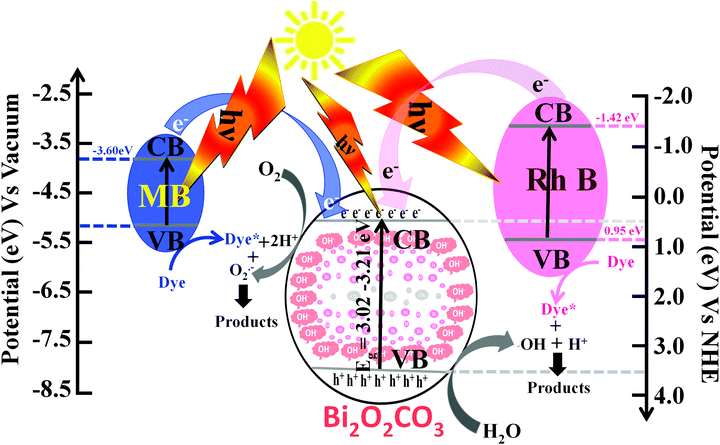 |
| | Scheme 3 Schematic demonstration showing the band structure and mechanism for the photocatalytic performances of dyes over as-synthesized Bi2O2CO3 samples under simulated solar illumination. | |
Electrochemical capacitance measurements
Electrochemical performances of as-synthesized Bi2O2CO3 samples as electrode materials for a supercapacitor system were examined by cyclic voltammetry. Typical cyclic voltammogramms (Fig. 10a) are measured at a scan rate of 40 mV s−1 with potential ranging from −0.1 to 0.4 V vs. Ag/AgCl in a 1 M Na2SO4 aqueous electrolyte exhibiting ideal capacitive characteristics (without any redox peak currents in curves). Here, Bi2O2CO3 nanosheet electrodes show greater integrated area and very high capacitance compared to nanodiscs and nanoplatelets. At different scan rates (5, 10, 20, 40, 80 and 160 mV s−1) (Fig. 10b), the current response of electrode materials looks rectangular in shape with respect to the zero-current line and in addition peak current gets increased with increasing scan rates which illustrates the high capacitance (at low scan rate) and fast diffusion of ions (at a high scan rate).82–84 Hence, the specific capacitance of Bi2O2CO3 nanosheet electrodes decreases much low when scan rates increased as shown in Fig. 10c. Furthermore, the GV charge–discharge behaviour of Bi2O2CO3 nanosheet electrodes was examined using chronopotentiometry (CP) (potential ranges between −0.1 and 0.4 V vs. Ag/AgCl in a 1 M Na2SO4 aqueous electrolyte and current density 0.1 mA cm−2). The charging and discharging profiles of Bi2O2CO3 nanosheet electrodes are shown in linear variation (potential vs. time plot) which indicates that such material has high capacitance (Fig. 10d). The calculated specific capacitance value (83.5 F g−1) for Bi2O2CO3 nanosheet electrodes increases at higher cycles with the electrode surface being activated during the charging/discharging process.85 Furthermore, the mechanistic characteristics of EIS for as-synthesized Bi2O2CO3 samples were monitored. Fig. 10f shows the Nyquist impedance plots of as-synthesized samples exhibiting a semicircle over the high frequencies and a vertical line in the low frequencies. The semicircle at a high frequency range corresponds to the Faradaic charge transfer resistance (Rct), which is mainly influenced by ionic resistances of the electrolyte and electrode active material interface. The vertical line at the low frequency range corresponds to ion diffusion of active electrode materials with respect to diffusive resistance at the electrolyte.85,86 Herein, Bi2O2CO3 nanosheet electrodes exhibiting a smaller semicircle at the high frequency region indicate that charge transfer resistance decreased extremely when compared with other electrodes such as nanodiscs and nanoplatelets. Hence, as-synthesized Bi2O2CO3 nanosheet electrodes showing excellent specific capacitance and good cycling stability with highly reversibility could be promising candidates as electrode materials in electrochemical supercapacitors as well as sensors and batteries.
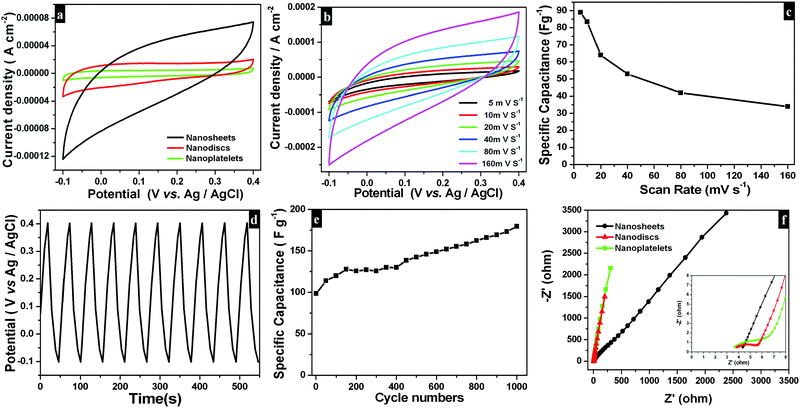 |
| | Fig. 10 CV curves (a) for different morphologies of Bi2O2CO3 at 40 mV s−1 scan rate in 1 M Na2SO4 as an electrolyte. CV curves (b) and its corresponding specific capacitance plot (c) for Bi2O2CO3 nanosheets at different scan rates in the potential range of −0.1 to 0.4 V vs. Ag/AgCl in an aqueous solution of 1 M Na2SO4 as an electrolyte. The galvanostatic charge–discharge cycling test (d) and specific capacitances for a number of cycles (e) of Bi2O2CO3 nanosheets at the current density 0.1 mA cm−2. EIS plot (f) for different morphologies of Bi2O2CO3 at the high frequency region (inset shows the low frequency region). | |
Conclusions
In summary, Bi2O2CO3 with diverse morphologies was successfully synthesized using a simple controllable method. As-synthesized samples demonstrate a tetragonal structure with the well crystalline nature of Bi2O2CO3. It was observed that typical reaction parameters and reaction time provide a key factor for control over the morphologies of Bi2O2CO3 nanosheets, nanodiscs and nanoplatelets. The N2 adsorption and ζ-potential measurements of the as-synthesized samples having surface areas 30, 16 and 11 mg g−1 (nanosheets, nanodiscs and nanoplatelets) with negative surface charge reveal the efficient adsorption of various dyes (selectively anionic dye) in aqueous solutions. Among them, Bi2O2CO3 nanosheets have excellent adsorption capacities of 139.8 and 117.8 mg g−1 for acid orange 7 and methyl orange dyes, respectively. Besides, these samples exhibit remarkable photocatalytic activity for the decolorization of cationic dyes (rhodamine B and methyleneblue) from the aqueous solution simulated solar illumination. Furthermore, the Bi2O2CO3 nanosheet sample shows a prominent specific electrochemical capacitance of 150 F g−1 after 400 cycles for supercapacitor applications. Thus, as-synthesized Bi2O2CO3 nanosheets can be excellent materials as adsorbents and photocatalysts for wastewater treatment with supercapacitor activities for energy applications.
Acknowledgements
The research described herein was financially supported by the Department of Science and Technology, India (GITA/DST/TWN/P-50/2013) and National Science Council (NSC), Taiwan (NSC-102-2923-035-001-MY3), under the India–Taiwan collaborative research grant.
Notes and references
- I. Ali, Chem. Rev., 2012, 112, 5073–5091 CrossRef CAS PubMed.
- X. Chen, L. Liu, P. Y. Yu and S. S. Mao, Science, 2011, 331, 746–750 CrossRef CAS PubMed.
- H. Tong, S. Ouyang, Y. Bi, N. Umezawa, M. Oshikiri and J. Ye, Adv. Mater., 2012, 24, 229–251 CrossRef CAS PubMed.
- X. Qu, J. Brame, Q. Li and P. J. J. Alvarez, Acc. Chem. Res., 2013, 46, 834–843 CrossRef CAS PubMed.
- Q. Wu, X. Yang, J. Liu, X. Nie, Y. Huang, Y. Wen, J. Khan, W. U. Khan, M. Wu and T. An, ACS Appl. Mater. Interfaces, 2014, 6, 17730–17739 CAS.
- F. Tian, J. Xiong, H. Zhao, Y. Liu, S. Xiao and R. Chen, CrystEngComm, 2014, 16, 4298–4305 RSC.
- Z. Zhu, Y.-L. Bai, L. Zhang, D. Sun, J. Fang and S. Zhu, Chem. Commun., 2014, 50, 14674–14677 RSC.
- Y.-C. He, J. Yang, W.-Q. Kan, H.-M. Zhang, Y.-Y. Liu and J.-F. Ma, J. Mater. Chem. A, 2015, 4, 1675–1681 Search PubMed.
- S. Wang, F. Teng and Y. Zhao, RSC Adv., 2015, 5, 76588–76598 RSC.
- N. M. Tomić, Z. D. Dohčević-Mitrović, N. M. Paunivić, D. Ž. Mijin, N. D. Radić, B. V. Grbić, S. M. Aškrabic, B. M. Babić and D. V. Bajuk-Bogdanović, Langmuir, 2014, 30, 11582–11590 CrossRef PubMed.
- A. Mills, M. Sheik, C. O'Rourke and M. McFarlane, Appl. Catal., B, 2009, 89, 189–195 CrossRef CAS.
- P. Ji, J. Zhang, F. Chen and M. Anpo, Appl. Catal., B, 2009, 85, 148–154 CrossRef CAS.
- S. Liang, R. Liang, L. Wen, R. Yuan, L. Wu and X. Fu, Appl. Catal., B, 2012, 125, 103–110 CrossRef CAS.
- M. Lazar and W. A. Daoud, RSC Adv., 2012, 2, 447–452 RSC.
- C. Li, M. Wei, D. G. Evans and X. Duan, Small, 2014, 10, 4469–4486 CrossRef CAS PubMed.
- F. Liu, Y. H. Leung, A. B. Djurišić, A. M. C. Ng and W. K. Chan, J. Phys. Chem. C, 2013, 117, 12218–12228 CAS.
- K. Ren, K. Zhang, J. Liu, H. Luo, Y. Huang and X. Yu, CrystEngComm, 2012, 14, 4384–4390 RSC.
- X. Xiao, C. Liu, R. Hu, X. Zuo, J. Nan, L. Li and L. Wang, J. Mater. Chem., 2012, 22, 22840–22843 RSC.
- F. Qin, G. Li, H. Xiao, Z. Lu, H. Sun and R. Chen, Dalton Trans., 2012, 41, 11263–11266 RSC.
- C. F. Guo, J. Zhang and Q. Liu, ACS Nano, 2012, 6, 8746–8752 CrossRef CAS PubMed.
- Q.-C. Liu, D.-K. Ma, Y.-Y. Hu, Y.-W. Zeng and S.-M. Huang, ACS Appl. Mater. Interfaces, 2013, 5, 11927–11934 CAS.
- Y. Huang, H. Li, M.-S. Balogun, W. Liu, Y. Tong, X. Lu and H. Ji, ACS Appl. Mater. Interfaces, 2014, 6, 22920–22927 CAS.
- M. Roy, S. Ghosh and M. K. Naskar, Phys. Chem. Chem. Phys., 2015, 17, 10160–10169 RSC.
- F. Wang, Z. Zhao, K. Zhang, F. Dong and Y. Zhou, CrystEngComm, 2015, 17, 6098–6102 RSC.
- S. Sun and W. Wang, RSC Adv., 2014, 4, 47136–47512 RSC.
- F. Qin, G. Li, R. Wang, J. Wu, H. Su and R. Chen, Chem. – Eur. J., 2012, 18, 16491–16497 CrossRef CAS PubMed.
- J. Li, Y. Yu and L. Zhang, Nanoscale, 2014, 6, 8473–8488 RSC.
- R. Chen, M. H. So, J. Yang, F. Deng, C.-M. Che and H. Sun, Chem. Commun., 2006, 2265–2267 RSC.
- Y. Zheng, F. Duan, M. Chen and Y. Xie, J. Mol. Catal. A: Chem., 2010, 317, 34–40 CrossRef CAS.
- F. Dong, W.-K. Ho, S. C. Lee, Z. Wu, M. Fu, S. Zou and Y. Huang, J. Mater. Chem., 2011, 21, 12428–12436 RSC.
- P. Madhusudan, J. Zhang, B. Cheng and G. Liu, CrystEngComm, 2013, 15, 231–240 RSC.
- T. Selvamani, A. M. Asiri, A. O. Al-Youbi and S. Anandan, Mater. Sci. Forum, 2013, 764, 169–193 CrossRef.
- T. Xiong, F. Dong and Z. Wu, RSC Adv., 2014, 4, 56307–56312 RSC.
- Z. Zhao, Y. Zhou, F. Wang, K. Zhang, S. Yu and K. Cao, ACS Appl. Mater. Interfaces, 2015, 7, 730–737 CAS.
- H. Huang, J. Wang, F. Dong, Y. Guo, N. Tian, Y. Zhang and T. Zhang, Cryst. Growth Des., 2015, 15, 534–537 CAS.
- Y. Zhou, H. Wang, M. Sheng, Q. Zhang, Z. Zhao, Y. Lin, H. Liu and G. R. Patzke, Sens. Actuators, B, 2013, 188, 1312–1318 CrossRef CAS.
- S. Peng, L. Li, H. Tan, Y. Wu, R. Cai, H. Yu, X. Huang, P. Zhu, S. Ramakrishna, M. Srinivasan and Q. Yan, J. Mater. Chem. A, 2013, 1, 7630–7638 CAS.
- D. Barreca, F. Morazzoni, G. A. Rizzi, R. Scotti and E. Tondello, Phys. Chem. Chem. Phys., 2001, 3, 1743–1749 RSC.
- X. Zhang, Y. Zheng, D. G. McCulloch, L. Y. Yeo, J. R. Friend and D. R. MacFarlane, J. Mater. Chem. A, 2014, 2, 2275–2282 CAS.
- H.-Y. Jiang, P. Li, G. Liu, J. Ye and J. Lin, J. Mater. Chem. A, 2015, 3, 5119–5125 CAS.
- J. Eberl and H. Kisch, Photochem. Photobiol. Sci., 2008, 7, 1400–1406 CAS.
- P. Taylor, S. Sunder and V. J. Lopata, Can. J. Chem., 1984, 62, 2863–2873 CrossRef CAS.
- H. Cheng, B. Huang, K. Yang, Z. Wang, X. Qin, X. Zhang and Y. Dai, ChemPhysChem, 2010, 11, 2167–2173 CrossRef CAS PubMed.
- L. Chen, R. Huang, S.-F. Yin, S.-L. Luo and C.-T. Au, Chem. Eng. J., 2012, 193–194, 123–130 CrossRef CAS.
- F. Dong, S. C. Lee, Z. Wu, Y. Huang, M. Fu, W.-K. Ho, S. Zou and B. Wang, J. Hazard. Mater., 2011, 195, 346–354 CrossRef CAS PubMed.
- F. Dong, Y. Sun, M. Fu, W.-K. Ho, S. C. Lee and Z. Wu, Langmuir, 2012, 28, 766–773 CrossRef CAS PubMed.
- F. Dong, A. Zheng, Y. Sun, M. Fu, B. Jiang, W.-K. Ho, S. C. Lee and Z. Wu, CrystEngComm, 2012, 14, 3534–3544 RSC.
- F. Dong, Y. Sun, W.-K. Ho and Z. Wu, Dalton Trans., 2012, 41, 8270–8284 RSC.
- F. Dong, J. Bian, Y. Sun, T. Xiong and W. Zhang, CrystEngComm, 2014, 16, 3592–3604 RSC.
- Y. Liu, Z. Wang, B. Huang, K. Yang, X. Zhang, X. Qin and Y. Dai, Appl. Surf. Sci., 2010, 257, 172–175 CrossRef CAS.
- R. Chen, G. Cheng, M. H. So, J. Wu, Z. Lu, C.-M. Che and H. Sun, Mater. Res. Bull., 2010, 45, 654–658 CrossRef CAS.
- X.-F. Cao, L. Zhang, X.-T. Chen and Z.-L. Xue, CrystEngComm, 2011, 13, 1939–1945 RSC.
- T. Zhao, J. Zai, M. Xu, Q. Zou, Y. Su, K. Wang and X. Qian, CrystEngComm, 2011, 13, 4010–4017 RSC.
- F. Dong, Q. Li, W. Zhang, M. Guan, W.-K. Ho and Z. Wu, Mater. Chem. Phys., 2013, 142, 381–386 CrossRef CAS.
- L. Yang, Q. Han, J. Zhu and X. Wang, Mater. Lett., 2015, 138, 235–237 CrossRef CAS.
- G. Cheng, J. Wu, F. Xiao, H. Yu, Z. Lu, X. Yu and R. Chen, Mater. Lett., 2009, 63, 2239–2242 CrossRef CAS.
- G. Cheng, H. Yang, K. Rong, Z. Lu, X. Yu and R. Chen, J. Solid State Chem., 2010, 183, 1878–1883 CrossRef CAS.
- H. Y. Liang, Y. X. Yang, J. C. Tang and M. Ge, Mater. Sci. Semicond. Process., 2013, 16, 1650–1654 CrossRef CAS.
- F. Dong, T. Xiong, Y. Sun, H. Huang and Z. Wu, J. Mater. Chem. A, 2015, 3, 18466–18474 CAS.
- J. Tang, H. Zhao, G. Li, Z. Lu, S. Xiao and R. Chen, Ind. Eng. Chem. Res., 2013, 52, 12604–12612 CrossRef CAS.
- S. Liu, Y. Tu and G. Dai, Ceram. Int., 2014, 40, 2343–2348 CrossRef CAS.
- W. Cen, T. Xiong, C. Tang, S. Yuan and F. Dong, Ind. Eng. Chem. Res., 2014, 53, 15002–15011 CrossRef CAS.
- F. Dong, H. Liu, W.-K. Ho, M. Fu and Z. Wu, Chem. Eng. J., 2013, 214, 198–207 CrossRef CAS.
- C.-M. Lan, S.-E. Liu, J.-W. Shiu, J.-Y. Hu, M.-H. Lin and E. W.-G. Diau, RSC Adv., 2013, 3, 559–565 RSC.
- T. Selvamani, T. Yagyu, S. Kawasaki and I. Mukhopadhyay, Catal. Commun., 2010, 11, 537–541 CrossRef CAS.
- T. Selvamani, C. A. Manjula, S. Anandan, A. M. Asiri and M. Ashokkumar, Cryst. Res. Technol., 2015, 50, 143–149 CrossRef CAS.
- H. Huang, K. Xiao, S. Yu, F. Dong, T. Zhang and Y. Zhang, Chem. Commun., 2016, 52, 354–357 RSC.
- L. Shan, G. Wang, D. Li, X. San, L. Liu, L. Dong and Z. Wu, Dalton Trans., 2015, 44, 7835–7843 RSC.
- H. Huang, X. Li, J. Wang, F. Dong, P. K. Chu, T. Zhang and Y. Zhang, ACS Catal., 2015, 5, 4094–4103 CrossRef CAS.
- G. E. Tobon-Zapata, S. B. Etcheverry and E. J. Baran, J. Mater. Sci. Lett., 1997, 16, 656–657 CrossRef CAS.
- X. Xiao, R. Hu, C. Liu, C. Xing, C. Qian, X. Zuo, J. Nan and L. Wang, Appl. Catal., B, 2013, 140–141, 433–443 CrossRef CAS.
- K. S. W. Sing, D. H. Everett, R. A. W. Haul, L. Moscou, R. A. Pierotti, J. Rouquérol and T. Siemieniewska, Pure Appl. Chem., 1985, 57, 603–619 CrossRef CAS.
- K. Kaneko, J. Membr. Sci., 1994, 96, 59–89 CrossRef CAS.
- C. Pan, J. Xu, Y. Chen and Y. Zhu, Appl. Catal., B, 2012, 115–116, 314–317 CrossRef CAS.
- S. Obregón and G. Colón, J. Mol. Catal. A: Chem., 2013, 376, 40–47 CrossRef.
- Y. Lei, G. Wang, S. Song, W. Fan, M. Pang, J. Tang and H. Zhang, Dalton Trans., 2010, 39, 3273–3278 RSC.
- S. Anandan, G.-L. Lee, P.- K. Chen, C. Fan and J. J. Wu, Ind. Eng. Chem. Res., 2010, 49, 9729–9737 CrossRef CAS.
- N. Liang, J. Zai, M. Xu, Q. Zhu, X. Wei and X. Qian, J. Mater. Chem. A, 2014, 2, 4208–4216 CAS.
- D.-H. Wang, G.-Q. Gao, Y.-W. Zhang, L.-S. Zhou, A.-W. Xu and W. Chen, Nanoscale, 2012, 4, 7780–7785 RSC.
- M. Xiong, L. Chen, Q. Yuan, J. He, S.-L. Luo, C.-T. Au and S.-F. Yin, Dalton Trans., 2014, 43, 8331–8337 RSC.
- J. Tang, D. Li, Z. Feng, Z. Tan and B. Ou, RSC Adv., 2014, 4, 2151–2154 RSC.
- B. G. S. Raj, R. N. R. Ramprasad, A. M. Asiri, J. J. Wu and S. Anandan, Electrochim. Acta, 2015, 156, 127–137 CrossRef CAS.
- D. Wang, Q. Wang and T. Wang, Nanotechnology, 2011, 22, 135604 CrossRef PubMed.
- M. Toupin, T. Brousse and D. Bélanger, Chem. Mater., 2002, 14, 3946–3952 CrossRef CAS.
- W. Sugimoto, H. Iwata, Y. Yasunaga, Y. Murakami and Y. Takasu, Angew. Chem., 2003, 115, 4226–4230 CrossRef.
- Y. Liu, W. Wang, Y. Wang, Y. Ying, L. Sun and X. Peng, RSC Adv., 2014, 4, 16374–16379 RSC.
Footnote |
| † Electronic supplementary information (ESI) available: (S1–S9) The FT-IR spectra of nanoplatelets and nanodiscs, the adsorption profile, XRD, FESEM and FT-IR spectra of Bi2O2CO3 nanosheets before and after adsorption/photocatalytic processes, photographic images showing adsorption/photocatalytic processes for dye solutions. Tables (ST1–ST5) show unit cell parameters, calculated EVB, ECB from Eg values, RR(%), adsorption capacities and comparison of adsorption profiles. See DOI: 10.1039/c5cp07523h |
|
| This journal is © the Owner Societies 2016 |
Click here to see how this site uses Cookies. View our privacy policy here.  Open Access Article
![[thin space (1/6-em)]](https://www.rsc.org/images/entities/char_2009.gif) 600 ± 10 Lux measured using Extec, USA). The samples (50 mg of catalyst) were dispersed in a 125 mL borosilicate glass bottle which contained 100 mL of organic dye solution (5 × 10⁻⁵ mol L−1: Rh B and MB). Prior to illumination, the suspension was magnetically stirred in the dark for 30 min to attain adsorption/desorption equilibrium. During irradiation, 4 mL of solution was collected at regular time intervals from the suspension mixtures and the catalyst was filtered using a PVDF syringe filter (0.45 μm). The photocatalytic activity of synthesized samples was calculated by measuring the remaining concentration of organic dye using a UV-vis spectrophotometer (T90+, PG instruments, UK).
600 ± 10 Lux measured using Extec, USA). The samples (50 mg of catalyst) were dispersed in a 125 mL borosilicate glass bottle which contained 100 mL of organic dye solution (5 × 10⁻⁵ mol L−1: Rh B and MB). Prior to illumination, the suspension was magnetically stirred in the dark for 30 min to attain adsorption/desorption equilibrium. During irradiation, 4 mL of solution was collected at regular time intervals from the suspension mixtures and the catalyst was filtered using a PVDF syringe filter (0.45 μm). The photocatalytic activity of synthesized samples was calculated by measuring the remaining concentration of organic dye using a UV-vis spectrophotometer (T90+, PG instruments, UK).


![[double bond, length as m-dash]](https://www.rsc.org/images/entities/char_e001.gif) O) stretching vibration peak could be observed at 518 cm−1. Characteristic peaks at 161, 362 and 426 cm−1 are also obtained due to external vibration modes for Raman analysis.45,70 The crystal lattice of anions (CO32−) is hidden under the general positions (C1) for bismutite. Therefore, all vibrational modes become active for both FTIR and Raman analysis (degeneracies are removed).70 The chemical state of the elements and surface compositions of as-synthesized Bi2O2CO3 nanosheets were confirmed by XPS (as shown in Fig. 4c–f). The survey spectrum (Fig. 4c) indicates the presence of Bi, C and O elements, which are located at 160, 288 and 530 eV for chemical binding energy states, respectively. Nevertheless, the core-level XPS signal of the Bi 4f element (Fig. 4d) displays two peaks at 159.0 and 164.3 eV for Bi 4f7/2 and Bi 4f5/2 which could be assigned for spin–orbit splitting of Bi3+ in the Bi2O2CO3 sample. Although, C 1s spectra (Fig. 4e) obviously show two characteristic peaks at 285.0 and 288.9 eV which are due to carbonate ions (CO32−) whereas the spectrum in Fig. 4f demonstrates the O 1s state, confirmed by two peaks at 529.8 and 532.1 eV for Bi–O binding energy and carbonate ion species adsorbed with chemisorbed OH− in the water molecule on to the surface of the sample, respectively.31,45,46 Thus, the XPS spectrum also confirms that the as-synthesized sample is highly pure.
O) stretching vibration peak could be observed at 518 cm−1. Characteristic peaks at 161, 362 and 426 cm−1 are also obtained due to external vibration modes for Raman analysis.45,70 The crystal lattice of anions (CO32−) is hidden under the general positions (C1) for bismutite. Therefore, all vibrational modes become active for both FTIR and Raman analysis (degeneracies are removed).70 The chemical state of the elements and surface compositions of as-synthesized Bi2O2CO3 nanosheets were confirmed by XPS (as shown in Fig. 4c–f). The survey spectrum (Fig. 4c) indicates the presence of Bi, C and O elements, which are located at 160, 288 and 530 eV for chemical binding energy states, respectively. Nevertheless, the core-level XPS signal of the Bi 4f element (Fig. 4d) displays two peaks at 159.0 and 164.3 eV for Bi 4f7/2 and Bi 4f5/2 which could be assigned for spin–orbit splitting of Bi3+ in the Bi2O2CO3 sample. Although, C 1s spectra (Fig. 4e) obviously show two characteristic peaks at 285.0 and 288.9 eV which are due to carbonate ions (CO32−) whereas the spectrum in Fig. 4f demonstrates the O 1s state, confirmed by two peaks at 529.8 and 532.1 eV for Bi–O binding energy and carbonate ion species adsorbed with chemisorbed OH− in the water molecule on to the surface of the sample, respectively.31,45,46 Thus, the XPS spectrum also confirms that the as-synthesized sample is highly pure.


![[double bond, length as m-dash]](https://www.rsc.org/images/entities/char_e001.gif) N– and the intra molecular hydrogen network) whereas in the MO molecular structure (the –N
N– and the intra molecular hydrogen network) whereas in the MO molecular structure (the –N![[double bond, length as m-dash]](https://www.rsc.org/images/entities/char_e001.gif) N– azo group is in the trans position between two aromatic rings) no such steric hindrance is observed.9
N– azo group is in the trans position between two aromatic rings) no such steric hindrance is observed.9


