Reactive oxygen species formed in organic lithium–oxygen batteries†
Received
20th November 2015
, Accepted 15th February 2016
First published on 15th February 2016
Abstract
Li–oxygen batteries with organic electrolytes are of general interest because of their theoretically high gravimetric energy density. Among the great challenges for this storage technology is the generation of reactive oxygen species such as superoxides and peroxides that may react with the organic solvent molecules and other cell components. The generation of such species has been assumed to occur during the charging reaction. Here we show that superoxide is formed also during the discharge reaction in lithium ion-containing dimethyl sulfoxide electrolytes and is released into the solution. This is shown independently by fluorescence microscopy after reaction with the selective reagent 4-chloro-7-nitrobenzo-2-oxa-1,3-diazole and by local detection using a microelectrode of a scanning electrochemcial microscope positioned in a defined distance of 10 to 90 μm above the gas diffusion electrode.
1. Introduction
Rechargeable Li–oxygen cells with organic electrolytes are considered as an ultimate future storage technology mainly because of their very high theoretical gravimetric energy density of 3842 mA h g−1 (considering only the active mass in the discharged state).1 This calculation is based on the following cell reactions:| | | O2 + 2e− + 2Li+ ⇌ Li2O2 | (2) |
Ideally, the charging reaction would proceed as the reversal of reactions (1) and (2). However, several groups showed that charging and discharging reactions lead to a broad spectrum of electrolyte decomposition products.2–6 For instance, ethers,2–4 carbonates,5,7 and sulfoxides like dimethyl sulfoxide (DMSO)6,8 decompose during the oxygen evolution reaction (OER), which has been explained by the reaction of those solvents with intermediate superoxide O2˙− formed by reaction (3).9,10O2˙− is also the typical product of the oxygen reduction reaction (ORR) in organic solution if it is free of proton sources and metal cations such as Li+.11,12If a proton source or Li+ is present, O2˙− rapidly disproportionates according to eqn (5).| | | 2O2˙− + 2Li+ → O2 + Li2O2 | (5) |
Disproportionation reactions are known to be catalyzed homogeneously or heterogeneously especially in aqueous and biological systems.13,14 This offers in principle possibilities of influencing intermediate concentration by the solution composition and the design of the electrode material. A recent study of Peng et al. provided evidence of stable O2˙− adsorbates on polycrystalline Au electrode surfaces even in the presence of a proton source.15 Apart from this, the generation of Li2O2(solv) in the solution may lead to oversaturated solutions and precipitation of solid Li2O2(s) on surfaces.| | | Li2O2(solv) ⇌ Li2O2(s) | (6) |
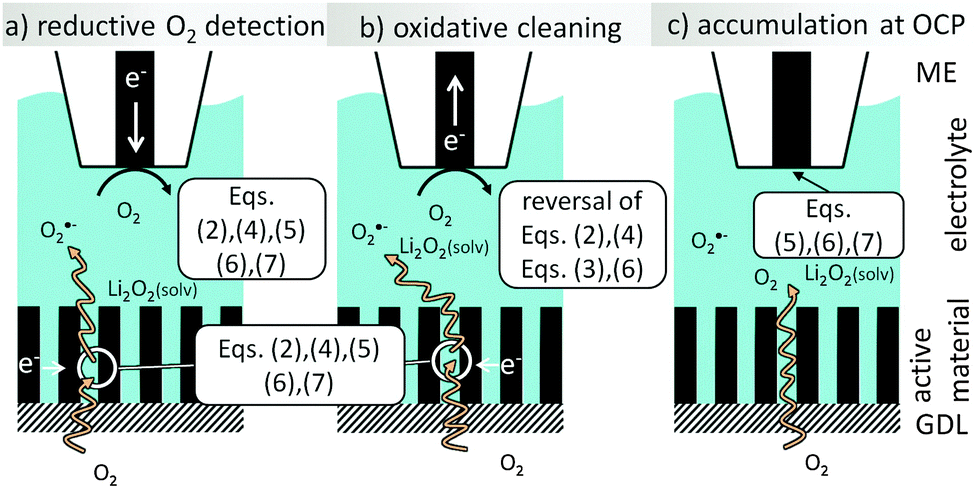
Currently it is unknown to which extent, O2˙− (or derived species such as the ion pair with Li+, LiO2˙) may be formed as an intermediate according to eqn (4) and (7) which may react with the electrolyte or a carbon electrode material before entering into further oxidation (during charging), reduction (during discharging) or disproportionation reactions.Even in alkaline aqueous solution O2˙− has been detected.16 Our previous study on the detection of oxygen ingressing into an Li–oxygen cell by positionable microelectrodes (MEs) indicated a yet unidentified soluble reaction intermediate released during oxygen reduction in Li+-containing DMSO at a porous carbon electrode.17 The experimental setup (Fig. 1) uses a ME at a defined, yet fixed position to detect oxygen species in different working modes.
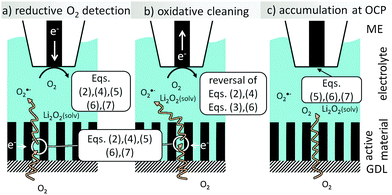 |
| | Fig. 1 Scheme of reactions at the ME and the GDE. | |
During the ORR at the GDE, the ME also performs the ORR to detect the decrease of dissolved O2 above the GDE (redox competition mode of SECM, Fig. 1a). In Li+-containing electrolytes, the electrode surface passivates and can be cleaned by a short oxidative pulse. Here deposited Li2O2 will be oxidized (reversal of eqn (2)). In addition, we found another intermediate that is oxidized while the ORR proceeds at the GDE (Fig. 1b). Here we identify this intermediate as O2˙− upon reaction with a selective fluorogenic dye and investigate its amount by voltammetry at the ME after accumulation of the compound at OCP (Fig. 1c). By this we prove that this compound (or its ion pair with Li+) is transported through solution rather than being present only as an adsorbate on the GDE surface.
2. Experimental
2.1 Chemicals
DMSO (98% purity, Carl Roth GmbH, Karlsruhe, Germany) was deaerated and dried for at least 48 h over a 3 Å molar sieve. A solution from 1 M LiClO4 (≥99.9% purity, Sigma Aldrich, Steinheim, Germany) in dried DMSO was prepared inside an Ar-filled glovebox. 4-Chloro-7-nitrobenzo-2-oxa-1,3-diazole (NBD–Cl) was purchased from Sigma (≥98% purity, Sigma Aldrich, Steinheim, Germany).
2.2 Electrodes
Pt MEs were produced by sealing a Pt wire of 50 μm diameter (Goodfellow Cambridge Ltd, Huntigdon, England) with a laser-heated micropipette puller (P-2000, Sutter Instruments, Novato, USA) in borosilicate glass capillaries. The assembly was successively polished in an aqueous suspension of 0.3 μm and 0.05 μm Al2O3 particles (MicroPolish II, Buehler, Düsseldorf, Germany). The RG-value, i.e. the ratio of the outer probe radius rglass = 120 μm (from laser microscopy), and the radius of the active electrode area rT = 16.9 μm (from the diffusion-limiting current in aqueous 1 mM ferrocenemethanol solution +0.1 M KNO3) was RG = 7.1. For all measurements a Pt wire auxiliary and an Ag wire quasi-reference electrode were used. All potentials are given with respect to the Ag-QRE.
The gas diffusion electrode (GDE) was prepared from a slurry composed of 4.36 g of carbon particles (Vulcan XC R, Worlee-Chemie GmbH, Hamburg, Germany) and 0.68 g of binder (Kynar Flex 2801, Tetrachim, Noisiel, France) uniformly dispersed in 45 ml of N-methylpyrrolidone (Carl Roth GmbH & Co. KG, Karlsruhe, Germany). The slurry was applied to a carbon paper (Toray™ TP060, Toray Industries, Inc., Tokyo, Japan) by a doctor blade (Erichsen GmbH & Co KG, Hemer, Germany) with a wet thickness of 120 μm. The carbon paper was pre-treated upon immersion into a polytetrafluoroethylene suspension (polytetrafluoroethylene preparation, 60 mass% in H2O, Sigma–Aldrich, Steinheim, Germany) for 30 s in order to prevent the wetting of the carbon paper by the organic solvent. The GDE was dried in a two-step process (30 min at 80 °C followed by 90 min at 120 °C). For all measurements a Pt wire auxiliary and an Ag wire quasi-reference electrode were used.
2.3 Apparatus and procedures
Superoxide radical formation was monitored after reaction with NBD–Cl by fluorescence using an optical microscope (DM IRE2, inverted configuration, Leica Microsystems GmbH, Wetzlar, Germany) with a HC PL FLUOTAR objective (5×, NA = 0.3, Leica) and a tungsten lamp filtered with a dichroic filter set within the wavelength range of 440–495 nm. Emitted light passing a 515 nm long pass filter was recorded using a DC152QC-FI sCMOS camera (scientific CMOS, Andor Technology, Darmstadt, Germany) attached to the third optical port of the microscope (Fig. 2). The time step setting of the sCMOS was 1 s per frame.
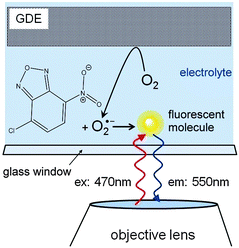 |
| | Fig. 2 Fluorescence microscopy setup. Oxygen is reduced at the GDE from the oxygen saturated solution (1 M LiClO4, 0.5 mM NBD–Cl in DMSO). The dye selectively reacts with the superoxide to form a fluorescent molecule which is excited at 470 nm wavelengths and emits at 550 nm wavelengths. | |
The GDE was mounted with the active layer facing downwards. It contacted a 1 mm thick solution layer sandwiched between the GDE and the viewing window. The GDE was connected to a Cu-wire using an electrically conductive epoxy adhesive (EPO-TEK H24, Epoxy Technology Inc., 14 Fortune Drive, Billerica, USA) which was sealed with PDMS. A potentiostat (CH700B, CH Instruments Inc., 3700 Tennison Hill Drive, Austin, USA) in three-electrode configuration was used to drive the oxygen reduction reaction at the GDE in a chronoamperometric experiment while observing fluorescence emission.
All SECM measurements were performed in a specialized setup described before.17 It was run under SECMx18 software and used a positioning system (mechOnics AG, Munich, Germany) and two interconnected Gamry Reference 600 potentiostats acting as a bipotentiostat (Gamry Instruments, Warminster, USA). AC-SECM was used to move the ME to the GDE surface as described before19–21 using a frequency of 100 kHz and an amplitude of 50 mV. The GDE was left at open circuit potential (OCP). The solutions resistance was measured using AC-SECM while approaching the ME toward the substrate. The distance between the ME and the GDE was determined by fitting the approach curve to calculated SECM approach curves of conductive substrates.22 The measurements were performed in a custom-made chamber containing two different gas reservoirs, one above the GDE and the electrolyte reservoir, and one below the GDE. Prior to the experiment both gas chambers were purged with Ar. The Ar flow was sustained at the upper chamber. After dosing in the degassed electrolyte with a syringe through the septum, the lower chamber was continuously purged with a 2 vol% O2/98 vol% Ar gas mixture at a total flow rate of 100 mL min−1 and pressure slightly above 1 bar during the whole experiment.
3. Results and discussion
3.1 Superoxide radical detection by fluorescence microscopy
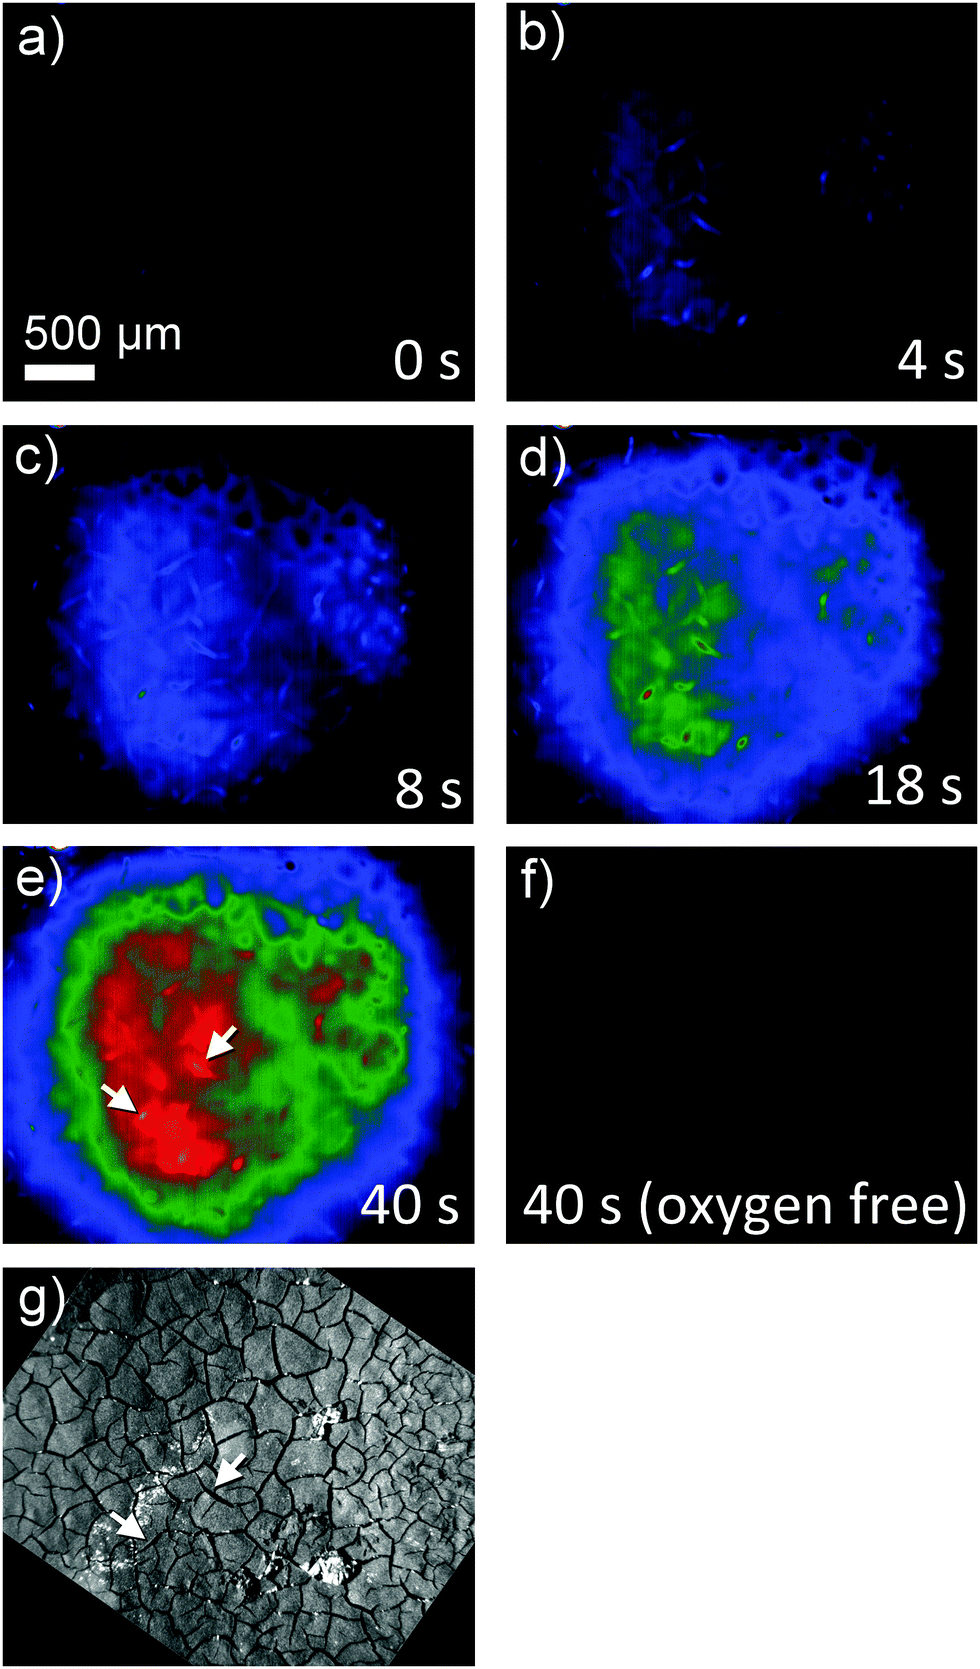
Superoxide can be indirectly detected via monitoring its reaction products.23,24 For instance, after reaction of O2˙− with NBD–Cl, absorbance measurements at 470 nm or fluorescence spectroscopy upon excitation at 470 nm and emission at 550 nm wavelengths provide selective detection of O2˙− radicals. This method was used here in combination with a chronoamperometric pulse program applied to the GDE and the spatially and temporally resolved detection of fluorescence using a CMOS camera. For a better evaluation the background fluorescence from the GDE must be compensated. In order to remove this contribution, the GDE was biased at EGDE = 0 V for 60 s, where no ORR current can be detected. The image taken at t = 60 s was used as a reliable background and was subtracted from all subsequent recordings taken at more negative potentials (Fig. 3). After 60 s the potential was switched to EGDE = −0.7 V for 60 s to cause the ORR in the oxygen-saturated electrolyte. The production of O2˙− is evident from the increasing fluorescence intensity recorded between t = 4 s and t = 40 s after the potential step (Fig. 3, panel (a)–(e)). A control measurement proved that no fluorescent product was formed at EGDE = −0.7 V in an oxygen-free electrolyte (Fig. 3, panel (f)). Fig. 3g shows the corresponding reflection image recorded after the completion of the fluorescence experiments in solution. One prominent feature has been marked in Fig. 3e and g that allows relocation of a particular point in Fig. 3b–g. The white structures are debris that appear only after the solution experiments and could not be removed without detaching flakes of the fragile GDE.
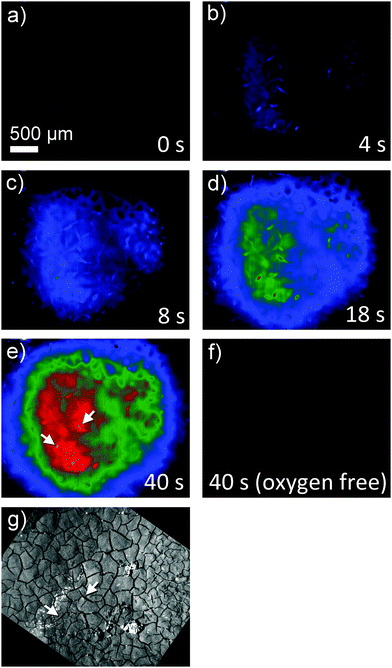 |
| | Fig. 3 Fluorescence microscopy image sequence at (a) 0 s at EGDE = 0 V (background) as well as (b) 4 s, (c) 8 s, (d) 18 s and (e) 40 s after the start of an ORR pulse at the GDE (EGDE = −0.7 V). Panel (f) shows an image taken after holding the GDE at EGDE = −0.7 V for 40 s in oxygen-free electrolyte solution. The optical focus was set to the GDE surface. Solution was 1 M LiClO4 in DMSO. Panel (g) is an optical reflection image in the same scale. The marker in panels (e) and (g) shall aid the relocation of specific structures between the fluorescence and reflection images. | |
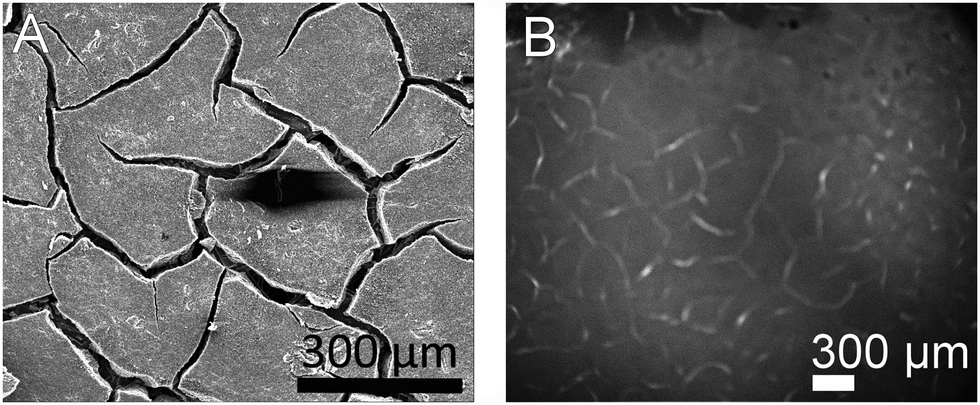
During drying, the slurry of the active carbon materials forms cracks (Fig. 4A) as commonly seen in GDE processed according to similar protocols.25 When switching on the ORR at the GDE by applying a potential pulse of EGDE = −0.7 V, the highest fluorescence intensity after 4 s reaction time is observed in the cracks (Fig. 4B). The higher fluorescence intensity in the cracks is particularly obvious after switching on the ORR and decreases with time due to the diffusion of the fluorescent molecules into the solution bulk until it vanishes after 50 s of the ORR. Several facts may contribute to a higher fluorescence intensity inside the cracks. Firstly, the solution layer probed by the fluorescence measurement is thicker in the cracks compared to the optically opaque mesoporous carbon material of the GDE. Secondly, oxygen transport may be a limiting factor for solution-filled pores that leads to higher production of O2˙− in the regions of the GDE facing the outer solution volume. Thirdly, O2˙− formed in the inner pore volume may consume all the NBD–Cl inside the pore which leads to incomplete scavenging of O2˙−, which may open up reaction channels for the follow-up reaction such as a further reduction step or disproportionation.
 |
| | Fig. 4 (A) SEM image of GDE, cracks in the active layer make the carbon paper beneath visible, (B) optical image of fluorescence intensity after 4 s of oxygen redution at the GDE (EGDE = −0.7 V) in 1 M LiClO4 in DMSO. | |
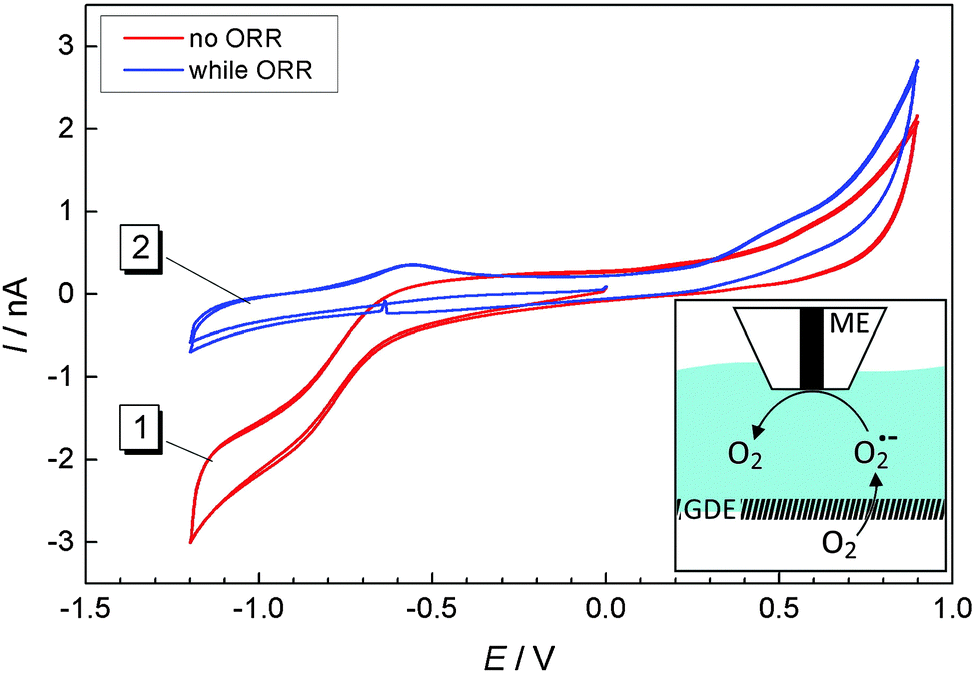
According to eqn (2), solid Li2O2 is formed during the ORR. However, our previous studies17 as well as Fig. 3 and 4 showed that a soluble reaction product is also released into the liquid electrolyte solution. In order to detect this product in tip-substrate voltammetry in a SECM configuration, the ME was positioned at a distance of 10 μm above the GDE by AC-SECM. The lower gas compartment was flushed with a mixture of 2 vol% O2/98 vol% Ar while Ar was used to continuously purge the upper gas compartment. Fig. 5 shows CVs recorded at the ME in a potential window between −1.2 V and 0.9 V with a scan rate ν = 0.1 V s−1. In Fig. 5, curve 1 shows the ME CV when the GDE was held at OCP and thus O2 can permeate freely into the electrolyte. Therefore, the known reduction of O2 to O2˙− is observed at the ME at potentials negative of ET = −0.5 V.26,27 No peaks appear in the anodic half-cycle because the reaction product at the ME diffuses into the bulk solution and the amount of deposited Li2O2 on the ME is too small. When applying the potential of EGDE = −0.7 V to the GDE, less oxygen reaches the ME because it is consumed at the GDE. Therefore, the ORR current at the ME is decreased in the potential range below ET = −0.5 V (Fig. 5, curve 2). However, two peaks appear in the positive going half-cycle that are not detected when the GDE is at OCP. The peak around ET = −0.55 V seems to be related to the oxidation of O2˙− ions present as dissolved compounds within a diffusion layer above the macroscopic GDE. The potential of the signal close potential of the one electron oxygen reduction in the negative going half-cycle makes this assignment plausible. It also agrees with the fluorescence detection of O2˙− in Fig. 3. The second peak appears at ET = +0.4 V.
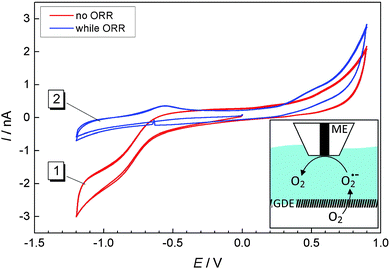 |
| | Fig. 5 CVs recorded at a ME at a distance of 10 μm above a GDE in 1 M LiClO4 in DMSO; curve (1) GDE was held at OCP; curve (2) oxygen reduction at the GDE at EGDE = −0.7 V. The scan rate was 100 mV s−1. Inset: Experimental setup, oxygen from the lower gas compartment is reduced at the GDE to superoxide which diffuses towards the ME where it is oxidized/detected. | |
In our previous work we found that continuous detection of oxygen at a Pt ME in a Li+-containing DMSO requires periodic regeneration of the Pt electrode surface because it becomes blocked with a solid reaction product in Li+-containing electrolytes, most likely Li2O2. This behavior was also described by Sawyer and Roberts before.28 A potential of 0.9 V was required to clean the electrode surface. The potential of the second oxidation signal at ET = +0.4 V agrees with this compound and is also in line with reported potentials for Li2O2 oxidation in organic electrolytes.27 Li2O2 may reach the ME surface in different ways. It can be deposited as a solid cover layer as a result of disproportionation of O2˙− according to eqn (5). Dissolved Li2O2 may diffuse from the GDE to the ME if Li2O2 possesses a finite solubility in DMSO. In particular, diffusive transport as an ion pair must be considered in this respect (eqn (6)).
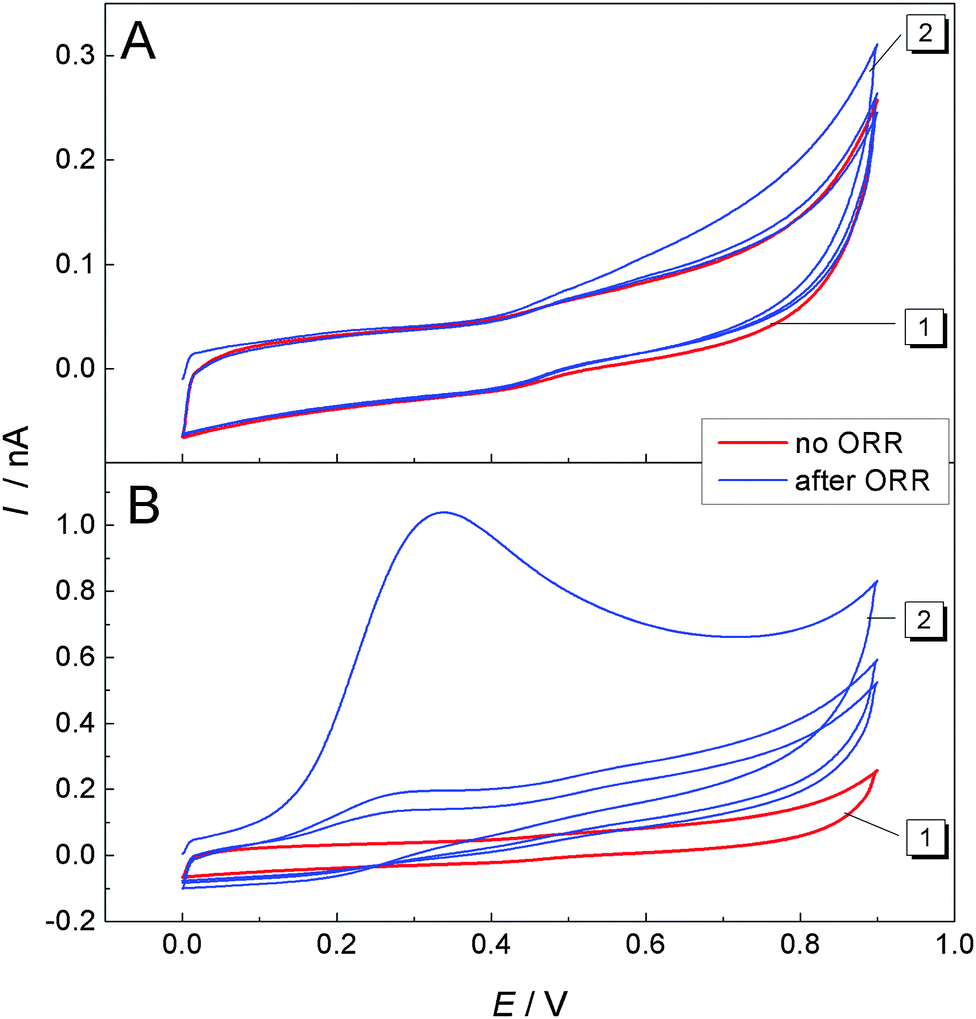
For further investigations of the signal at ET = +0.4 V, the potential window for the CV was restricted to 0 V < ET ≤ 0.9 V. In Fig. 6A, curve 1 (red) shows a CV recorded at the ME while the GDE was at OCP and had not been used before for the ORR. The curves show mainly capacitive currents. Afterwards the ME was left at OCP for further 15 min. Also the GDE was resting at OCP. After this incubation, another multicylce CV was recorded at the ME from which the first three cycles are shown in Fig. 6A, curve 2. Only a very small difference in the first positive-going half-cycle is noticeable compared to the measurement before incubation time (Fig. 6A, curve 1). Because the second cycle retraces exactly the CV recorded before the incubation period, it is likely that deposits accumulated during the incubation period on the surface of the ME causing a small difference in the first half cycle of the two CVs at potentials ET > 0.4 V in Fig. 6A. These deposits are electrochemically removed during the first positive going half-cycle.
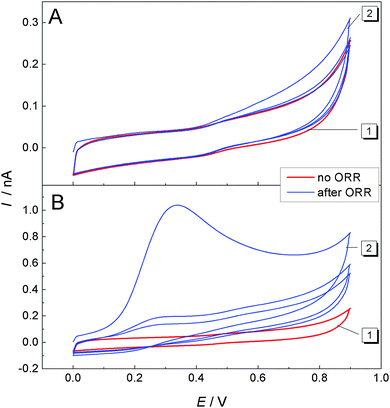 |
| | Fig. 6 CVs recorded at a ME at a distance of 10 μm above a GDE in 1 M LiClO4 in DMSO. (A) CV while the GDE is at OCP (curve 1, red) and CV after the GDE was at rest for 15 min (curve 2, blue); (B) curve 1 (red) is identical to panel A, curve 1; curve 2 (blue) is the ME CV after the GDE was operated at EGDE = −0.7 V for 120 s and then left for 15 min at OCP. The first 3 cycles of multi-cycle CVs are shown. The scan rate was 100 mV s−1. | |
Curve 2 in Fig. 6B shows a multicycle CV after a 15 min incubation period at which the ME and the GDE were at OCP. Prior to this 15 min the GDE performed an ORR at EGDE = −0.7 V for 120 s. A large peak is recorded in the first positive-going half cycle only. The absence of such a peak in subsequent cycles implies that it results from the oxidation of a compound that was accumulated during the incubation period at the surface of the ME. The dependence of this signal on a previous ORR at the GDE proves that the accumulated compound has been formed during the oxygen reduction reaction at the GDE. Since there is a solution layer of 10 μm between the GDE and the ME, there must be a soluble (side) product of the ORR reaction in Li+-containing DMSO at the carbon GDE. In principle this could be O2˙− and a supersaturated Li2O2 solution from which it is deposited on the ME body acting as a crystallization seed. The presence of O2˙− has been proven by fluorescence microscopy (Fig. 3 and 4). Curve 2 of Fig. 5 also indicates the presence of O2˙− in the diffusion layer above the GDE by the oxidation signal at ET = −0.55 V. There is also a signal for the oxidation of Li2O2 at ET = +0.4 V. Integration of the current between 0.4 V ≤ ET ≤ 0.9 V in curve 2 of Fig. 6B with respect to time yield a charge of Q = 3.82 × 10⁻⁹ C. Assuming that this charge originates from the 2e− oxidation of a compact Li2O2 (molar mass M = 45.9 g mol−1) layer with a density29 of ρ = 2.3 g cm−3 leads to a layer thickness of d = 0.44 nm (eqn (8)).
| | 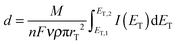 | (8) |
where
rT the radius of the ME,
F the Faraday constant,
n the number of electrons transferred,
ν the scan rate and
I(
E) the current measured at the ME.
Longer reduction pulses at the GDE lead to more material at the ME. However, the obtained peak splits in two components, which grow differently with increasing reduction time at the GDE (ESI,† SI-1).
3.2 Distance dependence of superoxide detection
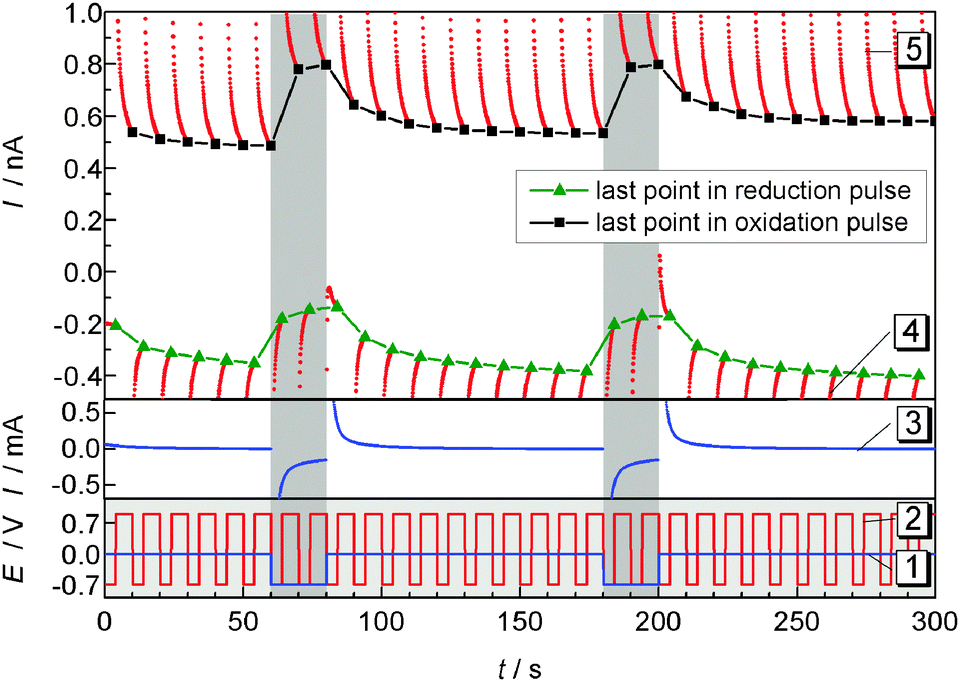
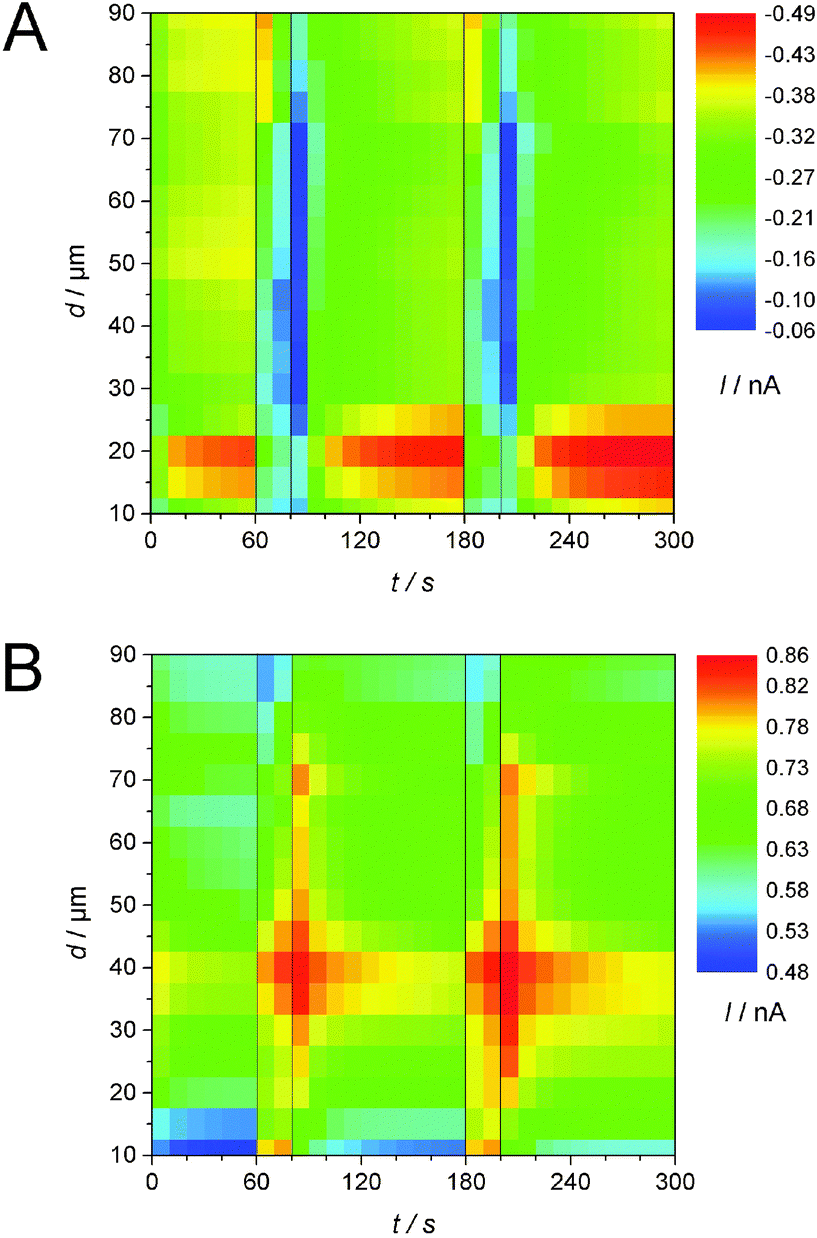
Pulsed amperometric detection as described before17 was performed at different distances of the ME to the GDE (Fig. 7). The ME was positioned 10 μm above the GDE via AC-SECM. By applying a pulse potential program to the ME, oxygen reduction and oxidation of ORR products at the ME are recorded alternatively (Fig. 7 curve 2). A second pulse program was applied to the GDE to initiate oxygen reduction for 20 s intervals after 60 s and 180 s from the start of the measurement (Fig. 7, curve 1). The blue line in the middle panel represents the transient current at the GDE in response to a potential pulse at the GDE. In the upper panel of Fig. 7 the ME current is plotted as red dots for each acquired data point. Corresponding to the applied potential ET the current alternates between the reduction of O2 and the oxidation of a surface-bound product. The last point of each pulse is highlighted either in black squares (oxidation) or in green triangles (reduction). Those values, i.e. one data point every 10 s can be used to construct images or line scans. The lines connecting the highlighted points are guides to the eye only. Here a different approach compared to imaging or recording of linescans was selected. The double pulse experiment was repeated at different distances d from 10 μm to 90 μm with an increase of 5 μm. Fig. 8 combines these 17 pulse experiments to false color maps where the color indicates the ME current. Fig. 8A shows the last currents of each reduction pulse at the ME (Fig. 7, curve 4, green triangles) whereas Fig. 8B was constructed from the last ME current value from the oxidative cleaning pulses (e.g.Fig. 7, curve 5, black squares). The horizontal axis represents the time axis. Each pulse sequence of the ME takes 10 s (4 s reduction, 6 s oxidation). One current value for each 10 s interval is plotted in Fig. 8A and B. The vertical distance is the ME–GDE distance used in each pulse sequence.
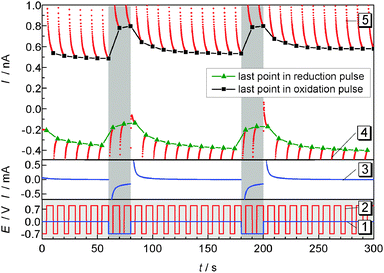 |
| | Fig. 7 ORR (4 s) and cleaning pulses at the ME (6 s) during the pulsed ORR at the GDE in 1 M LiClO4 in DMSO. After 60 s and 180 s oxygen is reduced at the GDE for 20 s. Lower panel: potential programs of the GDE (curve 1) and of the ME (curve 2); middle panel: current at the GDE (curve 3); upper panel: current at the ME (curve 4 and 5), the last points within each potential pulse are highlighted as green triangles (reduction) or black squares (oxidation). The solid black and green lines are guides to the eye illustrating the current trace used to construct Fig. 8A and B; d = 10 μm. | |
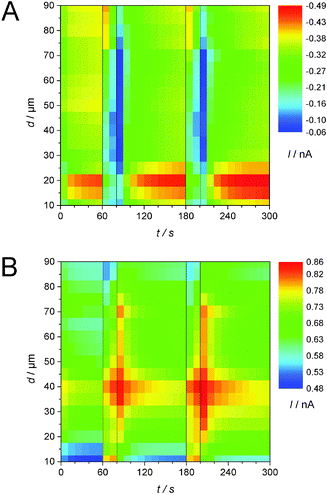 |
| | Fig. 8 False color maps constructed from 17 pulsed amperometric detections as exemplified in Fig. 7. For each amperometric recording the ME–GDE distance was increased by 5 μm between 10 μm and 90 μm. The current values were extracted from the last points of a reduction pulse (A) or of an oxidation pulse (B) as shown in Fig. 7 and are shown here as false colors. O2 was reduced at the GDE (EGDE = −0.7 V) at t = 60 s and t = 180 s for 20 s. | |
Since the potential has to be sufficiently high for an oxidative removal of the blocking layer at the ME, ET = +0.9 V was chosen. At this potential it is impossible to distinguish between different ORR products. Both O2˙− and solid Li2O2 deposited on the ME and dissolved Li2O2 may contribute to the oxidation current at the ME. Nevertheless, the effect of oxygen reduction at the GDE can be seen in both graphs. When the potential of the GDE is switched from EGDE = 0 V to EGDE = −0.7 V for 20 s after 60 s and 180 s to initiate the ORR at the GDE, the reduction current at the ME decreases because O2 is already consumed at the GDE (Fig. 8A). Despite the low time resolution of 10 s, one can also see that the decrease of the ME current is less steep, if the ME–GDE distance increases in agreement with the development of a macroscopic O2 diffusion layer above the GDE. The ME current increases again when the ORR stops at the GDE. The ingress of O2 leads to a diffusion layer above the GDE where the O2 concentration decreases from the GDE towards the solution bulk when the GDE is at OCP. Because the diffusion layer above the GDE is not in the steady state, the O2 concentration change is particular steep. At distances below 25 μm the ME body shields the flux of O2 towards the ME and this decreases the O2 flux to the ME. This effect has been observed in sample-generation/tip-collection experiments before albeit in different contexts.30–32
Fig. 8B shows an equivalent false color map constructed from the last point of the oxidative cleaning pulses at the ME of the same pulse experiments as used for Fig. 8A. Within the time resolution of the measurement (10 s), an instantaneous increase in current for the cleaning pulses at the ME is noticeable when the GDE conducts the ORR for distances of d = 10 μm and d = 15 μm. The short diffusion path for any soluble intermediate makes it possible to diffuse accross the electrolyte layer between the ME and the GDE within the time for one double pulse. When switching the GDE back to EGDE = 0 V at t = 80 s and t = 200 s, the ME current does not return immediately to the value recorded immediately before the start of the reduction pulse at the GDE because the remaining O2˙− in the solution volume between the ME and the GDE constitutes a reservoir that is only slowly depleted by the reaction at the ME, diffusion to the solution bulk and reaction at the GDE. The time for the decay of the oxidative currents is increased with increasing working distance because the shielding of the ME with respect to the solution bulk but also the effect of a possible reaction at the GDE at the local concentration is decreased. This is evident for distances from d = 10 μm to d = 40 μm in Fig. 8B. The maximum current is shifting to later times due to the increasing diffusion length. The highest current for the cleaning pulses is observed at a distance of d = 40 μm. This phenomenon can be explained by the combined action of four processes: (i) a concentration gradient of soluble reaction products from the ORR at the GDE (O2˙−, perhaps supersaturated Li2O2(solv)) will lead to a decrease in local concentration with an increase in the distance to the GDE. (ii) At short ME–GDE distances the insulating sheath of the ME hinders the diffusion of these species from the solution bulk towards the ME.33 (iii) Reaction products produced directly beneath the ME during reduction pulses at the GDE can reach the ME directly without geometric hindrance by the insulating sheath of the UME. (iv) The superoxide may undergo disproportionation reaction according to eqn (5). This reaction is likely to be of the second order. As a consequence the local concentration will initially decay very rapidly but at small concentration the reaction proceeds at a slow rate and traces of O2˙− can exist for relatively long times as observed in Fig. 8B. Those four considerations will give us a maximum current at a certain distance, here d = 40 μm. At larger distances, the influence of the radicals from the bulk phase gain influence. At a distance of d = 75 μm another effect becomes dominating. When O2 is reduced at the GDE, this affects the ORR current and the ME only slightly because the O2 diffusion layer at this distance is less disturbed than at shorter distances. Hence the amount of deposited Li2O2 does not vary as strongly as at shorter distances. Consequently, less Li2O2 can be oxidized and the current decreases. At t = 70 s and t = 190 s the current increases again and reaches its maximum at the next ME pulse cycle. The phenomenon is due to the slightly larger diffusion coefficient of O2 compared to that of the O2˙− in DMSO.28 Data obtained at larger distances show an increase of the influence of the O2 concentration and a decrease of the influence of O2˙−.
4. Conclusion
In our previous work we reported the detection on an unidentified soluble species of the ORR at the carbon GDE in 1 M LiClO4 in DMSO,17i.e. not all oxygen reduction products seem to be deposited as Li2O2 or Li2O at the GDE. Here we proved by detection with NBD–Cl that soluble O2˙− is formed at least as an intermediate. Since the reaction with the fluorogenic compound NBD–Cl removes O2˙− and the stable reaction product with NBD–Cl diffuses away from the GDE, no conclusions are possible from these measurements about the local concentration of O2˙− above the GDE. SECM substrate-generation/tip-collection experiments were performed to access the local concentration of various species during the pulses. They showed two oxidation peaks at the ME while the GDE performed the ORR. Based on the similarity of the peak potential to the peak for O2˙− generation at the ME, one peak is assigned to the oxidation of the O2˙− radical. The second peak appears due to the oxidation of a solid lithium–oxygen species, most probably Li2O2 deposited on the surface of the ME. It could be removed by only one half-cycle of a CV. No hints for further dissolved species were found.
By combining several potential pulse experiments to one false color map it was possible to visualize the correlation between the ME–GDE distance and the local O2 concentration and the O2˙− concentration, respectively. The influence of O2˙− decreases for distances larger than d = 75 μm.
The occurrence of soluble reactive oxygen species during charging and discharging reactions in Li–oxygen cells will not only cause decomposition reactions with solvent and electrolyte constituents but may also lead to the attack on solid components that are spatially separated from the GDE. Deposition of lithium oxides may further impact passivation layers and thus the kinetics of various interfacial reactions. Means of controlling the generation of superoxide and/or its further reaction close to the GDE may represent a sensible way of overcoming the obstacles described above.
Acknowledgements
The study was funded by the Lower Saxony Ministry of Science and Culture. S. D. gratefully acknowledges a PhD study grant from German Academic Exchange Office (DAAD).
References
- M. Balaish, A. Kraytsberg and Y. Ein-Eli, Phys. Chem. Chem. Phys., 2014, 16, 2801–2822 RSC.
- S. A. Freunberger, Y. Chen, N. E. Drewett, L. J. Hardwick, F. Bardé and P. G. Bruce, Angew. Chem., Int. Ed., 2011, 50, 8609–8613 CrossRef CAS PubMed.
- J. M. García, H. W. Horn and J. E. Rice, J. Phys. Chem. Lett., 2015, 6, 1795–1799 CrossRef PubMed.
- D. Zhu, L. Zhang, M. Song, X. Wang, J. Mei, L. M. Lau and Y. Chen, J. Solid State Electrochem., 2013, 17, 2865–2870 CrossRef CAS.
- S. A. Freunberger, Y. Chen, Z. Peng, J. M. Griffin, L. J. Hardwick, F. Bardé, P. Novák and P. G. Bruce, J. Am. Chem. Soc., 2011, 133, 8040–8047 CrossRef CAS PubMed.
- N. Mozhzhukhina, L. P. Méndez De Leo and E. J. Calvo, J. Phys. Chem. C, 2013, 117, 18375–18380 CAS.
- B. D. McCloskey, D. S. Bethune, R. M. Shelby, G. Girishkumar and A. C. Luntz, J. Phys. Chem. Lett., 2011, 2, 1161–1166 CrossRef CAS PubMed.
- C. J. Bondue, A. A. Abd-El-Latif, P. Hegemann and H. Baltruschat, J. Electrochem. Soc., 2015, 162, A479–A487 CrossRef CAS.
- V. S. Bryantsev, V. Giordani, W. Walker, M. Blanco, S. Zecevic, K. Sasaki, J. Uddin, D. Addison and G. V. Chase, J. Phys. Chem. A, 2011, 115, 12399–12409 CrossRef CAS PubMed.
- V. S. Bryantsev, J. Uddin, V. Giordani, W. Walker, D. Addison and G. V. Chase, J. Electrochem. Soc., 2013, 160, A160–A171 CrossRef CAS.
- A. D. Goolsby and D. T. Sawyer, Anal. Chem., 1968, 40, 83–86 CrossRef CAS.
- C. P. Andrieux, P. Hapiot and J. M. Saveant, J. Am. Chem. Soc., 1987, 109, 3768–3775 CrossRef CAS.
- E. S. Boyd and G. K. Druschel, Appl. Environ. Microbiol., 2013, 79, 2061–2068 CrossRef CAS PubMed.
- G. P. Haight and K. M. Rahmoeller, Polyhedron, 1986, 5, 507–509 CrossRef CAS.
- Z. Peng, Y. Chen, P. G. Bruce and Y. Xu, Angew. Chem., Int. Ed., 2015, 54, 8165–8168 CrossRef CAS PubMed.
- C. Zhang, F.-R. F. Fan and A. J. Bard, J. Am. Chem. Soc., 2009, 131, 177–181 CrossRef CAS PubMed.
- P. Schwager, D. Fenske and G. Wittstock, J. Electroanal. Chem., 2015, 740, 82–87 CrossRef CAS.
- C. NunesKirchner, K. H. Hallmeier, R. Szargan, T. Raschke, C. Radehaus and G. Wittstock, Electroanalysis, 2007, 19, 1023–1031 CrossRef.
- K. Eckhard and W. Schuhmann, Analyst, 2008, 133, 1486–1497 RSC.
- D. M. Osbourn, R. H. Sanger and P. J. S. Smith, Anal. Chem., 2005, 77, 6999–7004 CrossRef CAS PubMed.
- B. R. Horrocks, D. Schmidtke, A. Heller and A. J. Bard, Anal. Chem., 1993, 65, 3605–3614 CrossRef CAS PubMed.
- M. V. Mirkin, F.-R. F. Fan and A. J. Bard, J. Electroanal. Chem., 1992, 328, 47–62 CrossRef CAS.
- G. Bartosz, Clin. Chim. Acta, 2006, 368, 53–76 CrossRef CAS PubMed.
- J. Burns, W. Cooper, J. Ferry, D. W. King, B. DiMento, K. McNeill, C. Miller, W. Miller, B. Peake, S. Rusak, A. Rose and T. D. Waite, Aquat. Sci., 2012, 74, 683–734 CrossRef CAS.
- R. Zeis, Beilstein J. Nanotechnol., 2015, 6, 68–83 CrossRef PubMed.
- I. Gunasekara, S. Mukerjee, E. J. Plichta, M. A. Hendrickson and K. M. Abraham, J. Electrochem. Soc., 2014, 161, A381–A392 CrossRef CAS.
- C. O. Laoire, S. Mukerjee, K. M. Abraham, E. J. Plichta and M. A. Hendrickson, J. Phys. Chem. C, 2010, 114, 9178–9186 CAS.
- D. T. Sawyer and J. L. Roberts, J. Electroanal. Chem., 1966, 12, 90–101 CAS.
-
W. M. Haynes and D. R. Lide, CRC Handbook of Chemistry and Physics: A Ready-reference Book of Chemical and Physical Data, CRS Press, Boca Raton, 2014 Search PubMed.
- B. R. Horrocks, M. V. Mirkin, D. T. Pierce, A. J. Bard, G. Nagy and K. Toth, Anal. Chem., 1993, 65, 1213–1224 CrossRef CAS.
- O. Sklyar, M. Träuble, C. Zhao and G. Wittstock, J. Phys. Chem. B, 2006, 110, 15869–15877 CrossRef CAS PubMed.
- L. Stoica, S. Neugebauer and W. Schuhmann, Adv. Biochem. Eng./Biotechnol., 2008, 109, 455–492 CrossRef CAS PubMed.
- R. Cornut and C. Lefrou, J. Electroanal. Chem., 2008, 621, 178–184 CrossRef CAS.
Footnote |
| † Electronic supplementary information (ESI) available: Accumulation of dissolved species at the ME over longer time. See DOI: 10.1039/c5cp07145c |
|
| This journal is © the Owner Societies 2016 |
Click here to see how this site uses Cookies. View our privacy policy here. 
 Open Access Article
 This Open Access Article is licensed under a Creative Commons Attribution-Non Commercial 3.0 Unported Licence
 *a
*a