 Open Access Article
Creative Commons Attribution 3.0 Unported Licence
Isosteric and fluorescent DNA base pair formed by 4-amino-phthalimide and 2,4-diaminopyrimidine: melting, structure, and THz polar solvation dynamics†
L.
Dehmel‡
a,
F.
Berndt‡
a,
M.
Weinberger
b,
M.
Sajadi
a,
I.
Ioffe
c,
H.-A.
Wagenknecht
*b and
N. P.
Ernsting
*a
aDepartment of Chemistry, Humboldt-Universität zu Berlin, 12489 Berlin, Germany. E-mail: nernst@chemie.hu-berlin.de
bInstitute of Organic Chemistry, Karlsruhe Institute of Technology (KIT), 76131 Karlsruhe, Germany. E-mail: wagenknecht@kit.edu
cDepartment of Chemistry, Lomonosov Moscow State University, Moscow, Russia
First published on 9th February 2016
Abstract
An artificial base pair in the center of a duplex DNA oligomer, formed by 2,4-diaminopyrimidine and fluorescent 4-aminophthalimide C-nucleosides, is characterized spectroscopically, with a view towards its use in femtosecond solvation dynamics. Quantum-chemical calculations predict H-bonding energy equivalent to A:T. UV-vis absorption spectra provide insight into local melting at the 4-aminophthalimide modification site. Increase of temperature to nearly the melting temperature of the duplex leads to better hybridisation of the fluorescent nucleoside, contrary to native base pairs. This unusual observation is explained by the NMR solution structure of the duplex. Two conformations are adopted by the artificial pair due to backbone constraints, having either two or one interbase hydrogen bonds. In the latter, hydrogen bonding sites remain accessible for water solvation. The time-resolved dynamic Stokes' shift of 4-aminophthalimide fluorescence is consistent with that of a mixture of a slow and fast species. From the observations, the optimal linkage between 4-aminophthalimide and 2-deoxyribose for fitting into the duplex B-DNA structure is deduced.
Introduction
Fluorescence spectroscopy is currently the most sensitive method to study nucleic acids and their interactions. Because the native nucleobases are inherently not emissive, fluorescent base analogues must be developed to serve the various experimental needs. A fluorescent chromophore may be introduced by tethering to a native nucleobase, as an expanded base or, most elegantly, as an isosteric nucleobase substitute that is capable of molecular recognition towards the counterstrand.1 The earliest example for the latter approach is 2-aminopurine,2,3 a substitute for adenine that pairs with thymine and has high fluorescence quantum yield when free in solution but only 1% of that yield when incorporated into nucleic acids. Recently thienoguanine has been developed4 as a substitute for guanine and to overcome 2-aminopurine's deficiencies with respect to the quantum yield. Moreover a “push–pull” fluorescent nucleoside analogue, composed of dimethylaniline fused to cytosine, has been synthesized in order to track conformational changes of i-motif DNA in real time.5The central observable in most of these and similar studies is the intensity of steady-state fluorescence, as nonradiative decay channels are opened or closed when the supramolecular structure changes into a different state.6 Alternatively the color of fluorescence can be followed when the fluorescent nucleobase is solvatochromic and the emission peak frequency νfls is affected by the environment and its change. Different H-bonding interactions and polarization of the supramolecular structure cause a shift of the fluorescence band. One may even induce the difference by optical excitation S1 ← S0 of the probe and then monitor the relaxation of the surrounding. This is realized by following the time-dependent Stokes shift (TDSS) νfls(t) of fluorescence S1 → S0 on a timescale ranging from femtoseconds to nanoseconds. Using 2-aminopurine as a nucleobase substitute in a duplex DNA oligomer, Zewail and coworkers showed that the TDSS reflects the dynamics of the hydration layer.7 Polar solvation dynamics of DNA constructs has since become an active field of research.8–15
The fluorescent polarity probe plays a crucial role in studying DNA solvation dynamics. Ideally the embedded probe should fulfill a number of requirements: (i) a large total dynamic Stokes' shift Δνfls = νfls(0) − νfls(∞) enables the detection of small, but essential, relaxation components, (ii) the excited-state lifetime should be as long as possible to allow the observation of slow relaxation components, (iii) the probe should be rigid, ensuring that νfls(t) reports faithfully about the environment only and not about internal relaxation processes, (iv) the duplex DNA structure should not be altered by the isosteric base substitution, so that results may be assumed to apply to the native duplex. The difficulty lies in meeting all requirements simultaneously. For example, even though 2-aminopurine is perfectly isosteric to adenine and the base pair 2-aminopurine:T does not deviate significantly from the A:T structure,16 the total Stokes' shift Δνfls = 693 cm−1 of intrinsic 2-aminopurine7 is too small to capture minor relaxation components. To alleviate this and other problems, Berg and coworkers8–10 used a coumarin C-nucleoside opposite an abasic site as a non-isosteric base substitute, in effect replacing an entire base pair. But in this case neither thermodynamic nor structural information is available about how the coumarin nucleobase fits into the duplex, rendering the spatial aspects of polar solvation uncertain.
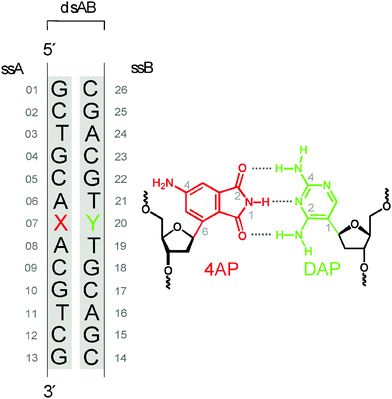
Clearly there is a need to develop surrogate nucleobases that meet requirements (i–iv) more broadly. Their development amounts to an incremental search for structures and the determination of their properties. As a candidate we proposed17 4-aminophthalimide (4AP) which has the size of natural purines. Molecular models suggest that 4AP should be an isosteric DNA base replacement in oligonucleotides if the 4AP moiety is glycosidically linked by C6 to the 2′-deoxyribofuranoside. Moreover, the phthalimide functionality should be able to form hydrogen bonds with counterparts of pyrimidine size that are placed in the opposite position as part of the complementary strand. A completely new, orthogonal, and fluorescent DNA base pair with fully matching H-bonding pattern was envisioned by combining 4AP with 2,4-diaminopyrimidine (DAP) as opposite base (Fig. 1).18,19
In this paper we study the structure and dynamics of the 4AP:DAP base pair by optical spectroscopy (including thermal melting experiments), ultrafast time-resolved fluorescence spectroscopy, quantum-chemical calculations, and – most importantly – NMR spectroscopy. The main questions that guided us through these experiments and calculations were: (i) to which extent is interbase H-bonding involved? (ii) How well does the artificial base pair fit into the sugar-phosphate backbone? (iii) Can 4AP be used as polarity probe? By answering these questions for the current design, we do not only elucidate the spectroscopic potential of this 4AP:DAP base pair for bioanalytical purposes and nucleic acid imaging, but additionally we set the stage for subsequent chemical variations in search of an optimal fluorescent base pair.
Results and discussion
The fluorescent probe
4AP is a well-known dye20 that has been applied in biopolymers21–23 but only once for oligonucleotides.24 The dye can be excited in the UV-A range (370–410 nm) and shows fluorescence in the visible range. The apparent Stokes' shift is large (up to 115 nm)25 and depends strongly on the environment, namely, the solvent polarity and the ability for H-bonding.17,26 4APs have therefore been used as solvatofluorochromic probes in cyclodextrines,27 polymers,28,29 membranes, micelles and enzyme complexes.25 With respect to nucleic acids, Hocek and coworkers24 published a synthetic protocol recently that allows to incorporate 4AP as covalent base modification in oligonucleotides through a polymerase-assisted preparation strategy. Except for this publication, we are not aware of other attempts to prepare 4AP–nucleic acid conjugates.The optical properties of the 4AP:DAP pair are studied first. For simplicity the duplex implied by Fig. 1 is denoted as ds13mer4AP–DAP. The UV/vis and fluorescence spectra of 4AP as nucleoside in aqueous solutions, in comparison with 4AP as nucleotide in single-stranded and double-stranded DNA are shown in Fig. 2. Although the chromophore is coupled to 2′-deoxyribose via C6, its absorption band around 390 nm remains unaltered while the fluorescence of the nucleoside is shifted to higher energy by 490 cm−1. The effect is consistent with the exclusion of water from the region which is occupied by the sugar moiety. Major changes are observed when the 4AP nucleoside is incorporated into single-stranded DNA (sequence shown in Fig. 1). Interactions with the flanking adenines cause a redshift of the absorption band by ∼1050 cm−1, accompanied with some narrowing and corresponding increase of the peak extinction coefficient. Also the total Stokes' shift is reduced by ∼1500 cm−1. The final step, annealing of the 4AP-modified single-strand with the DAP-modified complementary strand to ds13mer4AP–DAP, is reflected by the fluorescence band only, which shifts to the blue (or decreases the Stokes' shift) by another 430 cm−1. The fluorescence lifetime of 4AP is strongly affected by incorporation into DNA: it increases from 1.22 ns for the 4AP nucleoside in water to 10.6 ns in the duplex. In D2O the fluorescence lifetime in the duplex is enhanced to 36.4 ns (quantum yield Φ = 77% based on the radiative lifetime of 4AP in water, which is estimated by us at τrad = 47.5 ns) – a property that should be useful in solvation studies.
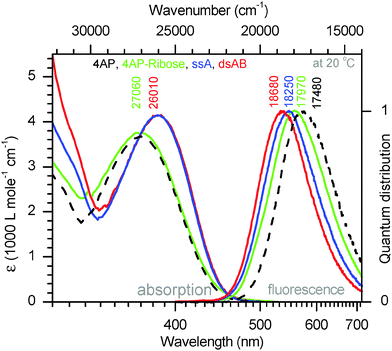 | ||
| Fig. 2 Absorption and fluorescence spectra (quantum distributions over wavenumbers) of the 4AP chromophore in aqueous buffer at pH 6.35, either free in solution (dashed black line) or linked to ribose (green), single-stranded (blue), and double-stranded DNA (red, see ESI†). | ||
A weakly acidic buffer was chosen (pH 6.35) as it extends the hydrolytic stability of the 4AP nucleoside from hours (at pH 7.5) to a few days. Annealed in double-stranded DNA, the 4AP moiety was stable and preserved for over a year. In such slightly acidic solution, the counterbase DAP exists in its protonated form which has pKa = 7.4 ± 0.1, as determined by analysis of UV absorption as a function of pH (see Fig. S1 in the ESI†). For simplicity, the base pair drawn in Fig. 1 bears the non-protonated form of DAP.
Quantum-chemical calculation of base pair structure
In order to find out what may be expected for the 4AP:DAP base pair in melting studies and NMR experiments, density-functional theory calculations of its structure were performed. The 2′-deoxyribose moieties of both nucleosides were replaced by methyl groups. The minimum-energy structure of the resulting base pair is shown in Fig. 3. The potential energy relative to the separated moieties equals that of A:T (−20 kcal mol−1![[thin space (1/6-em)]](https://www.rsc.org/images/entities/char_2009.gif) 30) when DAP is not protonated, and it is further lowered (by −4 kcal mol−1) upon protonation of DAP at N5. We find that the two
30) when DAP is not protonated, and it is further lowered (by −4 kcal mol−1) upon protonation of DAP at N5. We find that the two ![[double bond, length as m-dash]](https://www.rsc.org/images/entities/char_e001.gif) O⋯H–N distances are larger than the one in A:T (1.9 Å on average for our structure) in a nearly symmetric arrangement where the upper distance in the fig. (1.98 Å) is slightly smaller than the lower. Non-optimal hydrogen bond lengths arise from spatial constraints when the 5-membered ring of 4AP is being matched to the 6-membered ring of DAPH+. Indeed, weakening of one C
O⋯H–N distances are larger than the one in A:T (1.9 Å on average for our structure) in a nearly symmetric arrangement where the upper distance in the fig. (1.98 Å) is slightly smaller than the lower. Non-optimal hydrogen bond lengths arise from spatial constraints when the 5-membered ring of 4AP is being matched to the 6-membered ring of DAPH+. Indeed, weakening of one C![[double bond, length as m-dash]](https://www.rsc.org/images/entities/char_e001.gif) O⋯H–N bond upon its stretching enables shortening and strengthening of the other, corresponding to a variance at room temperature from +0.4 to −0.2 Å. A range of relative orientations, hinged on the central imino H-bond, can therefore be attained by the two moieties in the 4AP:DAP pair as long as they are allowed to remain in a common plane. Note that the equilibrium (unconstrained) distance between the two “glycosidic” carbon atoms, 9.05 Å, is substantially smaller than the 10.4 Å average of B-DNA.31 We will discuss the consequences later with respect to local constraints observed in the NMR structure.
O⋯H–N bond upon its stretching enables shortening and strengthening of the other, corresponding to a variance at room temperature from +0.4 to −0.2 Å. A range of relative orientations, hinged on the central imino H-bond, can therefore be attained by the two moieties in the 4AP:DAP pair as long as they are allowed to remain in a common plane. Note that the equilibrium (unconstrained) distance between the two “glycosidic” carbon atoms, 9.05 Å, is substantially smaller than the 10.4 Å average of B-DNA.31 We will discuss the consequences later with respect to local constraints observed in the NMR structure.
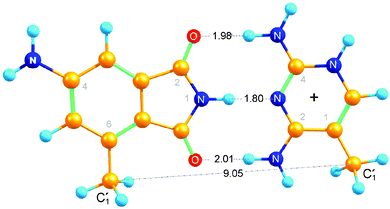 | ||
| Fig. 3 Calculated structure of 4AP hydrogen-bonded to DAPH+ (see text). The 2d-ribosides have been replaced by methyl groups for the DFT calculations. | ||
Melting behaviour of the duplex
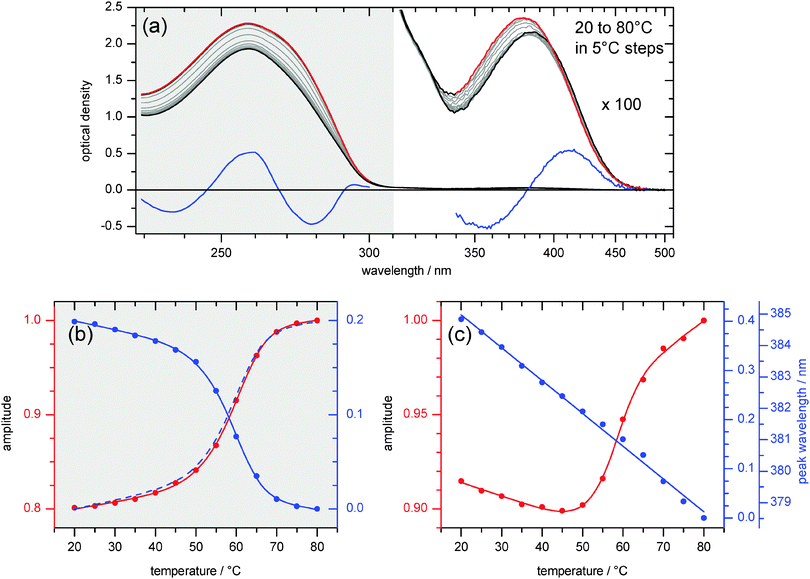
Melting studies were performed to explore the stacking interactions of the 4AP chromophore in ds13mer4AP–DAP. UV/vis absorption spectra of the duplex are shown in Fig. 4a as temperature is raised slowly up to 80 °C (red lines). In the UV range from 230 to 310 nm, the absorbance increases due to unstacking of all nucleobases and dissociation of the duplex into the single stands. The process is represented by two characteristic spectra (red and blue lines at left) together with the corresponding amplitude curves in Fig. 4b below. The latter add up to one almost quantitatively, showing that changes of peak extinction and width are aspects of the same process: global melting of the ds13mer4AP–DAP duplex. The absorption peak position is unaffected.The artificial nucleobase 4AP adds a very weak band in the range 350–500 nm to the UV absorption (right part of Fig. 4a). In comparison to the melting observed at 230 to 310 nm as described above, the 4AP-specific band behaves differently with increasing temperature. Here again, the first characteristic spectrum is taken to be the one at 80 °C (red line at right). The second characteristic spectrum turns out to be the derivative (blue). Together with the corresponding amplitude curve in Fig. 4c it describes a near-linear shift of the band to higher energy as temperature is raised. The main observation for this 4AP-specific melting experiments is provided by the amplitude curve that governs the absorption strength (red dots and line in Fig. 4c). It is important to note that the strength at first drops when the temperature is raised from 20 to 45 °C. Remarkably, the initial hypochromism indicates better stacking interaction with the flanking nucleobases upon heating, contrary to what is typically seen with natural nucleobases. This non-monotonous behaviour of the 4AP absorption peak is also directly visible in Fig. 4a and is further explained in structural terms (vide infra). Only above 45 °C does the peak extinction turn around and increases with conventional sigmoidal shape upon further heating, which can be interpreted as local melting around the 4AP chromophore. Melting temperatures for ds13mer4AP–DAP were determined to be TM = 59.5 °C for global melting observed at 230 to 310 nm and 56.5 °C for local melting observed at 350 to 500 nm (see Fig. S2, ESI†).
NMR solution structure
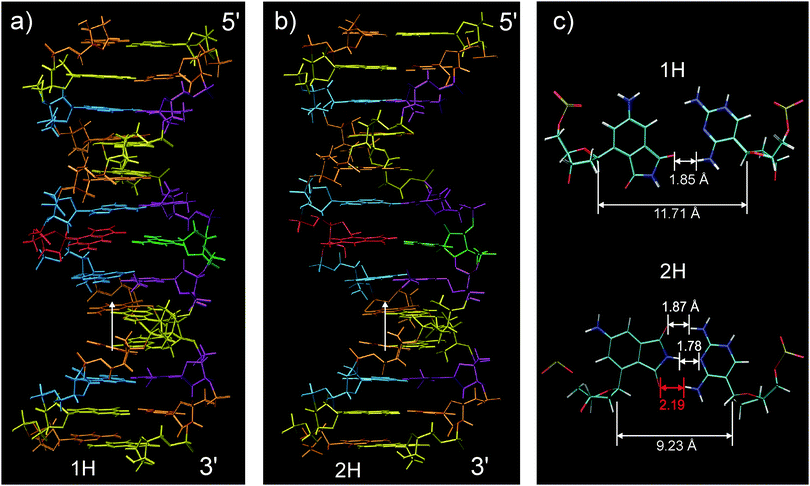
The structure of ds13mer4AP–DAP was determined by methods of NMR spectroscopy and is discussed in the context of results from the measurements described above. Even without knowing the structure it is possible to analyse the hydrogen bonding pattern simply by the imino proton signals. These are usually observed at 12 ppm or higher when the proton is part of a hydrogen bond in DNA double strands, otherwise they are shifted high-field to around 10 ppm.32 With ds13mer4AP–DAP a weak signal is observed in the latter region, implying that for one base pair a fraction (or all) of the population is not imino-hydrogen bonded. As the only new imino proton in our well-known sequence belongs to 4AP, we conclude that the 4AP:DAP pair may partly lack the central hydrogen bond. If this is the case, the other possible hydrogen bonds are highly questionable, too.The assignment of the NOESY spectra followed standard methods,32 but became more complex for base pairs in the vicinity of 4AP:DAP. For example, two sets of imino proton signals were found that can only be assigned to the central A:T base pairs, indicating that two forms of ds13mer4AP–DAP conformations coexist. Altogether, six H2/H3 cross peaks between adenine and thymine were observed instead of the expected four (Fig. S3, ESI†). Their imino region indicates correct hydrogen bonding patterns of these base pairs in both cases. For each form, ensembles of 100 structures were calculated and the averaged structures were built from the 10 violation-free structures with minimum energy; results are shown in Fig. 5. The assignment of NOE signals and simulated annealing calculations are described in the ESI.† Interestingly, none of the configurations in Fig. 5 comprises the near-symmetric arrangement around the central N–H⋯N bond which was predicted by calculations for the unconstrained system (as described above, Fig. 3).
The two observed forms are named 1H and 2H according to the number of hydrogen bonds in the 4AP–DAP pair. Both have the straight well-defined B-DNA structure but the 2H form is, although not clearly visible, wider in the centre. Stacking interactions to the adjacent base pairs also differ between conformations, as a consequence of different skewing angles. In 1H, the 4AP and DAP base analogues can only stack with the next nucleobase in 3′-direction (Fig. S4, ESI†) while in 2H stacking is possible in both directions. Distances between native basepairs in ds13mer4AP–DAP are in the range for chemically unperturbed duplexes (see Table S1, ESI†).
A view of the central base pair is provided in Fig. 5c. In the 1H form (upper part) the artificial nucleobases 4AP and DAP are connected through a single hydrogen bond that faces to the minor groove. The 2H form is shown in the lower part. Although at first glance the bases in 2H seem to be in the right position for symmetrical hydrogen bonding, distances clearly indicate that only two bonds are in range. We conclude that backbone constraints pull open the C1′–C1′ distance of the relaxed arrangement (Fig. 3). Since this pair remains hinged at the center, the 2H form is created. The corresponding reorganisation energy was estimated to be 1 kcal mol−1 from our quantum-chemical calculations. The different placements of 4AP in the two forms are driven by the conformations of 2′-deoxyribose, more exactly by switching between the 2′-endo conformation for 1H and 3′-endo for 2H. The latter conformation is typical for A-type DNA (or RNA), consistent with the wider centre. A closer look reveals that the sugar conformation of the DAP nucleotide in the duplex has adapted an intermediate state between C2′-exo and C3′-endo conformations.
With this knowledge from NMR structures, the negative entropy of local melting (Fig. 4c) can be explained. At room temperature the 1H ↔ 2H equilibrium is tilted towards the left by skeletal constraints from the connecting 2′-deoxyribose, as indicated by the theoretical calculations (see above), together with partial solvation of the 4AP chromophore outside the DNA helix. In this case the chromophore can stack only with one of the neighbouring nucleobases, resulting in moderate hypochromism. With increasing temperature some skeletal constraints are relaxed, enabling the formation of the second H-bond and improved stacking, and thus the hypochromism increases (i.e. the optical density drops). One consequence of this scenario is that 4AP in the 1H form donates and accepts hydrogen bonds from water. Solvation dynamics of 4AP as embedded polarity probe should therefore be different from that of Coumarin102 which does not offer specific solvation sites. This hypothesis will be tested next by THz polar solvation dynamics.
THz polar solvation dynamics
Time-resolved fluorescence spectra are shown in Fig. 6a. Fast (40 fs) optical excitation of the 4AP probe causes a sudden increase of the molecular dipole moment at the centre of the duplex. As polar groups respond and surrounding water molecules reorient, the excited state is gradually stabilized, and the process is reflected in a time-dependent Stokes' shift (TDSS) of the fluorescence band. To analyse the TDSS, all spectra like the ones in the figure are fitted by a lognormal function.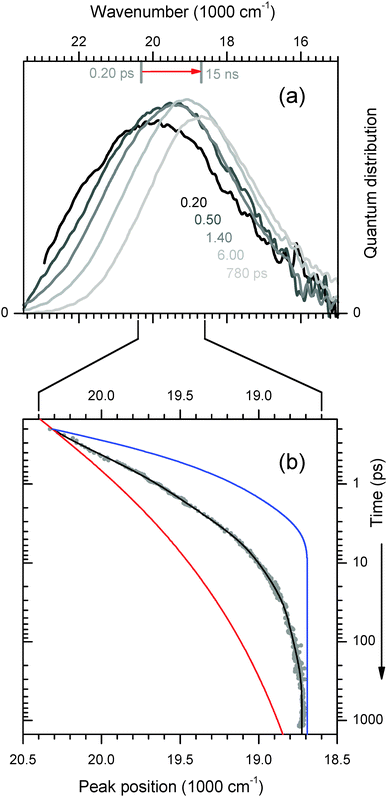 | ||
| Fig. 6 (a) Transient 4AP fluorescence spectra from the duplex in H2O buffer, measured by broadband upconversion with 100 fs time resolution. (b) The time-dependent peak wavenumber reflects the polar relaxation processes of the 4AP nucleobase in the duplex (dots and fitted line). Curves for 4AP-riboside free in water33 (blue) and C102 in duplex DNA9 (red) are also shown. For comparison of the dynamics they were scaled so that values at 0.2 ps and 15 ns coincide with the fitted curve. | ||
The motion of the peak frequency νfls is shown in Fig. 6b. As reference, the TDSS of an embedded coumarin nucleobase (C102)9 is also shown (red line). In this case the dynamics was reported to be essentially non-exponential for over 4 decades of time, and it could be cast into a simple power law. For the figure the curve has been scaled so that νfls(t = 0.2 ps) and νfls(t = 15 ns) coincide with our 4AP data. As the other extreme reference, we show the shift dynamics of 4AP nucleoside which was freely dissolved in buffer33 (blue line). Now the chromophore is almost entirely surrounded by water, whose fast reorientational dynamics is reflected in the TDSS.
The relaxation dynamics of ds13mer4AP–DAP (grey dots with fitted line) is qualitatively different from both reference curves. To understand this observation, it is important to keep in mind that a mixture of 2H- and 1H-forms is excited. Both forms are excited with equal probability, as can be inferred from Fig. 2. At any time t later the instantaneous fluorescence spectrum is therefore the sum of two contributions, which may have red-shifted by different amounts. Simulations for a mixture of the two reference cases show (i) that the peak frequency curve νfls(t) depends sensitively on the composition, and (ii) that the width of the fluorescence band should contract during the relaxation. This prediction is borne out by the width parameter Δ(t), Fig. 7. At early times the width is larger and contracts faster than for a homogeneous solution of the 4AP nucleoside in water (unpublished results of the work described in ref. 33). The effect can be seen directly from the transient spectra in Fig. 6a, where the high- and low-energy halfpoints move to the red with different speeds. We conclude that the observed spectral evolution on the femto- to picosecond time scale is consistent with that of a mixture of a slow and fast species, which are probably the stacked 2H- and solvated 1H-form, respectively.34
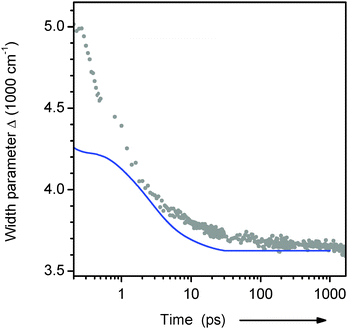 | ||
| Fig. 7 Width of the transient 4AP fluorescence spectra from the duplex in H2O buffer (dots, from lognormal fits to spectra as in Fig. 6a). The blue line shows the behaviour for the 4AP-riboside free in aqueous buffer (see text). | ||
Conclusions
The hydrogen-bonded and fluorescent base pair formed by 4-aminophthalimide (4AP) and 2,4-diaminopyrimidine (DAP) has been studied in double-helix DNA as an isosteric replacement for a natural base pair. The fluorophore 4AP is distinguished from many others by strong solvatochromism that is also observed when linked and embedded in DNA. In duplex DNA it is chemically stable at ∼pH 6.4 and has high fluorescence quantum yield and a long excited-state lifetime (77%, 36.4 ns) in D2O solution.Structural investigations by NMR spectroscopy revealed two conformations with differences in hydrogen-bonding between 4AP and protonated DAP. The fully stacked conformation has two interbase hydrogen bonds: the central N–H⋯N and a single C![[double bond, length as m-dash]](https://www.rsc.org/images/entities/char_e001.gif) O⋯H–N bond. Its fraction in the double-stranded DNA sample is increased when temperature is raised from ambient to 40–50 °C (just below the melting temperature) and backbone constraints are relaxed. Accordingly, local melting reveals negative entropy till this temperature. Another important aspect is the 3′-endo sugar conformation which was found for the stacked conformation of the 4AP:DAP base pair. This sugar pucker is typical for duplex RNA, suggesting that 4AP:DAP might be a useful base pair for fluorescent imaging of RNA delivery and/or processing in living cells.
O⋯H–N bond. Its fraction in the double-stranded DNA sample is increased when temperature is raised from ambient to 40–50 °C (just below the melting temperature) and backbone constraints are relaxed. Accordingly, local melting reveals negative entropy till this temperature. Another important aspect is the 3′-endo sugar conformation which was found for the stacked conformation of the 4AP:DAP base pair. This sugar pucker is typical for duplex RNA, suggesting that 4AP:DAP might be a useful base pair for fluorescent imaging of RNA delivery and/or processing in living cells.
The detected fully stacked 2H conformation of the 4AP:DAP base pair appears to reflect DNA solvation dynamics faithfully, but for such use the corresponding fraction in the DNA sample must be increased, i.e. the geometry of linkage between 4AP and the 2′-deoxyriboside must be optimized. For example if 4AP were connected to 2′-deoxyribose at C5 (instead of C6 as in the current work), the unconstrained C1′–C1′ distance should be 11.4 Å according to calculations. As the backbone pulls this together, the base pair will be pushed towards the minor groove and should become fully stacked with two interbase H-bonds.
Our current work focuses on the preparation of triphosphates of both aminophthalimide and 2,4-diaminopyridimine nucleosides, and on their application in primer extension experiments and PCR. This should allow for easy placement of the probe near recognition sites. Future chemical-biological work will include the real-time monitoring of DNA polymerase action by the solvatochromism of the aminophtalimide.
Experimental section
Syntheses
C-nucleosides of 4AP and DAP (Fig. 1) were synthesized by stereoselective Heck-type palladium-catalysed cross-coupling with 2′-deoxyribofuranoside glycol, followed by stereoselective reduction with NaBH(OAc)3.19 The corresponding phosphoramidites were incorporated into DNA strands via automated synthesis, and single strands were purified by HPLC. After hybridization to ds13mer4AP–DAP the reaction mixture was subjected to size exclusion chromatography (Sephadex PD-10) followed by lyophilization. To avoid decomposition of the 4AP chromophore, the double strand was taken up in a weakly acidic buffer (10 mM Na2HPO4/NaH2PO4, pH 6.35) with 150 mM sodium chloride. The procedure for hybridisation is detailed in the ESI.†Quantum-chemical calculations
Quantum chemical calculations were performed with the Gaussian09 software35 at the DFT level of theory. We used the M06-2X exchange–correlation functional of the hybrid-mGGA class, Def2-TZVPP basis set for carbon and hydrogen atoms, and the augmented Def2-TZVPPD set for electronegative oxygen and nitrogen atoms.NMR experiments
NMR spectra were acquired on a 600 MHz Bruker Avance spectrometer with inverse probe-head. Measurements were carried out at 25 °C in D2O (unless otherwise noted) at 1 mM duplex concentration. For assignment purposes, COSY and TOCSY spectra were recorded with 2048 × 512 data points. For structure determination, NOESY and HMQC spectra were measured. The NOESY spectra in H2O (10, 25, 40 °C) and D2O (10 °C) were acquired with 4096 (F2) × 1024 (F1) data points and 100 ms mixing time. The residual HOD signal was removed by low-power presaturation in D2O and by a WATERGATE pulse sequence in H2O. The decoupled HMQC spectrum was measured with 2048 × 256 data points and the d2 delay was optimal for 1J(CH) = 145 Hz. The coupled HMQC spectra with and without addition of 20 mg mL−1 Pf1 phage were sampled with 8192 × 512 data points and d2 delay corresponding to aromatic coupling constants 1J(CH) = 200 Hz. All data were processed with the Bruker TOPSPIN program and standard methods.NMR structure calculations
The solution structure was determined from NOE and RDC data by simulated annealing calculations with XPLOR-NIH36 (additional information in the ESI†). The experimental data were supplemented with standard hydrogen bond distance restraints from crystal structures. The existence of hydrogen bonds was confirmed by chemical shift data of involved protons. Additional loose (±50°) dihedral restraints confine the conformational space to B-DNA. With dihedral restraints for A-DNA the measured data could not be calculated, and the H1‘-H2‘/H2” signals also suggest pure B-DNA conformation for both double strands. The modified residues (4AP, DAP) were subjected to experimental restraints only, i.e. all supplementary constraints were omitted for these residues. Parameters for the modified residues were taken from DFT calculations performed with Gaussian0935 utilizing B3LYP and TZVP as basis set. Partial atomic charges were derived from the molecular electrostatic potential with the CHelpG algorithm.Stationary optical absorption and fluorescence
UV/vis absorption spectra over the range 230–500 nm were recorded with a Varian Cary 300 spectrometer. Measurements were performed in a double cuvette (closed but not evacuated) having sections of 1 and 10 mm optical path length. An equivalent cuvette with pure solvent was used for reference. In melting experiments, after each rising temperature step of 5 °C the sample and holder were allowed to equilibrate for 10 minutes. A total concentration cT = 20.5 μM of single strands was estimated. Spectra between 20 and 80 °C were recorded and corrected for density change. Fluorescence spectra at 25 °C were obtained on a Spex Fluorolog-2, by photometric comparison with a secondary standard lamp. Wavelength axes were calibrated with a holmium glass filter or a Hg lamp.Transient fluorescence experiments
The duplex solution from the melting-point studies was desalted by size exclusion in a GE Healthcare PD-10 column. The lyophilate was taken up in ca. 80 μL buffer and transferred into a cuvette with inside dimensions 12 × 12 × 0.4 mm3, between fused-silica windows 0.3 mm thick. OD(0.4)403 ≈ 0.5 was achieved.Excitation at 403 nm was performed with 40 fs, 0.2 μJ pulses at 1 kHz repetition rate, focussed to a spot diameter of ≈150 μm. The cell was oscillated orthogonal to the optical axis in both directions to replenish the sample. Fluorescence was imaged onto a BBO crystal where it was mixed with time-delayed gate pulses at 1320 nm (60 μJ). With a tilted pulse front and large angle between the incident beams, type II sum-frequency generation is possible simultaneously for 420–750 nm fluorescence.37,38 The time resolution was 200 fs fwhm with a crystal 0.5 mm thick (and <100 fs with 0.1 mm). Upconverted spectra were registered on a CCD camera and compared to those of standard dyes for photometric correction.
The nanosecond evolution was followed with an Edinburgh Instruments FLS980 by time-correlated single photon counting. Fluorescence decay was measured at 16 wavelengths which were optimally distributed over the dsAB emission band. The duplex was dissolved in D2O buffer in order to have the longest possible observation time.
Acknowledgements
We are grateful to Jutta Pauli, Bundesanstalt für Materialforschung und Prüfung, who measured the TCSPC traces. This work was supported by the Deutsche Forschungsgemeinschaft (Grant Er 154/9-3 to NPE and Wa 1386/17-1 to HAW) and by KIT.Notes and references
- R. W. Sinkeldam, N. J. Greco and Y. Tor, Chem. Rev., 2010, 110, 2579–2619 CrossRef CAS PubMed.
- D. C. Ward, E. Reich and L. Stryer, J. Biol. Chem., 1969, 244, 1228–1237 CAS.
- V. V. Filichev, E. B. Pedersen and T. P. Begley, Wiley Encyclopedia of Chemical Biology, John Wiley & Sons, Inc., 2007 DOI:10.1002/9780470048672.wecb654.
- M. Sholokh, R. Sharma, D. Shin, R. Das, O. A. Zaporozhets, Y. Tor and Y. Mély, J. Am. Chem. Soc., 2015, 137, 3185–3188 CrossRef CAS PubMed.
- G. Mata and N. W. Luedtke, J. Am. Chem. Soc., 2015, 137, 699–707 CrossRef CAS PubMed.
- M. J. Rist and J. P. Marino, Curr. Org. Chem., 2002, 6, 775–793 CrossRef CAS.
- S. K. Pal, L. Zhao, T. Xia and A. H. Zewail, Proc. Natl. Acad. Sci. U. S. A., 2003, 100, 13746–13751 CrossRef CAS PubMed.
- D. Andreatta, J. L. P. Lustres, S. A. Kovalenko, N. P. Ernsting, C. J. Murphy, R. S. Coleman and M. A. Berg, J. Am. Chem. Soc., 2005, 127, 7270–7271 CrossRef CAS PubMed.
- D. Andreatta, S. Sen, J. L. Pérez Lustres, S. A. Kovalenko, N. P. Ernsting, C. J. Murphy, R. S. Coleman and M. A. Berg, J. Am. Chem. Soc., 2006, 128, 6885–6892 CrossRef CAS PubMed.
- S. Sen, D. Andreatta, S. Y. Ponomarev, D. L. Beveridge and M. A. Berg, J. Am. Chem. Soc., 2009, 131, 1724–1735 CrossRef CAS PubMed.
- K. E. Furse and S. A. Corcelli, J. Am. Chem. Soc., 2008, 130, 13103–13109 CrossRef CAS PubMed.
- M. Sajadi, K. E. Furse, X. X. Zhang, L. Dehmel, S. A. Kovalenko, S. A. Corcelli and N. P. Ernsting, Angew. Chem., Int. Ed., 2011, 50, 9501–9505 CrossRef CAS PubMed.
- A. Dallmann, M. Pfaffe, C. Mugge, R. Mahrwald, S. A. Kovalenko and N. P. Ernsting, J. Phys. Chem. B, 2009, 113, 15619–15628 CrossRef CAS PubMed.
- N. Pal, S. D. Verma and S. Sen, J. Am. Chem. Soc., 2010, 132, 9277–9279 CrossRef CAS PubMed.
- S. D. Verma, N. Pal, M. K. Singh and S. Sen, J. Phys. Chem. B, 2015, 119, 11019–11029 CrossRef CAS PubMed.
- A. Dallmann, L. Dehmel, T. Peters, C. Mügge, C. Griesinger, J. Tuma and N. P. Ernsting, Angew. Chem., Int. Ed., 2010, 49, 5989–5992 CrossRef CAS PubMed.
- M. Sajadi, T. Obernhuber, S. A. Kovalenko, M. Mosquera, B. Dick and N. P. Ernsting, J. Phys. Chem. A, 2009, 113, 44–55 CrossRef CAS PubMed.
- H.-J. Kim, M. J. Kim, N. Karalkar, D. Hutter and S. A. Benner, Nucleosides, Nucleotides Nucleic Acids, 2008, 27, 43–56 CAS.
- M. Weinberger, F. Berndt, R. Mahrwald, N. P. Ernsting and H.-A. Wagenknecht, J. Org. Chem., 2013, 78, 2589–2599 CrossRef CAS PubMed.
- C. Reichardt, Chem. Rev., 1994, 94, 2319–2358 CrossRef CAS.
- T. Soujanya, R. W. Fessenden and A. Samanta, J. Phys. Chem., 1996, 100, 3507–3512 CrossRef CAS.
- D. Mandal, S. Sen, D. Sukul, K. Bhattacharrya, A. K. Mandal, R. Banerjee and S. Roy, J. Phys. Chem. B, 2002, 106, 10741–10747 CrossRef CAS.
- M. E. Vazquez, D. M. Rothman and B. Imperiali, Org. Biomol. Chem., 2004, 2, 1965–1966 CAS.
- J. Riedl, R. Pohl, N. P. Ernsting, P. Orsag, M. Fojta and M. Hocek, Chem. Sci., 2012, 3, 2797–2806 RSC.
- G. Saroja, T. Soujanya, B. Ramachandram and A. Samanta, J. Fluoresc., 1998, 8, 405–410 CrossRef CAS.
- E. Krystkowiak, K. Dobek and A. Maciejewski, J. Photochem. Photobiol., A, 2006, 184, 250–264 CrossRef CAS.
- T. Soujanya, T. S. R. Krishna and A. Samanta, J. Phys. Chem., 1992, 96, 8544–8548 CrossRef CAS.
- B. C. Barja, C. Chesta, T. D. Z. Atvars and P. F. Aramendia, J. Phys. Chem. B, 2005, 109, 16180–16187 CrossRef CAS PubMed.
- L. u. Bucsiova and P. Hrdlovic, J. Macromol. Sci., Pure Appl. Chem., 2007, 44, 1047–1053 CrossRef CAS.
- H. Szatylowicz and N. Sadlej-Sosnowska, J. Chem. Inf. Model., 2010, 50, 2151–2161 CrossRef CAS PubMed.
- S. Neidle, in Principles of Nucleic Acid Structure, ed. S. Neidle, Academic Press, New York, 2008, pp. 81–131 Search PubMed.
- G. C. K. Roberts, NMR of Macromolecules: A Practical Approach, Oxford University Press Inc., New York, 1993 Search PubMed.
- M. Sajadi, M. Weinberger, H.-A. Wagenknecht and N. P. Ernsting, Phys. Chem. Chem. Phys., 2011, 13, 17768–17774 RSC.
- Other sources may be responsible for the observed shift dynamics, for example vibrational energy redistribution and -transfer involving H-bonds. This possibility will be examined when unique positioning of the fluorophore is achieved.
- M. J. Frisch, et al., Gaussian 09 Rev. A.02, 2009 Search PubMed.
- C. D. Schwieters, J. J. Kuszewski, N. Tjandra and G. M. Clore, J. Magn. Reson., 2003, 160, 65–73 CrossRef CAS PubMed.
- X.-X. Zhang, C. Würth, L. Zhao, U. Resch-Genger, N. P. Ernsting and M. Sajadi, Rev. Sci. Instrum., 2011, 82, 063108 CrossRef PubMed.
- M. Sajadi, M. Quick and N. P. Ernsting, Appl. Phys. Lett., 2013, 103, 173514 CrossRef.
Footnotes |
| † Electronic supplementary information (ESI) available. See DOI: 10.1039/c5cp06972f |
| ‡ Who contributed equally. |
| This journal is © the Owner Societies 2016 |

