 Open Access Article
Creative Commons Attribution 3.0 Unported Licence
The electrooxidation-induced structural changes of gold di-superatomic molecules: Au23vs. Au25†
Shota
Matsuo
a,
Seiji
Yamazoe
ab,
Jing-Qiang
Goh
cd,
Jaakko
Akola
cd and
Tatsuya
Tsukuda
*ab
aDepartment of Chemistry, School of Science, The University of Tokyo, 7-3-1 Hongo, Bunkyo-ku, Tokyo 113-0033, Japan. E-mail: tsukuda@chem.s.u-tokyo.ac.jp
bElements Strategy Initiative for Catalysts and Batteries (ESICB), Kyoto University, Katsura, Kyoto 615-8520, Japan
cDepartment of Physics, Tampere University of Technology, P.O. Box 692, FI-33101 Tampere, Finland
dCOMP Centre of Excellence, Department of Applied Physics, Aalto University, FI-00076 Aalto, Finland
First published on 15th January 2016
Abstract
The gold cluster compounds Au38(SC2H4Ph)24 and [Au25(PPh3)10(SC2H4Ph)5Cl2]2+ are known to possess bi-icosahedral Au23 and Au25 cores, respectively, inside their ligand shells. These Au cores can be viewed as quasi-molecules composed of two Au13 superatoms sharing three and one Au+ atoms, respectively. In the present work, we studied the structural changes of these gold di-superatomic molecules upon electrooxidation via spectroelectrochemical techniques, X-ray absorption fine structure analysis, and density functional theory calculations. The Au23 core was electrochemically stable, but the Au25 core underwent irreversible structural change. This marked difference in the stability of the oxidized states is ascribed to differences in the bonding scheme of Au13 units and/or the bonding nature of the protecting ligands.
Introduction
The Au13 icosahedron is a ubiquitous structural motif that can be found in a variety of ligand-protected gold clusters, such as [Au13(PMe2Ph)10Cl2]3+,1 [Au25(SC2H4Ph)18]−,2,3 [Au13(PPh2C2H4PPh2)5Cl2]3+,4 [Au19(C![[triple bond, length as m-dash]](https://www.rsc.org/images/entities/char_e002.gif) CPh)9(PPh2NHPPh2)3]2+,5 and [Au13(PPh2C2H4PPh2)5(C
CPh)9(PPh2NHPPh2)3]2+,5 and [Au13(PPh2C2H4PPh2)5(C![[triple bond, length as m-dash]](https://www.rsc.org/images/entities/char_e002.gif) CPh)2]3+.6 All of these Au13 cores formally accommodate eight valence electrons with a closed (1S)2(1P)6 electronic configuration, where S and P represent orbitals with angular momentum values of 0 and 1, respectively (Scheme 1).7,8 Thus, the Au135+(8e) core can be viewed as a stable, rare gas-like superatom.8
CPh)2]3+.6 All of these Au13 cores formally accommodate eight valence electrons with a closed (1S)2(1P)6 electronic configuration, where S and P represent orbitals with angular momentum values of 0 and 1, respectively (Scheme 1).7,8 Thus, the Au135+(8e) core can be viewed as a stable, rare gas-like superatom.8
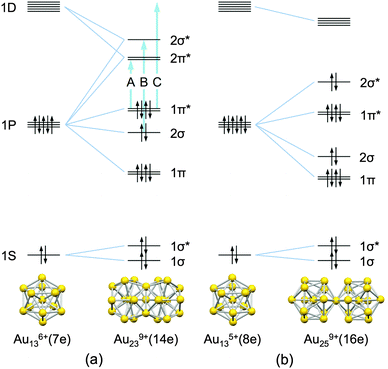 | ||
| Scheme 1 Schematic representation of the bonding scheme for (a) Au239+(14e) and (b) Au259+(16e) from their superatomic units (ref. 18 and 19). The energy scales are arbitrary and the energy splitting of superatomic orbitals (ref. 20 and 21) is ignored. Optical transitions A, B, and C correspond to the peaks in the optical spectrum (Fig. 1a). | ||
The Au13 core serves as the building unit for a new class of quasi-molecules known as superatomic molecules9,10 in a manner analogous to the formation of molecules from atoms. To date, two different bonding modes have been revealed by single-crystal X-ray crystallographic studies. One is a face-sharing mode found in the Au239+(14e) core of Au38(SR)24.11 The other is a vertex-sharing mode found in the Au259+(16e), Au3713+(24e), and Au6020+(40e) cores of [Au25(PR3)10(SR′)5Cl2]2+,12 [Au37(PR3)10(SR′)10Cl2]+,13 and [Au60Se2(PR3)10(SeR′)15]+,14 respectively. A recent computational study suggests that the Au239+ core can be viewed as a dimer of halogen-like Au136+(7e) superatoms formed by sharing three Au+ atoms (Scheme 1a):9
| Au239+(14e) = 2 × Au136+(7e) − 3Au+ | (1) |
| Au259+(16e) = 2 × Au135+(8e) − Au+. | (2) |
In terms of the bonding scheme, the Au239+(14e) and Au259+(16e) cores correspond to an F2 molecule and a van der Waals dimer of Ne, respectively. These di-superatomic molecules, thus, provide an interesting opportunity to study similarities and differences of the fundamental properties between conventional molecules and superatomic molecules. This study aims to compare the structural changes of superatomic molecules induced by electrooxidation with those of conventional molecules by ionization. In the case of molecules, the bond distance is the unique structure parameter that can be changed. For example, the F–F bond of F2 is shortened from 1.44 to 1.33 Å upon ionization owing to the removal of an electron from the highest occupied molecular orbital (HOMO) of anti-bonding nature.22 The internuclear distance of Ne2 is significantly reduced from 3.09 to 1.7 Å upon ionization owing to the charge-resonance stabilization in Ne2+.23 In the case of superatomic molecules, the structural change of superatomic units themselves may be induced in addition to the elongation/reduction of their distance. In the present study, we investigated how the geometric structures of the Au239+ and Au259+ cores are altered upon electrooxidation using spectroelectrochemical methods,24 X-ray absorption fine structure (XAFS) analysis and density functional theory (DFT) calculations.
Experimental and computational methods
Synthesis of samples
All of the chemicals used in this study were commercially available. Samples of Au38(SC2H4Ph)24 (10) and [Au25(PPh3)10(SC2H4Ph)5Cl2]2+ (22+) were synthesized according to literature procedures, but with slight modifications.12,25,26 The details of the syntheses are described in the ESI.† Successful synthesis of both compounds was confirmed by matrix-assisted laser desorption ionization (MALDI) mass spectrometry and optical absorption spectroscopy.Electrochemical measurements
Cyclic voltammetry (CV) and differential pulse voltammetry (DPV) of 1 and 2 were performed using an electrochemical analyzer (BAS, ALS720B) at room temperature under an Ar atmosphere. The electrolyte solution used for these measurements was 0.1 M tetrabutylammonium hexafluorophosphate (NBu4PF6) in 1,2-dichloroethane (DCE) purged with Ar. The working, reference, and counter electrodes were a 1 mm glassy carbon disk, Ag/AgNO3 (−0.21 V vs. Fc/Fc+), and a Pt wire, respectively. The potential scan was initiated at open circuit potential (0.01 and −0.27 V for 1 and 2, respectively) in the negative direction.The optical absorption spectra of 1 and 2 in the UV-vis-NIR region were recorded under electrochemical redox conditions. These spectroelectrochemical measurements were conducted in a DCE solution containing 0.1 M NBu4PF6 that was purged with Ar prior to measurements using an electrochemical analyzer (BAS, ALS720B) and two spectrophotometers (Jasco, V-670 for 1 and Agilent, Agilent 8453 for 2). A quartz cell (1 mm width) was used for spectroelectrochemistry. The working, reference, and counter electrodes were an optically transparent Pt mesh electrode, an Ag/AgNO3 electrode, and a Pt wire electrode, respectively. The Pt mesh electrode was set in the light path of the spectroelectrochemical cell.
Bulk electrolysis
The bulk electrolysis of 2 was carried out in a spectroelectrochemical 10 mm quartz cell (HX-701Y, Hokuto Denko) with an electrochemical analyzer (BAS, ALS720B). The working, reference, and counter electrodes were a Pt mesh electrode, an Ag/AgNO3 electrode, and a Pt coil electrode, respectively. The electrolysis was conducted in a DCE solution containing 0.1 M NBu4PF6, which was purged with Ar prior to measurements. The completion of the bulk electrolysis was established by optical absorption spectroscopy.XAFS spectroscopy
Au L3-edge XAFS measurements were performed on the BL01B1 beamline at the SPring-8 facility of the Japan Synchrotron Radiation Institute (proposal nos. 2012B1986, 2014B1430, and 2014A1680). A Si(311) two-crystal monochromator was used for the incident beam and all spectra were recorded in transmission mode using ion chambers as the I0 and I detectors. Samples of 2 diluted with boron nitride and 2 electrolyzed and diluted with NBu4PF6 were placed in the cryostat for measurements at 8 or 10 K. Energy scale was calibrated using Cu foil and data analysis was carried out employing the REX2000 Ver. 2.5.92 software package (Rigaku Co.). The k3-weighted χ spectra in the k range of 3.0–16.0 Å−1 were Fourier-transformed (FT) into r-space. The curve fitting analysis was performed for Au–S (P, Cl) and Au–Au bonds over the r range of 1.5–3.2 Å. In the curve fitting analysis, the phase shifts and back-scattering amplitude functions for the Au–S and Au–Au bonds were extracted from Au2S (ICSD#78718) and Au metal (ICSD#44362), respectively, using the FEFF8 program.27 The phase shifts and back-scattering amplitude functions of Au–S were used for those of Au–P and Au–Cl because the electron densities of P and Cl atoms are close to that of S atom.Transmission electron microscopy
Transmission electron microscopy (TEM) images were recorded by using a Hitachi HF-2000 microscope operated at 200 kV. A dispersion of the electrooxidized sample of 2 was dropped onto a carbon-coated copper grid. The sample grid was dried at room temperature in air.Computational methods
The GPAW software,28 a projector-augmented wave (PAW) and real-space grid DFT package, was employed to inspect the redox behavior of 1 and 2. Structural optimizations were performed in the gas phase environment with consideration of the full ligands, until the residual forces acting on the atoms reached 0.05 eV Å−1 or below. The spin-polarized DFT simulations were performed with a real-space grid spacing of 0.2 Å and included the scalar relativistic effect for PAW setups. Linear response time-dependent DFT based on Casida's formulation29 was employed to analyze the optical absorption spectra of 22+ and 23+. All the calculations in this work adopted the generalized gradient-corrected exchange–correlation functional developed by Perdew, Burke and Ernzerhof (PBE).30Results and discussion
Redox behavior of Au38(SC2H4Ph)24
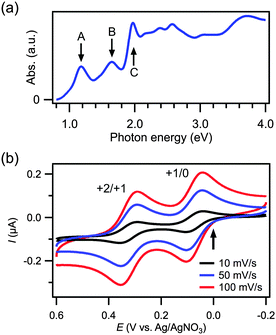
The successful synthesis of Au38(SC2H4Ph)24 (10) was confirmed by MALDI mass spectrometry (Fig. S1, ESI†). An intense peak at m/z = 1.078 × 10⁴ was assigned to intact Au38(SC2H4Ph)24, whereas a smaller peak at m/z = 9.33 × 10³ was attributed to a fragment with the formula Au34(SC2H4Ph)19S.25 The optical absorption spectrum of 10 (Fig. 1a) shows distinct peaks at 1.18 (peak A), 1.65 (peak B), 1.97 (peak C), 2.39, and 2.57 eV, in agreement with previously reported data.31 The peaks A, B and C have been theoretically assigned to the electronic transitions HOMO(1π*) → LUMO(2π*), HOMO−1(2σ) → LUMO+1(2σ*), and HOMO(1π*) → LUMO+3, respectively (Scheme 1a).18
Fig. 1b shows the CV curves of 10 recorded at different scan rates; an arrow indicates the open circuit potential. These plots exhibit two pairs of redox peaks for the 0/+1 and +1/+2 couples at the same voltages, regardless of the scan rates. The peak-to-peak separations of the two couples are 58 and 61 mV, respectively, at a scan rate of 100 mV s−1.32 This reversible behavior indicates that 1 and its oxidized forms 11+ and 12+ are stable in the electrolyte solution. The formal potentials of the redox couples 10/1+ and 11+/2+ were determined to be 0.07 and 0.32 V, respectively. These values are smaller by several tens of meV than reported values obtained from CV using acetonitrile![[thin space (1/6-em)]](https://www.rsc.org/images/entities/char_2009.gif) :
:![[thin space (1/6-em)]](https://www.rsc.org/images/entities/char_2009.gif) benzene (1
benzene (1![[thin space (1/6-em)]](https://www.rsc.org/images/entities/char_2009.gif) :
:![[thin space (1/6-em)]](https://www.rsc.org/images/entities/char_2009.gif) 1) as a solvent of the electrolyte solution.33 Based on these results, it is evident that 11+ and 12+ can be synthesized by the electrolysis of 10 at 0.20 and 0.60 V, respectively.
1) as a solvent of the electrolyte solution.33 Based on these results, it is evident that 11+ and 12+ can be synthesized by the electrolysis of 10 at 0.20 and 0.60 V, respectively.
The optical absorption spectra of 10, 11+, and 12+ are displayed in Fig. 2a. The positions of peaks A, B, and C of 10 (Fig. 1a) are unchanged following electrolysis whereas the intensities of these peaks change depending on the charge states of 1. The intensities of peaks A and C decreased with oxidation. The reduction of the peak intensities upon oxidation to +1 and +2 is ascribed to the reduced probability of transition from the HOMO(1π*) orbital from which the electron(s) is/are removed. In contrast, the intensity of peak B did not change upon oxidation. This behavior can be understood by considering that the HOMO(1π*) orbital is not involved in the optical transition. Interestingly, the absorbance of the valley between peaks B and C increased upon oxidation, suggesting that a new optical transition became accessible in the oxidized state. According to a previously reported theoretical study,18 the increased absorbance at 1.8 eV can be attributed to an optical transition to the HOMO(1π*) orbital, in which one or more holes are created by oxidation.
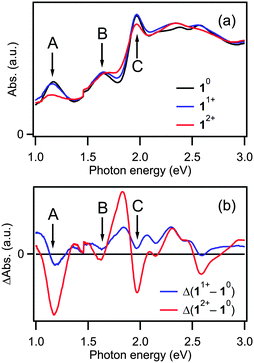 | ||
| Fig. 2 (a) Optical absorption spectra of 10, 11+, and 12+ and (b) spectra of 11+ and 12+ following subtraction of the spectrum of 10. | ||
Fig. 2b shows the spectra obtained by subtracting the spectrum of 10 from those of 11+ and 12+. The peak positions evidently did not change upon oxidation, indicating that the energy levels of the superatomic orbitals of 1 do not change regardless of the charge state. Given that the electronic structures of small clusters are sensitive to slight difference in the geometric structure,34 this result indicates that the geometric structure of 1 is not changed appreciably by the redox reactions. Namely, the bond length between the Au13 units within 1 was not changed even after the formal bond order is increased from 1 to 2. This behavior is in sharp contrast to that of F2, a molecular analogue of Au239+, since it is known that the F–F bond length in F2+ (1.33 Å) is shorter than that in F2 (1.44 Å).22 The negligible structural change of Au239+, even after 2-electron oxidation, thus demonstrates the structural rigidity of the face-sharing bi-icosahedral Au23.
Furthermore, the DFT structural optimizations of 10 and 12+ support this finding showing that the bond distances of core atoms do not change significantly at different charge states (Fig. S3 and Table S1, ESI†). One of the HOMO(1π*) orbitals in 10 is promoted to the LUMO orbital in 12+, but the HOMO orbitals of these structures still retain the same symmetry of 1π* (Fig. S4, ESI†). Hence, there is no distinctive structural effect induced by the electronic factor. The rigidity of Au239+ may partly arise from the protection by the rigid Au–SR oligomers with different lengths: especially three –SR–Au–SR– “staples” bridge across the waist of two Au13 icosahedra.35
Redox behavior of [Au25(PPh3)10(SC2H4Ph)5Cl2]2+
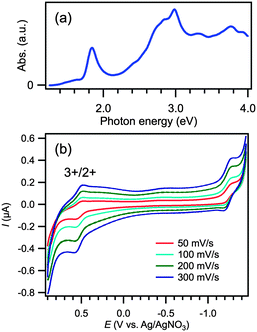
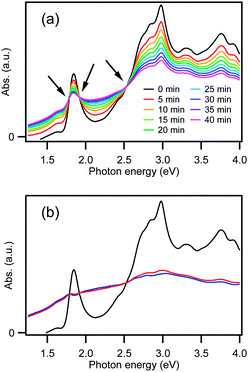
The synthesis of [Au25(PPh3)10(SC2H4Ph)5Cl2]2+ (22+) was confirmed by optical spectroscopy (Fig. 3a). The spectrum shows distinct peaks at 1.84, 2.98, 3.30, and 3.76 eV, which reproduces the reported data.12,36 The CV curves of 22+ shown in Fig. 3b exhibit irreversible waves in both the oxidative and reductive potential ranges. This result indicates that cluster 22+ is unstable upon one-electron oxidation.Fig. 4a presents the optical absorption spectra obtained during one-electron oxidation of 22+ at 0.60 V. The spectral profile changes with time while exhibiting three isosbestic points, as indicated by arrows. The peak at 1.84 eV drops in intensity and the optical gap is reduced during the electrooxidation reactions. This result implies that the electrooxidation of 22+ yielded a certain product having less structured absorption spectrum than 22+.
In order to gain insight into the electronic structures of the one-electron oxidation product, we attempted to extract its optical spectrum by assuming that 22+ is converted to a single species upon electrooxidation. Namely, we assume that the spectra in Fig. 4a represent a linear combination of the spectra of unoxidized 22+ and the oxidation product. Because the population of unoxidized 22+ at a certain time is unknown, we further assume that the oxidation product does not have sharp peaks at the same position with those of 22+. The optical spectra of the oxidation product extracted based on these assumptions are shown in Fig. 4b. Although there is an ambiguity in the spectral profile depending on the assumed concentration of unoxidized 22+, we can conclude that the oxidation product is less structured as compared to 22+ and optical onset is shifted to lower energy.
DFT calculations were carried out to study the geometric structure and optical properties of the one-electron oxidation product. Structural optimization of 23+ starting from vertex-sharing biicosahedral cores with eclipsed and staggered configurations (Fig. S5, ESI†) both yielded the eclipsed motif, which is similar to that of 22+ (Fig. 5a). The optimization results do not suggest that a staggered (twisted bi-icosahedral core)37 configuration is preferred for 23+, upon oxidation of 22+. Since the HOMO of 22+ has anti-bonding nature according to the previous theoretical calculations (Scheme 1b),15,17 one would expect that the distance between the two Au13 units to become smaller upon oxidation. In contrast to the prediction from Scheme 1b, the distance between the two Au13 units is slightly increased upon oxidation: the average distance between the nearest neighboring Au atoms between the Au13 units are 3.23 ± 0.018 and 3.27 ± 0.015 Å for 22+ and 23+, respectively (Fig. 5a). This unexpected trend is due to the fact that the HOMO of 22+ obtained by the present calculation has bonding nature (Fig. S6, ESI†). Inspection of the shape of the HOMO suggests that it is constructed via bonding interaction between 1P superatomic orbitals of Au13 moieties. Based on Scheme 1b, the HOMO of 22+ corresponds now to a 2σ state. Meanwhile, both the HOMO−1 and HOMO−2 correspond to 1π* states; and the HOMO−3 refers to a 2σ* state (Fig. S6, ESI†). Therefore, the ordering of the energetic states of HOMO and HOMO−3 has been interchanged. We consider this as a ligand effect: the energetically closely spaced orbitals, which are of superatomic 1P character, are sensitive to the influence of localized p-orbital states of individual sulfur atoms at the cluster waistline, and this lowers the energy of the 2σ* state.
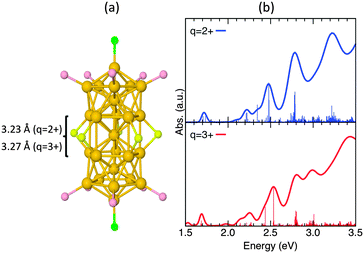 | ||
| Fig. 5 (a) Optimized core structures and (b) optical absorption spectra of 22+ and 23+. For simplicity, the ligands are omitted. The individual transition values have been multiplied by a factor of 20, and the full range of optical absorption spectra are available in Fig. S7 (ESI†). There is no significant change between the core structures optimized in different charge states, with a slight increment for distances between the nearest neighboring Au atoms of the Au13 moieties. | ||
Fig. 5b shows the calculated optical absorption spectra of 22+ and 23+. The calculated spectrum of 22+ reproduces well characteristic features of the experimental spectra (Fig. 3a). The spectrum of 23+ appears to be similar to that of 22+. Especially, the characteristic peak at ∼1.7 eV for 22+ is still present for 23+ (odd number of electrons, with spin-polarization), which is inconsistent with the experimental observation (Fig. 5b). This contradiction suggests that oxidized form 23+ is not stable in solution and is transformed into another structure or structures.
The electrooxidation sample of 22+ was examined by TEM. In the TEM images (Fig. S8, ESI†), only Au clusters smaller than 2 nm were observed although the sample contained unoxidized 22+. This observation and the absence of a surface plasmon resonance band in the oxidized sample (Fig. 4b) suggest that aggregation of 22+ is not induced upon oxidation. The oxidation product obtained after bulk electrolysis of 22+ was further examined using XAFS. Fig. 6 shows the Au L3-edge extended X-ray absorption fine structure (EXAFS) oscillations and FT-EXAFS spectra of 22+ and the oxidation product. The results of the EXAFS analysis are summarized in Table 1. From these data, it is evident that the coordination numbers of the Au–Au and Au–ligand bonds did not change appreciably upon electrooxidation.
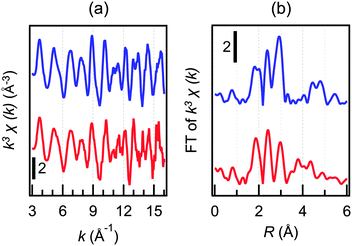 | ||
| Fig. 6 (a) Au L3-edge EXAFS oscillations and (b) FT spectra of 22+ (blue) and the one-electron oxidation product (red). | ||
| Sample | Atoma | C.N.b | r (Å) | D.W.d | R (%) |
|---|---|---|---|---|---|
| a Bonding atom. b Coordination number. c Bond length. d Debye–Waller factor. e R factor. | |||||
| 2 2+ | S (P, Cl) | 1.1(2) | 2.324(11) | 0.0061(27) | 9.9 |
| Au1 | 2.4(1.2) | 2.744(3) | 0.0045(7) | ||
| Au2 | 4.2(7) | 2.875(3) | 0.0050(5) | ||
| One-electron oxidation product | S (P, Cl) | 0.9(1) | 2.306(4) | 0.0040(15) | 8.9 |
| Au1 | 1.5(2) | 2.727(20) | 0.0040(10) | ||
| Au2 | 4.4(5) | 2.860(22) | 0.0076(12) | ||
The experimental and theoretical results reported above suggest that Au259+ with the vertex-sharing biicosahedral motif undergoes irreversible structural change upon oxidation. It is reported that phosphine-protected Au clusters such as [Au11(PPh3)8Cl2]+ are electrochemically unstable,38 whereas thiolate-protected Au clusters such as [Au25(SR)18]− are electrochemically stable.38,39 Thus, difference in the electrochemical instability between Au239+ and Au259+ superatomic molecules may be associated with that in the protecting ligands. The Au239+ core is protected by three –SR–Au–SR– and six –SR–(Au–SR)2– oligomers, whereas the Au259+ core is protected by five RS, ten PR3 and two halides. One possible pathway is the isomerization of the Au25 core induced by the release of the phosphine ligand upon electrooxidation. Such electrochemically irreversible structural isomerization has been observed in [Au8(Ph2P(CH2)3PPh2)4]n+ (n = 2 and 4).40
Conclusions
The structural changes of Au38(SC2H4Ph)24 and [Au25(PPh3)10(SC2H4Ph)5Cl2]2+ upon electrooxidation were studied by spectroelectrochemical and XAFS measurements and DFT calculations. The face-sharing Au239+ biicosahedron protected by Au–SR oligomers retains the structure upon oxidation, indicating that oxidation-induced geometric relaxation is negligibly small in contrast to the corresponding molecule F2. In contrast, the vertex-sharing Au259+ biicosahedron protected by thiolates, phosphines and halides underwent irreversible structural change. This electrochemical instability is ascribed to the bonding scheme between two Au13 units and/or the bonding nature of the protecting ligands.Acknowledgements
We thank Prof. Hiroshi Nishihara (The University of Tokyo) for providing us with access to the TEM apparatus. This research was financially supported by the Elements Strategy Initiative for Catalysis & Batteries (ESICB) and by a Grant-in-Aid for Scientific Research (no. 26248003) from the Ministry of Education, Culture, Sports, Science, and Technology (MEXT) of Japan. Financial support from the Centres of Excellence Program (Project 284621) by the Academy of Finland and the graduate student scholarship by Magnus Ehrnrooth foundation are gratefully acknowledged. Computational resources were provided by CSC – the IT Center for Science Ltd Espoo, Finland.Notes and references
- C. E. Briant, B. R. C. Theobald, J. W. White, L. K. Bell, D. M. P. Mingos and A. J. Welch, J. Chem. Soc., Chem. Commun., 1981, 5, 201 RSC.
- M. W. Heaven, A. Dass, P. S. White, K. M. Holt and R. W. Murray, J. Am. Chem. Soc., 2008, 130, 3754 CrossRef CAS PubMed.
- M. Zhu, C. M. Aikens, F. J. Hollander, G. C. Schatz and R. Jin, J. Am. Chem. Soc., 2008, 130, 5883 CrossRef CAS PubMed.
- Y. Shichibu and K. Konishi, Small, 2010, 6, 1216 CrossRef CAS PubMed.
- X.-K. Wan, Q. Tang, S.-F. Yuan, D.-e. Jiang and Q.-M. Wang, J. Am. Chem. Soc., 2015, 137, 652 CrossRef CAS PubMed.
- M. Sugiuchi, Y. Shichibu, T. Nakanishi, Y. Hasegawa and K. Konishi, Chem. Commun., 2015, 51, 13519 RSC.
- J. Akola, M. Walter, R. L. Whetten, H. Häkkinen and H. Grönbeck, J. Am. Chem. Soc., 2008, 130, 3756 CrossRef CAS PubMed.
- M. Walter, J. Akola, O. Lopez-Acevedo, P. D. Jadzinsky, G. Calero, C. J. Ackerson, R. L. Whetten, H. Grönbeck and H. Häkkinen, Proc. Natl. Acad. Sci. U. S. A., 2008, 105, 9157 CrossRef CAS PubMed.
- L. Cheng, C. Ren, J. Zhang and X. Yang, Nanoscale, 2013, 5, 1475 RSC.
- J. Nishigaki, K. Koyasu and T. Tsukuda, Chem. Rec., 2014, 14, 897 CrossRef CAS PubMed.
- H. Qian, W. T. Eckenhoff, Y. Zhu, T. Pintauer and R. Jin, J. Am. Chem. Soc., 2010, 132, 8280 CrossRef CAS PubMed.
- Y. Shichibu, Y. Negishi, T. Watanabe, N. K. Chaki, H. Kawaguchi and T. Tsukuda, J. Phys. Chem. C, 2007, 111, 7845 CAS.
- R. Jin, C. Liu, S. Zhao, A. Das, H. Xing, C. Gayathri, Y. Xing, N. L. Rosi, R. R. Gil and R. Jin, ACS Nano, 2015, 9, 8530 CrossRef CAS PubMed.
- Y. Song, F. Fu, J. Zhang, J. Chai, X. Kang, P. Li, S. Li, H. Zhou and M. Zhu, Angew. Chem., Int. Ed., 2015, 54, 8430 CrossRef CAS PubMed.
- K. Nobusada and T. Iwasa, J. Phys. Chem. C, 2007, 111, 14279 CAS.
- J.-Q. Goh, S. Malola, H. Häkkinen and J. Akola, J. Phys. Chem. C, 2013, 117, 22079 CAS.
- T. Iwasa and K. Nobusada, and A. Nakajima, J. Phys. Chem. C, 2013, 117, 24586 CAS.
- O. Lopez-Acevedo, H. Tsunoyama, T. Tsukuda, H. Häkkinen and C. M. Aikens, J. Am. Chem. Soc., 2010, 132, 8210 CrossRef CAS PubMed.
- D. M. P. Mingos, Dalton Trans., 2015, 44, 6680 RSC.
- S. Antonello, N. V. Perera, M. Ruzzi, J. A. Gascón and F. Maran, J. Am. Chem. Soc., 2013, 135, 15585 CrossRef CAS PubMed.
- D. Jiang, M. Kühn, Q. Tang and F. Weigend, J. Phys. Chem. Lett., 2014, 5, 3286 CrossRef CAS PubMed.
- A. B. Cornford, D. C. Frost, C. A. McDowell, J. L. Ragle and I. A. Stenhouse, J. Chem. Phys., 1971, 54, 2651 CrossRef CAS.
- N. L. Ma, W.-K. Li and C. Y. Ng, J. Chem. Phys., 1993, 99, 3617 CrossRef CAS.
- K. Kwak, Q. Tang, M. Kim, D. Jiang and D. Lee, J. Am. Chem. Soc., 2015, 137, 10833 CAS.
- H. Qian, Y. Zhu and R. Jin, ACS Nano, 2009, 3, 3795 CrossRef CAS PubMed.
- S. Y. Park and D. Lee, Langmuir, 2012, 28, 7049 CrossRef CAS PubMed.
- A. L. Ankudinov, B. Ravel, J. J. Rehr and S. D. Conradson, Phys. Rev. B: Condens. Matter Mater. Phys., 1998, 58, 7565 CrossRef CAS.
- J. Enkovaara, C. Rostgaard, J. J. Mortensen, J. Chen, M. Dułak, L. Ferrighi, J. Gavnholt, C. Glinsvad, V. Haikola, H. A. Hansen, H. H. Kristoffersen, M. Kuisma, A. H. Larsen, L. Lehtovaara, M. Ljungberg, O. Lopez-Acevedo, P. G. Moses, J. Ojanen, T. Olsen, V. Petzold, N. A. Romero, J. Stausholm-Møller, M. Strange, G. A. Tritsaris, M. Vanin, M. Walter, B. Hammer, H. Häkkinen, G. K. H. Madsen, R. M. Nieminen, J. K. Nørskov, M. Puska, T. T. Rantala, J. Schiøtz, K. S. Thygesen and K. W. Jacobsen, J. Phys.: Condes. Matter, 2010, 22, 253202 CrossRef CAS PubMed.
- M. Walter, H. Häkkinen, L. Lehtovaara, M. Puska J. Enkovaara, C. Rostgaard and J. J. Mortensen, J. Chem. Phys., 2008, 128, 244101 CrossRef PubMed.
- J. P. Perdew, K. Burke and M. Ernzerhof, Phys. Rev. Lett., 1996, 77, 3865 CrossRef CAS PubMed.
- N. K. Chaki, Y. Negishi, H. Tsunoyama, Y. Shichibu and T. Tsukuda, J. Am. Chem. Soc., 2008, 130, 8608 CrossRef CAS PubMed.
- O. Toikkanen, V. Ruiz, G. Rönnholm, N. Kalkkinen, P. Liljeroth and B. M. Quinn, J. Am. Chem. Soc., 2008, 130, 11049 CrossRef CAS PubMed.
- M. Hesari, M. S. Workentin and Z. Ding, ACS Nano, 2014, 8, 8543 CrossRef CAS PubMed.
- K. Konishi, Struct. Bonding, 2014, 161, 49 CrossRef.
- S. Yamazoe, S. Takano, W. Kurashige, T. Yokoyama, K. Nitta, Y. Negishi and T. Tsukuda, Nat. Commun., 2016, 7, 10414 CrossRef CAS PubMed.
- M. S. Devadas, V. D. Thanthirige, S. Bairu, E. Sinn and G. Ramakrishna, J. Phys. Chem. C, 2013, 117, 23155 CAS.
- J. Nishigaki, S. Yamazoe, S. Kohara, A. Fujiwara, W. Kurashige, Y. Negishi and T. Tsukuda, Chem. Commun., 2014, 50, 839 RSC.
- Y. Negishi, N. K. Chaki, Y. Shichibu, R. L. Whetten and T. Tsukuda, J. Am. Chem. Soc., 2007, 129, 11322 CrossRef CAS PubMed.
- D. Lee, R. L. Donkers, J. M. DeSimone and R. W. Murray, J. Am. Chem. Soc., 2003, 125, 1182 CrossRef CAS PubMed.
- Y. Kamei, N. Robertson, Y. Shichibu and K. Konishi, J. Phys. Chem. C, 2015, 119, 10995 CAS.
Footnote |
| † Electronic supplementary information (ESI) available. See DOI: 10.1039/c5cp06969f |
| This journal is © the Owner Societies 2016 |

