 Open Access Article
Creative Commons Attribution 3.0 Unported Licence
A new potassium-based intermediate and its role in the desorption properties of the K–Mg–N–H system†
A.
Santoru
*a,
S.
Garroni
b,
C.
Pistidda
a,
C.
Milanese
c,
A.
Girella
c,
A.
Marini
c,
E.
Masolo
b,
A.
Valentoni
b,
N.
Bergemann
a,
T. T.
Le
a,
H.
Cao
a,
D.
Haase
d,
O.
Balmes
d,
K.
Taube
a,
G.
Mulas
b,
S.
Enzo
b,
T.
Klassen
a and
M.
Dornheim
a
aInstitute of Materials Research, Materials Technology, Helmholtz-Zentrum Geesthacht GmbH, Max-Planck Strasse 1, D-21502 Geesthacht, Schleswig-Holstein, Germany. E-mail: antonio.santoru@hzg.de
bDepartment of Chemistry and Pharmacy, INSTM, Via Vienna 2, I-07100 Sassari, Italy
cPavia H2 Lab, Department of Chemistry, Physical Chemistry Section, University of Pavia, VialeTaramelli 16, I-27100 Pavia, Italy
dMAX IV Laboratory, Lund University, Römers väg 1, 22363 Lund, Sweden
First published on 14th January 2016
Abstract
New insights into the reaction pathways of different potassium/magnesium amide–hydride based systems are discussed. In situ SR-PXD experiments were for the first time performed in order to reveal the evolution of the phases connected with the hydrogen releasing processes. Evidence of a new K–N–H intermediate is shown and discussed with particular focus on structural modification. Based on these results, a new reaction mechanism of amide–hydride anionic exchange is proposed.
Introduction
Among the known hydrogen storage materials, amides represent a promising class of compounds for vehicular on-board applications.1 Although the first studies on metal amides date back to the 19th century,2,3 only recently the possibility to use them as hydrogen storage materials was reported, i.e. in 2002, when P. Chen et al. described the possibility to use lithium amide combined with lithium hydride for this purpose.4The LiNH2–LiH system has a relatively high gravimetric hydrogen capacity (6.3 wt% in the temperature range of 170–210 °C) and interesting thermodynamic properties (ΔHdes ≈ 45 kJ mol−1).4 However, during hydrogen desorption, the release of ammonia may also occur. Additionally, in contrast to what it is predicted by the thermodynamic calculations, experimentally temperatures above 275 °C are necessary to reach 1 bar of equilibrium hydrogen pressure.4
The approach of combining different compounds to achieve new hydrogen storage systems with improved thermodynamic properties and high hydrogen storage capacities is a strategy widely adopted, and systems to which this approach applies are known as Reactive Hydride Composites (RHCs).4–22 Recently, MgH2 has been used by Luo23 and Xiong et al.24 to modify the thermodynamic properties of LiNH2. By this replacement the formation of dilithium magnesium imide (i.e. Li2Mg(NH)2) is possible (reaction (1)):
| 2LiNH2 + MgH2 → Li2Mg(NH)2 + 2H2 | (1) |
Mg(NH2)2 + 2LiH ![[left over right harpoons]](https://www.rsc.org/images/entities/char_21cb.gif) Li2Mg(NH)2 + 2H2 Li2Mg(NH)2 + 2H2 | (2) |
To date, the addition of K-based compounds has shown to be beneficial for improving the desorption kinetics of Mg(NH2)2/2LiH.29–34 Upon cycling, all the investigated K-based compounds convert into KH.29,34 In this sense, potassium hydride – partially replacing lithium hydride – is regarded as one of the best additives for the Mg(NH2)2/LiH system, lowering the dehydrogenation temperature by 50–100 °C.29 Recently, the interactions between KH and Mg(NH2)2 were also investigated.35 According to this study, the desorption path followed by the Mg(NH2)2–KH system under non-equilibrium conditions is characterized by two main steps with the formation of dipotassium magnesium tetraamide (K2Mg(NH2)4) and magnesium imide (MgNH) phases first, and then of the potassium magnesium amide imide phase (KMg(NH)(NH2)). In a following investigation, the authors hypothesized that K2Mg(NH2)4, forming at the Mg(NH2)2/KH interface and interacting with LiH, might play a key role in enhancing the hydrogen desorption kinetics of this system.32 In the same context, the decomposition of pure K2Mg(NH2)4 and of the K2Mg(NH2)4/Mg(NH2)2 binary mixture was also investigated.35 Compared to the earlier crystallographic studies on the thermal decomposition of various M2Mg(NH2)4 phases36,37 the results obtained in the recent work by Wang and co-authors35 revealed some incongruence. Earlier studies reported the formation of the K2Mg(NH2)2(NH) and K2Mg(NH)2 phases in the temperature range of 180–250 °C, and then the formation of KMgN at about 330 °C.36,37 Instead of the above mentioned phases the recent literature reports the formation of a new phase, namely KMg(NH)(NH2).35 The crystal structure of this phase was solved only recently by Napolitano et al.38 However, the K–Mg–N–H systems are not yet widely investigated and more efforts are needed in order to understand the kinetic pathways and the underlying hydrogen sorption mechanisms.
In this work the desorption properties, reaction mechanism, and phase evolution of different K–Mg–N–H systems were studied using a wide range of techniques. In the range of experimental conditions investigated in this work, the possible formation of crystalline K2Mg(NH2)2(NH), K2Mg(NH)2 and KMgN was disproved by in situ diffraction experiments.
In order to clarify the possible interactions, the KNH2–MgH2 and KH–Mg(NH2)2 systems were compared. A special emphasis will be put on the structural modifications governing the reaction pathway.
Experimental
KH (suspension 35% in mineral oil) and MgH2 (98%) were purchased from Sigma-Aldrich. In order to purify KH, the oil was removed washing the powder 3 times with 15 mL of pentane and then drying it under vacuum. For the synthesis of sample A 0.802 g and 0.526 g of KH and MgH2 (molar ratio 1![[thin space (1/6-em)]](https://www.rsc.org/images/entities/char_2009.gif) :
:![[thin space (1/6-em)]](https://www.rsc.org/images/entities/char_2009.gif) 1) were milled under 7 bar of ammonia atmosphere in a High Pressure Vial (Evico-Magnetics) using a ball to powder ratio (BPR) of 10
1) were milled under 7 bar of ammonia atmosphere in a High Pressure Vial (Evico-Magnetics) using a ball to powder ratio (BPR) of 10![[thin space (1/6-em)]](https://www.rsc.org/images/entities/char_2009.gif) :
:![[thin space (1/6-em)]](https://www.rsc.org/images/entities/char_2009.gif) 1 and a total milling time of 20 h. KNH2 and Mg(NH2)2 were synthesized separately by repeated mechanochemical treatments of the corresponding metal hydrides under 7 bar of ammonia. After mechanical processing, the Mg(NH2)2 sample was also annealed under 7 bar of ammonia for more than 10 h in a Parr reactor to increase its conversion and crystallinity.
1 and a total milling time of 20 h. KNH2 and Mg(NH2)2 were synthesized separately by repeated mechanochemical treatments of the corresponding metal hydrides under 7 bar of ammonia. After mechanical processing, the Mg(NH2)2 sample was also annealed under 7 bar of ammonia for more than 10 h in a Parr reactor to increase its conversion and crystallinity.
The 1![[thin space (1/6-em)]](https://www.rsc.org/images/entities/char_2009.gif) :
:![[thin space (1/6-em)]](https://www.rsc.org/images/entities/char_2009.gif) 1 KNH2 + MgH2 and KH + Mg(NH2)2 mixtures were synthesized by grinding the corresponding starting materials in an agate mortar for 10 minutes. Ball milling was not employed to avoid any mechanically induced metathesis reaction or amorphization processes. Thus the materials maintained the original compositional and microstructural state before the in situ SR-PXD experiments were performed.
1 KNH2 + MgH2 and KH + Mg(NH2)2 mixtures were synthesized by grinding the corresponding starting materials in an agate mortar for 10 minutes. Ball milling was not employed to avoid any mechanically induced metathesis reaction or amorphization processes. Thus the materials maintained the original compositional and microstructural state before the in situ SR-PXD experiments were performed.
All the samples were manipulated inside an argon-filled glove box with water and oxygen levels lower than 1 ppm.
Thermal desorption mass spectroscopy (TD-MS) was performed using a Netzsch STA 409 for heating up the sample in an alumina crucible at 5 °C min−1 and under argon flow of 50 mLn min−1. The gases released from the sample upon heating were investigated using a HidenAnalytical HAL 201 Mass-Spectrometer.
Sieverts apparatus measurements were performed in a PCTPro-2000 instrument, heating the sample with a heating rate of 10 °C min−1 under a pressure of 1.5 bar of argon. About 150 mg of the sample were loaded into the sample holder. The external holder was then filled with full metal supplements in order to reduce the volume and increase the accuracy of the measurement.
The structural investigation and the phase evolution during the desorption process were performed at the MAX II Synchrotron facility in Lund, Sweden, beamline I711.39 The instrumental geometry of the powder diffractometer is a Debye–Scherrer like configuration with a selected wavelength λ ≈ 0.99 Å and a plate image Agilent Titan detector (2048 × 2048 pixel, each of size 60 × 60 μm2) placed about 80 mm from the sample holder. The calibration of the instrumental function was carried out using a LaB6 powder. The powdered mixtures were introduced into a borosilicate glass capillary of 1 mm diameter, sealed to warrant the inert atmosphere in the course of in situ measurement, which was conducted at 1 bar of Ar pressure. The system was heated at 10 °C min−1 by a thermal element (electric resistance) placed just below the capillary. The temperature was monitored by a thermocouple mounted inside the capillary itself and placed almost in contact with the powder for higher accuracy.40 Uncertainties of about 1 °C were observed if the intermediate values were obtained by interpolation of all the points of the heating ramp or only the 2 values closer to the intermediate one.
The 2-dimensional annular ring patterns were accumulated every 15 or 30 seconds and processed by means of the FIT2D software41 which enables to mask on demand critical data due to texture or single crystal spikes and to convert the 2-D data into the “classical” 1-dimensional pattern, intensity-vs.-scattering vector. Piling-up these 1-D patterns, using for example Origin42 can supply a contour plot of intensities as a function of the variables: scattering vector (Q), pattern number (scan) and corresponding temperature, respectively.
The ex situ XRD patterns were collected using a Bruker D8 Discover diffractometer with a Cu X-ray lamp (λ = 1.54184 Å) and a general area detector in Bragg–Brentano geometry. The diffraction patterns were plotted as a function of the scattering vector (Q) in order to have wavelength independent data, which allows a faster comparison of in situ SR-PXD and ex situ XRD measurements. The reactive samples were protected from oxidation during the measurement employing a PMMA dome sample holder produced by Bruker.
The qualitative and quantitative XRD analyses were performed by MAUD software43,44 implementing the Rietveld approach.45,46 For the known phases, structural models from the literature were used.38,47–57
VESTA (Visualization of Electronic and STructural Analysis) was used for graphical representation of the structural models.58
Results and discussion
KH–MgH2–NH3 system
As a first approach we studied the effect of ball milling on the reactivity of the KH–MgH2–NH3 system: KH + MgH2 (1![[thin space (1/6-em)]](https://www.rsc.org/images/entities/char_2009.gif) :
:![[thin space (1/6-em)]](https://www.rsc.org/images/entities/char_2009.gif) 1 molar ratio) were milled for 20 h under 7 bar of ammonia at 400 rpm (sample A). The intermediate phases formed during milling were determined by means of ex situ X-ray diffraction. The XRD pattern (Fig. 1) of the as milled sample reveals the formation of KNH2, K2Mg(NH2)4 and the presence of un-reacted MgH2. Conversely the other starting reagent, KH, is not detected because it reacted completely with ammonia forming the corresponding amide (reaction (3)). This finding suggests that the reactivity of MgH2 towards NH3 is lower compared to KH when the reaction is promoted by ball-milling. A recent work on the in situ synthesis of amides revealed that the same difference in reactivity takes place when the reactions are induced by thermal rather than mechanical input.59 In light of these events, a multi-step reaction pathway, involving the formation of Mg(NH2)2 and KNH2 as intermediate products, can be envisaged as follows:
1 molar ratio) were milled for 20 h under 7 bar of ammonia at 400 rpm (sample A). The intermediate phases formed during milling were determined by means of ex situ X-ray diffraction. The XRD pattern (Fig. 1) of the as milled sample reveals the formation of KNH2, K2Mg(NH2)4 and the presence of un-reacted MgH2. Conversely the other starting reagent, KH, is not detected because it reacted completely with ammonia forming the corresponding amide (reaction (3)). This finding suggests that the reactivity of MgH2 towards NH3 is lower compared to KH when the reaction is promoted by ball-milling. A recent work on the in situ synthesis of amides revealed that the same difference in reactivity takes place when the reactions are induced by thermal rather than mechanical input.59 In light of these events, a multi-step reaction pathway, involving the formation of Mg(NH2)2 and KNH2 as intermediate products, can be envisaged as follows:| KH + NH3 → KNH2 + H2 | (3) |
| MgH2 + 2NH3 → Mg(NH2)2 + 2H2 | (4) |
| 2KNH2 + Mg(NH2)2 → K2Mg(NH2)4 | (5) |
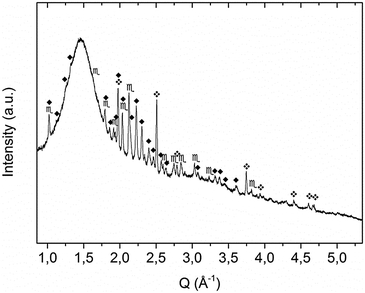 | ||
Fig. 1 XRD pattern of sample A as obtained after mechanochemical treatment.  = KNH2 (monoclinic), ✦ = K2Mg(NH2)4, = KNH2 (monoclinic), ✦ = K2Mg(NH2)4,  = MgH2. = MgH2. | ||
However, the formation of amorphous Mg(NH2)2 was already reported in the literature when ball milling is used for the synthesis, therefore the presence of Mg(NH2)2 in a nanocrystalline/amorphous state cannot be completely excluded by XRD experiments.47
Desorption properties
The desorption properties of sample A were studied by manometric analysis. In order to confirm the reliability of the obtained gravimetric hydrogen capacities, the presence of gaseous ammonia together with hydrogen in the released gases was monitored by thermal desorption mass spectrometry experiments.According to Fig. 2a, one main desorption step could be observed. In total, about 1.8 wt% of hydrogen was released after 50 minutes: the process was slow below 200 °C (<0.2 wt% of H2 released in the first 20 minutes) but became vigorous above 210 °C (>1.2 wt% of H2 released in about 5 minutes).
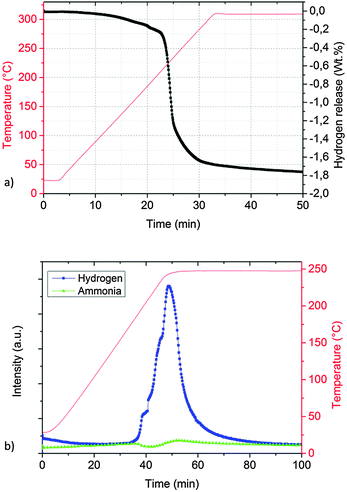 | ||
| Fig. 2 Desorption properties of sample A determined by a Sieverts apparatus (a) and thermal desorption mass spectrometry (TD-MS) (b). | ||
The corresponding thermal desorption mass-spectrometry experiment presented in Fig. 2b shows a release of mainly H2, the presence of NH3 is almost undetectable.
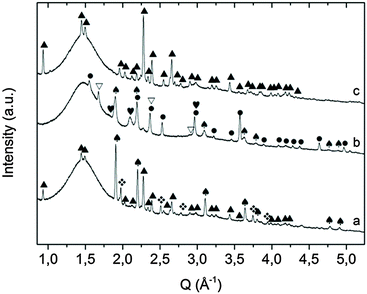
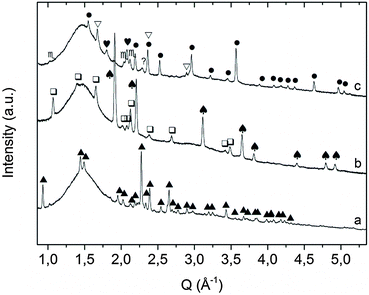
Ex situ XRD performed on sample A after desorption and re-absorption in the manometric apparatus revealed the formation of KMgNH2NH (Fig. 3a), and KH and Mg(NH2)2 (Fig. 3b) phases, respectively.
The measurements indicate that the hydrogenation process proceeded according to reaction (6), in agreement with the data reported by Wang et al.,35 even if sample preparation and the desorption process were totally different.
| KMgNH2NH + H2 → KH + Mg(NH2)2 | (6) |
The ex situ XRD performed after thermal treatment of the KMgNH2NH product up to 450 °C under static vacuum, disproved the formation of KMgN (Fig. 3c) as the decomposition product of the amide–imide phase and revealed the formation of a new cubic phase: the peak position does not match the cubic phase of KH and the cubic polymorph of KNH2 since a cell parameter of 6.06 Å was found.
This cubic phase is most probably a solid solution of KNH2 and KH of variable stoichiometry and the different extent of substitution of amide–hydride anions is responsible for the intermediate cell parameter as pointed out in a recent study.59 The structural similarities between potassium hydride and the cubic polymorph of KNH2 are several (i.e. the same space group, the same cation, hydride and amide anion have the same charge and the difference between the cell parameters of the two pure phases is below 10%). Due to the structural relationships the formation of a solid solution is very likely to occur.
Reaction pathway
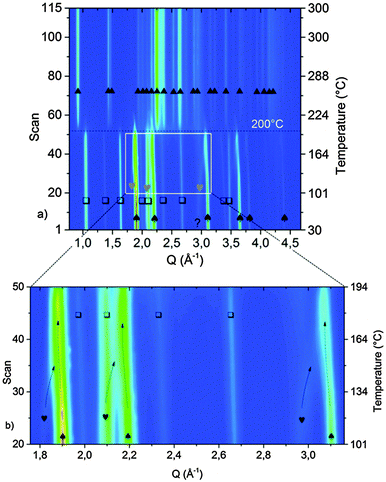
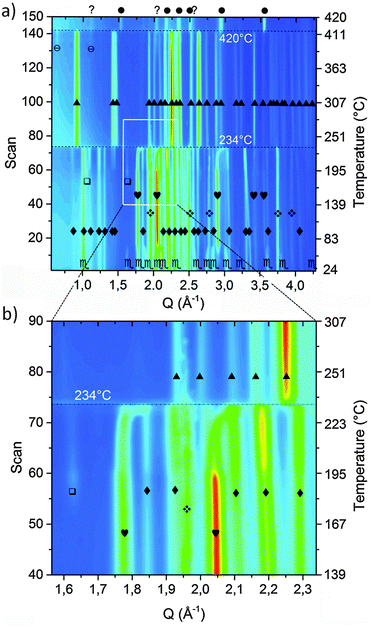
In order to investigate the desorption mechanism of sample A and clarify if the phases reported by Palvadeau and Rouxel36,37 are formed as intermediate or metastable components, SR-PXD was employed. Time-resolved SR-PXD is well regarded as a powerful technique for observing structural and microstructural modifications, allowing at the same time the identification of reaction intermediates formed during phase transformations or sorption reactions in solid-state chemistry.60Fig. 4 shows the SR-PXD patterns collected at increasing time intervals and in the temperature range from 25 °C to 420 °C.
The first variation in the diffraction patterns was related to a phase transformation of potassium amide: in the temperature range 50 °C < T < 80 °C the monoclinic cell rearranged into a cubic geometry through an intermediate tetragonal polymorph of KNH2 (P4/nmm).48
Increasing the temperature to 167 °C, the Bragg reflections of Mg(NH2)2 appeared (Fig. 4a) most probably due to re-crystallization of an amorphous product formed during the synthesis of the sample, as previously hypothesized.
The formation of crystalline Mg(NH2)2 could also arise from a metathesis reaction between magnesium hydride and amide-ion-containing phases (KNH2 or K2Mg(NH2)4). However, only the peak intensities of Mg(NH2)2 increased in this step: the Bragg reflections of the co-product that would be generated should appear as well, and the intensity of the peaks of the amide-containing phase should decrease as well, but according to the details reported in Fig. 4 this is not the case. Furthermore, the broad signal in the low Q-range (Q < 1.5 Å−1), due to the incoherent scattering from amorphous and/or nanocrystalline phases, disappeared in the same temperature range.
The subsequent decreased intensity of Mg(NH2)2 and KNH2 reflections was associated with an increment of K2Mg(NH2)4 peaks when the temperature reached 195 °C (see Fig. 4 for details). Most probably the K2Mg(NH2)4 phase is formed by the interaction of KNH2 with Mg(NH2)2 according to reaction (5).
Upon increasing the temperature, at 234 °C a sudden transition in the 2-D diffraction plot is visible (zoom in Fig. 4b). This event coincides with the disappearance of the K2Mg(NH2)4 peaks. The transition is rather fast for being ascribable to a solid state reaction: most likely the observed phenomenon is ascribable to the melting of K2Mg(NH2)4. This supposition is supported by the fact that the background intensity between 5° and 10° increases significantly. The DSC measurement on the pure K2Mg(NH2)4 phase also showed an endothermic event in the same temperature range (reported in the ESI† – Fig S1). Magnesium hydride particles dispersed in the liquid K2Mg(NH2)4 phase reacted releasing hydrogen and forming KMgNH2NH according to reaction (7).
| K2Mg(NH2)4 + MgH2 → 2KMgNH2NH + 2H2 | (7) |
The theoretical capacity of reaction (7) is 2.1 wt%. The difference from the experimental value of 1.8 wt% determined by a Sievert apparatus could be ascribable to the hydrogen release during milling, as reported in a previous study.35
The reproducibility of reaction (7) was cross-checked by another ex situ experiment: K2Mg(NH2)4 and MgH2 (1![[thin space (1/6-em)]](https://www.rsc.org/images/entities/char_2009.gif) :
:![[thin space (1/6-em)]](https://www.rsc.org/images/entities/char_2009.gif) 1) were ground and then annealed at 280 °C for 1 h under 1 bar of argon pressure. The XRD pattern showing the KMgNH2NH phase formation is reported in the ESI† (Fig. S2).
1) were ground and then annealed at 280 °C for 1 h under 1 bar of argon pressure. The XRD pattern showing the KMgNH2NH phase formation is reported in the ESI† (Fig. S2).
Another interesting aspect of the desorption process was revealed by the in situ experiment reported in Fig. 4: below 234 °C, a shift of the cubic KNH2 peaks to higher Q-values anticipates the desorption step. Therefore a fast contraction of the cubic KNH2 cell volume takes place. This event is in contrast to the predictable thermal expansion of potassium amide unit cell and may be ascribed to an interaction with magnesium hydride; the mechanism of this interaction will be explored and discussed in the next section.
The amide–imide phase showed high thermal stability (Fig. 4), and the decomposition only took place at 420 °C in good agreement with the decomposition temperature found by Wang et al.35 Due to decomposition, Mg3N2 was formed as an end-product while MgNH is most likely a reaction intermediate for the formation of Mg3N2. Also a minor unknown component was produced, differently from the phases previously reported by Palvadeau and Rouxel.36,37 Additionally, KMgN was not detected. Complementary in situ and ex situ XRD allowed to prove that the K-containing products at these temperatures were formed in a molten state: indeed they were revealed in the ex situ experiment (Fig. 3c) but undetectable as coherent scattering in the in situ experiment; only an increasing diffuse scattering was noticed, markedly in the low Q region (Q < 1.5 Å−1, Fig. 4a).
KNH2–MgH2 system
The singular behavior evidenced in the potassium amide crystal structure (just below 234 °C and above 420 °C, Fig. 4 and 3c respectively) and the scarce information available in the literature motivated further work to explain the previous results. The potassium amide and magnesium hydride mixture was here studied for the first time by in situ SR-PXD to understand the origin of this interaction upon heating and the underlying mechanism. According to the work carried out in recent years by P. Chen et al., the hydrogen release in amide–hydride mixtures can arise from the Hδ+–Hδ− interaction.26,61 The maximum hydrogen capacity is therefore obtained by selecting the system compositions with an equal amount of hydrogen atoms in the oxidation states (+I) and (−I). As a consequence of this strategy for designing systems with higher hydrogen capacities, nitride phases are usually formed upon decomposition and all the hydrogen is released.62 Following this approach a study of the KNH2–MgH2 system could reject or confirm the existence of a KMgN phase resulting from the interaction between an equal number of hydrogen atoms with partial positive and negative charges.Reaction pathway and the mechanism
Due to the preparation of the KNH2 + MgH2 mixture (sample B) in the starting diffraction patterns KNH2 and MgH2 are the major starting components (Fig. 5); an impurity of Mg was also found to be present in the as-received MgH2.The temperature of the first desorption step (234 °C) is basically unchanged. Due to the ratio of metal–nitrogen atoms, the desorbed state could not be consistent with the pure KMgNH2NH phase as found for sample A. Indeed, according to Fig. 5b, not only KMgNH2NH but also KH and residual MgH2 were found. For this reason the desorption, expected in this temperature range, can be envisaged as follows:
| 2KNH2 + 2MgH2 → KMgNH2NH + MgH2 + KH + H2 | (8) |
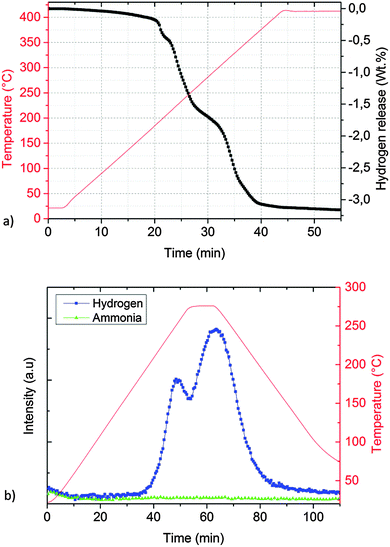 | ||
| Fig. 6 Desorption properties of ground KNH2 + MgH2 (sample B) determined by: (a) Sieverts apparatus and (b) thermal desorption mass spectrometry. | ||
However, there was no clear plateau at this point and the desorption continued with the same rate until 1.6–1.7 wt% of hydrogen was released.
The additional desorption may depend on the formation of an amorphous imide as an intermediate phase. Ex situ XRD on the sample collected after about 1.7 wt% of hydrogen was released (Fig. 7a), which revealed the presence of the same phases shown in the in situ measurement at about 250 °C (Fig. 5b). The cell parameter of KH was found to be slightly bigger (5.74 vs. 5.70 Å) which can be explained by the presence of residual amide anions in the structure.
During the measurement the cell parameter of KNH2 undergoes a continuous contraction of the cubic cell. This phenomenon, previously observed for sample A at rather similar temperature is therefore ascribable to the interaction of KNH2 and MgH2.
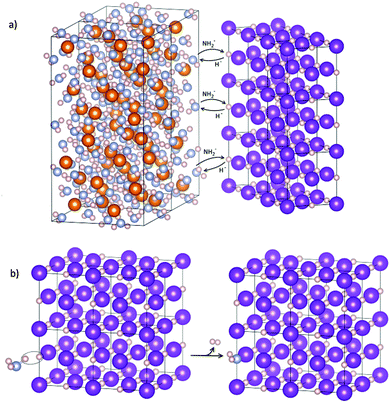
According to literature data, the cell parameters at 120 °C for KH and cubic KNH2 are 5.73 Å and 6.17 Å, respectively. Since the space group and the cation are the same for the two crystal structures, it can be inferred that the different cell length is due to the different ionic radius of the amide and hydride anions and to the extent of amide–hydride substitution (K(NH2)xH(1−x) where 0 ≤ x ≤ 1). Therefore the contraction of the cell volume at increasing temperature (Fig. 5b) may be explained by a substitution mechanism of amide groups with smaller anions, namely by hydride anions from MgH2.
David et al. and Makepeace et al. have recently reported a cubic solid solution Li2−xNH1+x as an intermediate of the LiNH2/Li2NH structures resulting from the interaction of LiNH2 and LiH.63,64 Their in situ XRD experiment clearly showed expansion and contraction of the crystal cell depending on the chemical composition of the Li–N–H intermediates, similar to our case. However, due to different chemistry of the K–N–H system, no stable K2NH phases are reported so far. Furthermore the position and relative intensities of the Bragg reflections match the ones of KNH2 and KH phases as the starting and end-product, respectively (Fig. 5b), and the changing intensity of the (1, 1, 1) and (2, 0, 0) Bragg reflections (Fig. 5b) also supports the structural modification and substitution of amide anions by entities with lower scattering strength in the lattice. In summary, by evaluating different chemistry of LiNH2–LiH with respect to the KNH2–KH case, we propose here for the first time the mechanism of amide–hydride exchange involving the formation of a solid solution even if we should also consider the approach by David et al. and Makepeace et al.63,64 where they devised a continuous solid solution of LiNH2 with Li2NH; of course in our case the existence of the K2NH imide compound remains to be demonstrated.
Further increase of temperature up to 234 °C led to appearance of weak peaks of K2Mg(NH2)4 anticipating the desorption processes (Fig. 5a). Then at 367 °C all the reflections attributable to KMgNH2NH, MgH2 and MgNH disappeared, magnesium nitride was formed and a fast expansion of the KH lattice took place (Fig. 5c). According to the data reported in the literature an expansion of the KH cell volume of about 1% is expected to take place in the temperature range between 308 and 400 °C.51 Although the thermal expansion of pure KH is known to follow a linear behavior,51 in our experiment (Fig. 5c) for the same temperature range a considerably bigger expansion of the cell volume takes place: the calculated expansion is about 8.5 vol%. Amide anions from KMgNH2NH are most probably responsible for this event, while the imide groups further react with hydride anions forming the nitride phase and release hydrogen. The process may be described according to reaction (9).
| 3KMgNH2NH + 3KH + 3MgH2 → 2Mg3N2 + 6K(NH2)1/3H2/3 + 5H2 | (9) |
| 3KNH2 + 3MgH2 → Mg3N2 + 3K(NH2)1/3H2/3 + 4H2 | (10) |
The theoretical value of gravimetric capacity according to reaction (10) (3.3 wt%) is close to the experimental value of 3.2 wt% determined by the Sievert apparatus (Fig. 6a).
The hydrogen desorption expected from the in situ PXD and manometric measurement was confirmed by a TD-MS experiment (Fig. 6b). Noteworthily, even if ball milling is known to be beneficial in lowering ammonia release (for example, the magnesium amide–magnesium hydride system67) for potassium amide–magnesium hydride the ammonia release was rather low compared to the H2 signal, even if the use of ball milling was avoided.
KH–Mg(NH2)2
| 2KNH2 + MgH2 → Mg(NH2)2 + 2KH | (11) |
The reactants are metastable at room temperature and hydrogen release should occur as an exothermic event: therefore the higher temperature of hydrogen release in our experiment is due to higher kinetic barriers and does not depend on the thermodynamic properties of the system. Moreover even though the metathesis reaction is exothermic and therefore favorable, no metathesis was observed: according to our in situ diffraction experiments if KH is not present in the system, the desorption takes place at about 230 °C, even when ball milling is employed for the synthesis (sample A). The results suggest that thermodynamic differences arising from different compositions had only a small effect on the desorption temperature during a kinetic experiment and that the formation of the most stable phases (Mg(NH2)2 and KH) is kinetically hindered during the desorption process: in our experiment (Fig. 5) direct desorption took place.
These considerations motivated the study of the KH + Mg(NH2)2 system, performing an in situ experiment under the same conditions used for studying the KNH2 + MgH2 system, to clarify the reaction mechanism underlying the Mg(NH2)2–KH interaction (Fig. 8).
According to the study of Wang et al.35 when KH and Mg(NH2)2 are heated at 2 °C min−1 under static vacuum conditions they react together as follows (reactions (12) and (13))
3Mg(NH2)2 + 2KH ![[left over right harpoons]](https://www.rsc.org/images/entities/char_21cb.gif) K2Mg(NH2)4 + 2MgNH + 2H2 K2Mg(NH2)4 + 2MgNH + 2H2 | (12) |
K2Mg(NH2)4 + 2MgNH + KH ![[left over right harpoons]](https://www.rsc.org/images/entities/char_21cb.gif) 3KMgNH2NH + H2 3KMgNH2NH + H2 | (13) |
Mg(NH2)2 + KH ![[left over right harpoons]](https://www.rsc.org/images/entities/char_21cb.gif) KMgNH2NH + H2 KMgNH2NH + H2 | (14) |
Indeed the expansion of KH is linear in the low temperature region as displayed in Fig. 9, but above 100 °C a fast expansion takes place; at the same time a fast contraction occurs for the KNH2-like structure. Again an exchange mechanism of hydride/amide anions in the lattice is most probably taking place: the trend of the cell parameters displayed in Fig. 9 clearly shows the lattice of the KH-like structure expanding and that of the KNH2-like structure contracting until they reach similar dimensions.
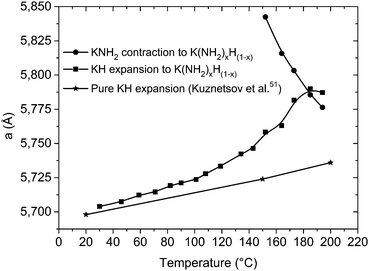 | ||
| Fig. 9 Variation of the cell parameter “a” for the cubic phases involved in the desorption process, plotted as a function of the temperature. Data from Kuznetsov et al.51 were reported for comparison: above 100 °C the expansion diverged from linearity, and another cubic phase is formed. “KNH2” and “KH” stay here for a simplification of the amide-rich (x > 0.5) and hydride-rich (x < 0.5) cubic structures, respectively, with general stoichiometry K(NH2)xH(1−x). | ||
The amide anions necessary for the formation of the KNH2-like structure could only come from a reaction between KH and Mg(NH2)2, by direct exchange or NH3-mediated mechanism, as shown in Fig. 10. No other crystalline Mg co-products were identified, but only an increasing diffuse scattering which supports the formation of an amorphous Mg–N–H product during desorption (Fig. 8, patterns 40–50). Indeed, the formation of an amorphous phase was already observed in structural studies of magnesium amide–magnesium imide phases.47,69
Above 200 °C Mg(NH2)2 and the potassium-containing structures react forming KMgNH2NH (Fig. 8a).
The absence of molten phases was confirmed by ex situ XRD collected at room temperature, proving KMgNH2NH to be the only final product (Fig. 7c). The hydrogen desorption started at temperatures as low as 100 °C and occurred in a one-step event, with a total capacity of about 2 wt% (Fig. 11a) and essentially only hydrogen was released (Fig. 11b) in agreement with literature data.35
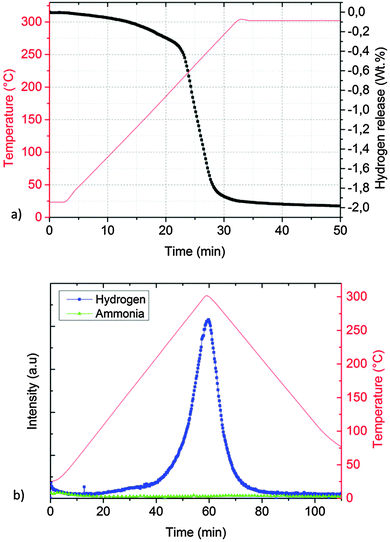 | ||
| Fig. 11 Manometric measurement (a) and TD-MS measurement (b) performed on the KH + Mg(NH2)2 system (sample C). | ||
Our in situ experiments suggest that the formation of K(NH2)xH(1−x) is a necessary step for hydrogen release for both the KNH2 + MgH2 and KH + Mg(NH2)2 systems. However for the KH + Mg(NH2)2 system desorption started to take place at really low temperatures (<100 °C). Since similar conditions were used for the sample preparation and desorption, this result indicates that K(NH2)xH(1−x) was more easily formed from the interaction of KH at the interface with Mg(NH2)2 rather than at the KNH2–MgH2 interface. This may depend on different structural properties of the phases and on the intrinsic activation energy of the two chemical processes. However, for solid state heterogeneous kinetics, part of the activation energy arises from mass transport processes, which are dependent on the particle size, defects in the crystal structures and other parameters which are difficult to tune for a systematic study. The importance of the interface reaction between Mg(NH2)2 and KH in lowering the desorption temperature of the Mg(NH2)2 + 1.9LiH + 0.1KH mixture was reported in a previous study.32 In the current work we propose that by improving the exchange of amide/hydride anions (which is essential for the hydrogen release) the formation of K(NH2)xH(1−x) phases helps to overcome the kinetic barrier for the interface reaction. These considerations suggest that additives with similar reactivity and structural properties may also be good candidates for the Mg(NH2)2 + 2LiH system. To the best of our knowledge, some amide/borohydride solid solutions were previously found70–72 but the present work reports the first amide/hydride solid solution.
K(NH2)xH(1−x) is also the reaction intermediate in the formation of KNH2 by the reaction of ammonia with potassium hydride, when the reaction is promoted either by thermal59 or mechanochemical input (ESI† – Fig. S3). Most probably ammonia reacts with the metal hydride at the surface of the particles forming amide anions and hydrogen as already shown in Fig. 10b; then, due to their solubility, amide anions can migrate in the bulk exchanging with hydride anions which further react with ammonia according to reaction (15). This is one of the possible reasons for the higher reactivity with NH3 for KH compared to MgH2.
| KH + xNH3 → K(NH2)xH(1−x) + xH2 | (15) |
Conclusions
The reactivity of a KH and MgH2 mixture in the amide formation process under ammonia was studied. The reaction pathway of K–Mg–N–H systems was elucidated and it was rejected the formation of crystalline K2Mg(NH2)2(NH), K2Mg(NH)2 and KMgN that were hypothesized in the literature as reaction intermediates. KMgNH2NH and Mg3N2 were shown to be the main product components instead. In situ synchrotron radiation powder X-ray diffraction experiments revealed the structure modifications of potassium hydride–magnesium amide and potassium amide–magnesium hydride systems. For the first time a potassium-amide–hydride solid solution was proved to be a common intermediate of these systems playing a key role in the desorption processes and to be also involved in the synthesis of KNH2. Based on the reported results, a new reaction mechanism for the interaction of KH with Mg(NH2)2 was proposed, involving an exchange of hydride and amide anions between the two phases. The results may help to improve the understanding of the structural modifications promoted by K-based additives at the first stage of the interface reaction with Mg(NH2)2.Acknowledgements
The research leading to these results has received funding from the European Marie Curie Actions under ECOSTORE grant agreement no. 607040.Notes and references
- J. H. Wang, H. W. Li and P. Chen, MRS Bull., 2013, 38, 480–487 CrossRef CAS.
- A. W. Titherley, J. Chem. Soc., Trans., 1894, 65, 504–522 RSC.
- F. W. Dafert and R. Miklauz, Monatsh. Chem., 1910, 31, 981–996 CrossRef.
- P. Chen, Z. Xiong, J. Luo, J. Lin and K. L. Tan, Nature, 2002, 420, 302–304 CrossRef CAS PubMed.
- U. Bosenberg, S. Doppiu, L. Mosegaard, G. Barkhordarian, N. Eigen, A. Borgschulte, T. R. Jensen, Y. Cerenius, O. Gutfleisch, T. Klassen, M. Dornheim and R. Bormann, Acta Mater., 2007, 55, 3951–3958 CrossRef.
- E. Deprez, A. Justo, T. C. Rojas, C. Lopez-Cartes, C. B. Minella, U. Bosenberg, M. Dornheim, R. Borrnann and A. Fernandez, Acta Mater., 2010, 58, 5683–5694 CrossRef CAS.
- J. J. Reilly and R. H. Wiswall, Ber. Bunsen-Ges., 1972, 76, 756 Search PubMed.
- G. Barkhordarian, T. Klassen, M. Dornheim and R. Bormann, J. Alloys Compd., 2007, 440, L18–L21 CrossRef CAS.
- S. Garroni, C. Milanese, A. Girella, A. Marini, G. Mulas, E. Menendez, C. Pistidda, M. Dornheim, S. Surinach and M. D. Baro, Int. J. Hydrogen Energy, 2010, 35, 5434–5441 CrossRef CAS.
- S. Garroni, C. B. Minella, D. Pottmaier, C. Pistidda, C. Milanese, A. Marini, S. Enzo, G. Mulas, M. Dornheim, M. Baricco, O. Gutfleisch, S. Surinach and M. D. Baro, Int. J. Hydrogen Energy, 2013, 38, 2363–2369 CrossRef CAS.
- C. Pistidda, E. Napolitano, D. Pottmaier, M. Dornheim, T. Klassen, M. Baricco and S. Enzo, Int. J. Hydrogen Energy, 2013, 38, 10479–10484 CrossRef CAS.
- C. Pistidda, D. Pottmaier, F. Karimi, S. Garroni, A. Rzeszutek, M. Tolkiehn, M. Fichtner, W. Lohstroh, M. Baricco, T. Klassen and M. Dornheim, Int. J. Hydrogen Energy, 2014, 39, 5030–5036 CrossRef CAS.
- D. Pottmaier, C. Pistidda, E. Groppo, S. Bordiga, G. Spoto, M. Dornheim and M. Baricco, Int. J. Hydrogen Energy, 2011, 36, 7891–7896 CrossRef CAS.
- G. Barkhordarian, T. R. Jensen, S. Doppiu, U. Bosenberg, A. Borgschulte, R. Gremaud, Y. Cerenius, M. Dornheim, T. Klassen and R. Bormann, J. Phys. Chem. C, 2008, 112, 2743–2749 CAS.
- S. Garroni, C. Milanese, D. Pottmaier, G. Mulas, P. Nolis, A. Girella, R. Caputo, D. Olid, F. Teixdor, M. Baricco, A. Marini, S. Surinach and M. D. Baro, J. Phys. Chem. C, 2011, 115, 16664–16671 CAS.
- C. B. Minella, S. Garroni, D. Olid, F. Teixidor, C. Pistidda, I. Lindemann, O. Gutfleisch, M. D. Baro, R. Bormann, T. Klassen and M. Dornheim, J. Phys. Chem. C, 2011, 115, 18010–18014 Search PubMed.
- C. Pistidda, S. Garroni, C. B. Minella, F. Dolci, T. R. Jensen, P. Nolis, U. Bosenberg, Y. Cerenius, W. Lohstroh, M. Fichtner, M. D. Baro, R. Bormann and M. Dornheim, J. Phys. Chem. C, 2010, 114, 21816–21823 CAS.
- C. Pistidda, F. Karimi, S. Garroni, A. Rzeszutek, C. B. Minella, C. Milanese, T. T. Le, L. H. Rude, J. Skibsted, T. R. Jensen, C. Horstmann, C. Gundlach, M. Tolkiehn, P. K. Pranzas, A. Schreyer, T. Klassen and M. Dornheim, J. Phys. Chem. C, 2014, 118, 28409–28417 CAS.
- C. C. Nwakwuo, C. Pistidda, M. Dornheim, J. L. Hutchison and J. M. Sykes, Scr. Mater., 2011, 64, 351–354 CrossRef CAS.
- C. Pistidda, G. Barkhordarian, A. Rzeszutek, S. Garroni, C. B. Minella, M. D. Baro, P. Nolis, R. Bormann, T. Klassen and M. Dornheim, Scr. Mater., 2011, 64, 1035–1038 CrossRef CAS.
- J. J. Vajo and G. L. Olson, Scr. Mater., 2007, 56, 829–834 CrossRef CAS.
- F. Karimi, P. K. Pranzas, A. Hoell, U. Vainio, E. Welter, V. S. Raghuwanshi, C. Pistidda, M. Dornheim, T. Klassen and A. Schreyer, J. Appl. Crystallogr., 2014, 47, 67–75 CrossRef CAS.
- W. F. Luo, J. Alloys Compd., 2004, 381, 284–287 CrossRef CAS.
- Z. T. Xiong, G. T. Wu, H. J. Hu and P. Chen, Adv. Mater., 2004, 16, 1522–1525 CrossRef CAS.
- W. Luo and E. Ronnebro, J. Alloys Compd., 2005, 404, 392–395 CrossRef.
- Z. T. Xiong, J. J. Hu, G. T. Wu, P. Chen, W. F. Luo, K. Gross and J. Wang, J. Alloys Compd., 2005, 398, 235–239 CrossRef CAS.
- W. I. F. David, Faraday Discuss., 2011, 151, 399–414 RSC.
- M. Sale, C. Pistidda, A. Taras, E. Napolitano, C. Milanese, F. Karimi, M. Dornheim, S. Garroni, S. Enzo and G. Mulas, J. Alloys Compd., 2013, 580, S278–S281 CrossRef CAS.
- J. Wang, T. Liu, G. Wu, W. Li, Y. Liu, C. M. Araujo, R. H. Scheicher, A. Blomqvist, R. Ahuja, Z. Xiong, P. Yang, M. Gao, H. Pan and P. Chen, Angew. Chem., 2009, 48, 5828–5832 CrossRef CAS PubMed.
- T. Durojaiye, J. Hayes and A. Goudy, Int. J. Hydrogen Energy, 2015, 40, 2266–2273 CrossRef CAS.
- W. Luo, V. Stavila and L. E. Klebanoff, Int. J. Hydrogen Energy, 2012, 37, 6646–6652 CrossRef CAS.
- J. Wang, P. Chen, H. Pan, Z. Xiong, M. Gao, G. Wu, C. Liang, C. Li, B. Li and J. Wang, ChemSusChem, 2013, 6, 2181–2189 CrossRef CAS PubMed.
- C. Liang, Y. Liu, M. Gao and H. Pan, J. Mater. Chem. A, 2013, 1, 5031–5036 CAS.
- Y. Liu, C. Li, B. Li, M. Gao and H. Pan, J. Phys. Chem. C, 2013, 117, 866–875 CAS.
- J. H. Wang, G. T. Wu, Y. S. Chua, J. P. Guo, Z. T. Xiong, Y. Zhang, M. X. Gao, H. G. Pan and P. Chen, ChemSusChem, 2011, 4, 1622–1628 CrossRef CAS PubMed.
- P. Palvadeau and J. Rouxel, C. R. Seances Acad. Sci., Ser. C, 1968, 266, 1605–1607 CAS.
- P. Palvadeau and J. Rouxel, Bull. Soc. Chim. Fr., 1970, 2, 480–485 Search PubMed.
- E. Napolitano, F. Dolci, R. Campesi, C. Pistidda, M. Hoelzel, P. Moretto and S. Enzo, Int. J. Hydrogen Energy, 2014, 39, 868–876 CrossRef CAS.
- Y. Cerenius, K. Stahl, L. A. Svensson, T. Ursby, A. Oskarsson, J. Albertsson and A. Liljas, J. Synchrotron Radiat., 2000, 7, 203–208 CrossRef CAS PubMed.
- U. Bösenberg, C. Pistidda, M. Tolkiehn, N. Busch, I. Saldan, K. Suarez-Alcantara, A. Arendarska, T. Klassen and M. Dornheim, Int. J. Hydrogen Energy, 2014, 39, 9899–9903 CrossRef.
- A. P. Hammersley, S. O. Svensson, M. Hanfland, A. N. Fitch and D. Hausermann, High Pressure Res., 1996, 14, 235–248 CrossRef.
- E. Seifert, J. Chem. Inf. Model., 2014, 54, 1552 CrossRef CAS PubMed.
- L. Lutterotti, S. Matthies, H. R. Wenk, A. S. Schultz and J. W. Richardson, J. Appl. Phys., 1997, 81, 594–600 CrossRef CAS.
- H. R. Wenk, L. Lutterotti and S. C. Vogel, Powder Diffr., 2010, 25, 283–296 CrossRef CAS.
- H. M. Rietveld, J. Appl. Crystallogr., 1969, 2, 65–71 CrossRef CAS.
- H. M. Rietveld, Acta Crystallogr., 1967, 22, 151–152 CrossRef CAS.
- F. Dolci, E. Napolitano, E. Weidner, S. Enzo, P. Moretto, M. Brunelli, T. Hansen, M. Fichtner and W. Lohstroh, Inorg. Chem., 2011, 50, 1116–1122 CrossRef CAS PubMed.
- H. Jacobs and E. Von Osten, Z. Naturforsch., 1976, 31b, 385–386 CAS.
- R. Juza, H. Jacobs and W. Klose, Z. Anorg. Allg. Chem., 1965, 338, 171–178 CrossRef CAS.
- R. Juza and H. Liedtke, Z. Anorg. Allg. Chem., 1957, 290, 205–208 CrossRef CAS.
- V. G. Kuznetsov and M. M. Shkrabkina, J. Struct. Chem., 1962, 3, 532–537 CrossRef.
- H. Jacobs, Z. Anorg. Allg. Chem., 1971, 382, 97–109 CrossRef CAS.
- F. H. Ellinger, C. E. Holley, B. B. McInteer, D. Pavone, R. M. Potter, E. Staritzky and W. H. Zachariasen, J. Am. Chem. Soc., 1955, 77, 2647–2648 CrossRef CAS.
- J. David, Y. Laurent and J. Lang, Bull. Soc. Fr. Mineral. Cristallogr., 1971, 94, 340–346 CAS.
- E. A. Owen, L. Pickup and I. O. Roberts, Z. Kristallogr. – Cryst. Mater., 1935, 91, 70–76 CAS.
- H. Jacobs, J. Birkenbeul and J. Kockelkorn, J. Less-Common Met., 1984, 97, 205–214 CrossRef CAS.
- C. S. Barrett, Acta Crystallogr., 1956, 9, 671–677 CrossRef CAS.
- K. Momma and F. Izumi, J. Appl. Crystallogr., 2011, 44, 1272–1276 CrossRef CAS.
- C. Pistidda, A. Santoru, S. Garroni, N. Bergemann, A. Rzeszutek, C. Horstmann, D. Thomas, T. Klassen and M. Dornheim, J. Phys. Chem. C, 2015, 119, 934–943 CAS.
- A. K. Cheetham and A. P. Wilkinson, Angew. Chem., Int. Ed., 1992, 31, 1557–1570 CrossRef.
- H. Cao, Y. Zhang, J. Wang, Z. Xiong, G. Wu and P. Chen, Progress in Natural Science: Materials International, 2012, 22, 550–560 CrossRef.
- Y. Nakamori, G. Kitahara and S. Orimo, J. Power Sources, 2004, 138, 309–312 CrossRef CAS.
- W. I. F. David, M. O. Jones, D. H. Gregory, C. M. Jewell, S. R. Johnson, A. Walton and P. P. Edwards, J. Am. Chem. Soc., 2007, 129, 1594–1601 CrossRef CAS PubMed.
- J. W. Makepeace, M. O. Jones, S. K. Callear, P. P. Edwards and W. I. F. David, Phys. Chem. Chem. Phys., 2014, 16, 4061–4070 RSC.
- CRC Handbook of Chemistry and Physics, 91st edn, 2010.
- L. M. Arnbjerg and T. R. Jensen, Int. J. Hydrogen Energy, 2012, 37, 345–356 CrossRef CAS.
- J. J. Hu, Z. T. Xiong, G. T. Wu, P. Chen, K. Murata and K. Sakata, J. Power Sources, 2006, 159, 120–125 CrossRef CAS.
- G. Aylward and T. Findlay, Thermodynamic database: SI chemical data, 4th edn, 1998 Search PubMed.
- U. Ash-Kurlander, G. E. Shter, S. Kababya, A. Schmidt and G. S. Grader, J. Phys. Chem. C, 2013, 117, 1237–1246 CAS.
- T. Noritake, M. Aoki, S. Towata, A. Ninomiya, Y. Nakamori and S. Orimo, Appl. Phys. A: Mater. Sci. Process., 2006, 83, 277–279 CrossRef CAS.
- H. Wu, W. Zhou, T. J. Udovic, J. J. Rush and T. Yildirim, Chem. Mater., 2008, 20, 1245–1247 CrossRef CAS.
- P. A. Chater, W. I. F. David, S. R. Johnson, P. P. Edwards and P. A. Anderson, Chem. Commun., 2006, 2439–2441, 10.1039/B518243C.
Footnote |
| † Electronic supplementary information (ESI) available: Additional diffractograms for the characterization of the reaction products and intermediates. DSC trace of K2Mg(NH2)4. See DOI: 10.1039/c5cp06963g |
| This journal is © the Owner Societies 2016 |





![[3 with combining macron]](https://www.rsc.org/images/entities/char_0033_0304.gif)


