
 Open Access Article
 This Open Access Article is licensed under a
 Creative Commons Attribution 3.0 Unported Licence
Methanol synthesis via CO2 hydrogenation over a Au/ZnO catalyst: an isotope labelling study on the role of CO in the reaction process†
Yeusy
Hartadi
,
Daniel
Widmann
and
R. Jürgen
Behm
*
Institute of Surface Chemistry and Catalysis, Ulm University, Albert-Einstein-Allee 47, D-89081 Ulm, Germany. E-mail: juergen.behm@uni-ulm.de
First published on 15th February 2016
Abstract
Methanol synthesis for chemical energy storage, via hydrogenation of CO2 with H2 produced by renewable energies, is usually accompanied by the undesired formation of CO via the reverse water–gas shift reaction. Aiming at a better mechanistic understanding of methanol formation from CO2/H2 on highly selective supported Au/ZnO catalysts we have investigated the role of CO in the reaction process using isotope labelling experiments. Using 13C-labelled CO2, we found for reaction at 5 bar and 240 °C that (i) the methanol formation rate is significantly higher in CO2-containing gas mixtures than in a CO2-free mixture and (ii) in mixtures containing both CO2 and CO methanol formation from CO increases with the CO content up to 1% CO, and then remains at 20% of the total methanol formation up to a CO2/CO ratio of 1/1, making CO2 the preferred carbon source in these mixtures. A shift in the preferred carbon source for MeOH from CO2 towards CO is observed with increasing reaction temperatures between 240 °C and 300 °C. At even higher temperatures CO is expected to become the dominant carbon source. The consequences of these findings for the application of Au/ZnO catalysts for chemical storage of renewable energies are discussed.
1. Introduction
A promising approach in renewable energy concepts to overcome natural fluctuations in the supply of renewable energy involves the conversion and storage of excess electrical energy in the form of chemical energy.1,2 Methanol (MeOH) as a storage molecule is of particular interest, since it can be easily stored and transported.3,4 It can be used as a source of CO2-neutral synthetic fuels5 or as feedstock for synthesis of a variety of basic materials.4,6 At present MeOH is mainly produced from syngas containing CO, CO2 and H2, which is obtained from catalytic reforming of fossil fuels.6 However, by replacing fossil fuels as the carbon source with anthropogenic CO2 from industrial exhaust or coal power plants,7–11 for example, so-called “green MeOH” can be produced.12–17 This way also the overall CO2 emission can be diminished.7–17 Technically this process was applied first in the ‘Emission-to-Liquid’ (ETL) technology developed by Carbon Recycling International (CRI), which since 2011 has been operating the commercial George Olah Renewable Methanol Plant with a production capacity of 5 million liters per year.13,18In the industrial MeOH production from CO2-enriched syngas typically Cu/ZnO + MeOx catalysts are employed.6 These have been optimized to a very high performance level under industrial relevant reaction conditions (at elevated temperatures and pressures) because of the enormous importance of industrial MeOH production.19–28 Accordingly, one may assume that it is also a reasonable, highly active candidate for CO2 hydrogenation for the above described application. MeOH formation from CO2, however, is usually accompanied by the undesirable formation of CO via the reverse water-gas shift (RWGS) reaction.16,29–33 Thus, besides high MeOH formation rates, the selectivity towards MeOH formation represents another crucial factor that has to be considered. So far only a very limited number of catalytic systems is known, which show no or almost no activity for the CO formation in CO2/H2 reaction gas mixtures for MeOH formation, for example, differently promoted Cu-based catalysts,34–36 Au and Ag supported on 3ZnO·ZrO2,35 carbon nanotubes supported Pd–ZnO catalysts,37 or a pre-reduced LaCr0.5Cu0.5O3 catalyst.38 Previous studies on commercial Cu-based catalysts have shown that these are active for the reverse water-gas shift (RWGS) reaction between 230 and 260 °C, resulting in the formation of rather large amounts of CO in addition to MeOH and, hence, rather low selectivities towards MeOH.31,32,39–42 For example, testing the activity and selectivity of two commercial Cu/ZnO/Al2O3 catalyst samples at total pressures between 5 and 50 bar (CO2/H2 = 1/3), we recently obtained selectivities towards MeOH of only 16% and 42%, respectively.31 Some supported Au catalysts, on the other hand, are significantly more selective compared to the commercial Cu-based catalysts under identical reaction conditions.31,32 This is particularly true for Au/ZnO.31,32 While their noble metal mass-normalized activity for MeOH is comparable to that of Cu catalysts, their selectivity is much higher, about 50% at 5 bar and almost 70% at 50 bar.31,32 A more detailed comparison of the catalytic performance (activities and selectivities) over commercial Cu- and Au-based catalysts is given in ref. 31 and 32. At present, the much higher price of gold compared to that of Cu renders CO2 hydrogenation to MeOH on supported Au catalysts economically not competitive, but these previous findings clearly demonstrated their promising potential for certain applications, e.g., for small scale operation under dynamic operation conditions, as expected in renewable energy concepts.31 They are also very interesting from a scientific point of view, to understand the origin of the high activity and selectivity of Au/ZnO catalysts for CO2 hydrogenation to MeOH. Here it is worth mentioning that for both Au- and Cu-based catalysts the presence of Zn species seems to be mandatory in order to achieve high MeOH formation rates as well as selectivities.15,31,43 This suggests that Au/ZnO and Cu/ZnO benefit from the same effect, namely the partial reduction of ZnO under reaction conditions in the highly reductive atmosphere and subsequent migration of ZnOx surface species on the Au or Cu nanoparticles, resulting either in the formation of a AuZn or CuZn (surface) alloy, or the formation of a ZnOx shell.15,43–47 While for Cu-based catalysts the formation of such species and their contribution in the reaction mechanism of CO hydrogenation and CO2 hydrogenation to MeOH was already demonstrated,15,43–47 similar information on Au/ZnO catalysts is scarce so far.31 Nevertheless, it may be envisioned that such effects are also present on Au surfaces, which can thus explain the superior catalytic performance of Au/ZnO for the MeOH formation from CO2 and H2 as compared to other metal oxide supported Au catalysts.31 Interestingly, Martin et al. just recently demonstrated the promotion of Cu–ZnO–Al2O3 catalysts for the MeOH formation by addition of gold, which they explained by a stabilization of metallic Cu0 species in close vicinity to ZnOx.36
Although Au/ZnO catalysts predominantly produce MeOH, there will always be significant amounts of CO present in the reaction atmosphere because of its formation via the reverse water-gas shift reaction. In particular this is the case at the end of the catalyst bed in practical applications, which aim at high CO2 conversions. Hence, there will be an increasing CO partial pressure along the catalyst bed. In order to minimize any detrimental effects of CO on the main reaction, a detailed understanding of its influence is essential. Recently we reported on the influence of CO on the MeOH formation characteristics in the presence of low and high CO partial pressures. Based on the significantly higher activities for MeOH formation from pure CO2/H2 mixtures than obtained upon addition of CO to the reaction gas feed, we proposed that CO2 is not converted to CO first, via the RWGS reaction (eqn (1)), which is subsequently hydrogenated to MeOH (eqn (2)), but is directly hydrogenated to MeOH (eqn (3)).32
| CO2 + H2 → CO + H2O | (1) |
| CO + 2H2 → CH3OH | (2) |
| CO2 + 3H2 → CH3OH + H2O | (3) |
This is the topic of the present study, in which we explored the activities of a Au/ZnO catalyst for CO and CO2 hydrogenation in a gas mixture containing both components, CO2 and CO, together with H2 by isotope labelling techniques. By adding well-defined amounts of 12CO (between 0.5 and 15%) to a reaction gas mixture containing 15% 13CO2 (CO2/H2 = 1/3) and following the corresponding changes in the amounts of 13CH3OH and 12CH3OH formation, we could quantify the individual contributions of 13CO2 and 12CO to the total amount of MeOH formed. Besides, one can also derive insights into the reaction pathway for CO2 and CO hydrogenation from such studies, in particular whether CO2 is directly hydrogenated to MeOH or whether it is first converted to CO, which is subsequently hydrogenated.
In contrast to Cu-based catalysts, where a number of previous studies presented ample evidence that the main carbon source for MeOH from synthesis gas containing both CO2 and CO is CO2, e.g., by kinetic investigations,48,49 isotope labelling measurements45,48,50–52 and theoretical calculations,29 direct information to resolve this question for Au catalysts is not yet available.
In the following, we will, after a short summary of the physical properties of the commercial Au/ZnO catalyst used in this study (Section 3.1), present the results of the kinetic isotope labelling measurements using 13C labelled CO2 and 12CO (Section 3.2). The influence of the reaction temperature, upon increasing it from 240 °C to 300 °C for a fixed ratio of 13CO2/12CO, is elucidated and discussed in Section 3.3. In addition to mechanistic insights we finally discuss the consequences of these findings for potential applications of Au/ZnO catalysts for the chemical storage of renewable energies.
2. Experimental
2.1. Preparation and characterization of Au/ZnO
For all measurements we used a commercially available Au/ZnO catalyst prepared by deposition precipitation (DP) from STREM Chemicals. Prior to the kinetic measurements, the catalyst was calcined in situ in a flow of 20 Nml min−1 of 1% O2 in Ar at 400 °C and atmospheric pressure for 1 h (denoted O400). Subsequently, the catalyst was cooled to the reaction temperature (240 °C) in a flow of Ar. The Au loading, the Au particle size and the surface area of the Au/ZnO catalyst after O400 were measured by inductively coupled plasma optical emission spectroscopy (ICP-OES, Horiba Jovin Yvon Ultima 2), transmission electron microscopy (TEM, JEOL 1400) and low temperature N2 adsorption (BET, Quantachrome Quadrasorb SI), respectively. Based on the Au particle size distribution obtained from the TEM images, the volume–area mean diameter as well as the Au dispersion were calculated. For calculation of the latter we assumed hemispherical Au nanoparticles with 1.15 × 1015 cm−2 Au surface atoms.2.2. Kinetic measurements
Kinetic measurements were performed at 5 bar total pressure and at a reaction temperature of 240 °C under differential reaction conditions in a glass-lined stainless steel tube micro reactor (inner diameter 4 mm). The lower pressure of 5 bar compared to previous kinetic measurements at 50 bar32 was chosen to keep the consumption of expensive 13CO2 at a tolerable level. Note that the total conversions of CO2 and CO (1% at the most in all kinetic experiments) were significantly below the maximum conversion given by the thermodynamic equilibrium, which is at approximately 15% and 8% for CO2 (to both MeOH and CO) and CO (to MeOH) hydrogenation, respectively, under present reaction conditions. For all measurements we used about 200 mg of pure Au/ZnO catalyst powder, which was fixed in the center of the micro reactor using quartz wool plugs on either side. This results in a catalyst bed length of about 2 cm. High purity reaction gases were supplied by Westfalen (H2 5.0, Ar 5.0 and CO 4.7) and Campro Scientific (13CO2, 99 atom% 13C). The gases were mixed by mass flow controllers (Brooks Instrument SLA5850) in order to realize the desired reaction gas composition. A backpressure controller (Tescom ER5000) was used in order to regulate the pressure in the reactor. After calcination and subsequent cooling down to the reaction temperature of 240 °C in Ar at atmospheric pressure (see Section 2.1), the pressure in the reactor was increased to the reaction pressure (5 bar) in a flow of the reaction gas mixture.In the kinetic measurements, the freshly calcined catalyst sample was first exposed to a 13CO2/H2 mixture until a steady-state was reached (15% 13CO2, 45% H2, balance Ar; 30 Nml min−1). This usually took approximately 100 minutes. Afterwards, different amounts of 12CO (between 0.5 and 15%) were stepwise added to the 13CO2/H2 gas mixture by gradually replacing Ar while keeping the 13CO2/H2 ratio constant at 1/3 (15% 13CO2/45% H2/0.5–15% 12CO/balance Ar). Finally, the activity was measured once again in the presence of only 13CO2 in order to check for possible changes of the catalyst performance upon reaction in CO containing reaction atmospheres.
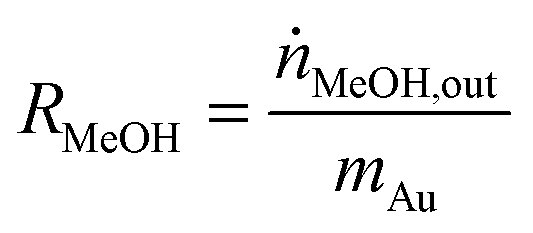
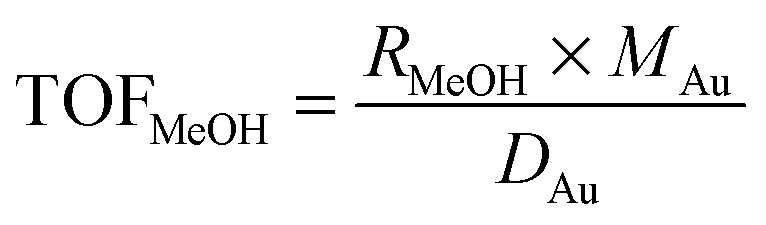
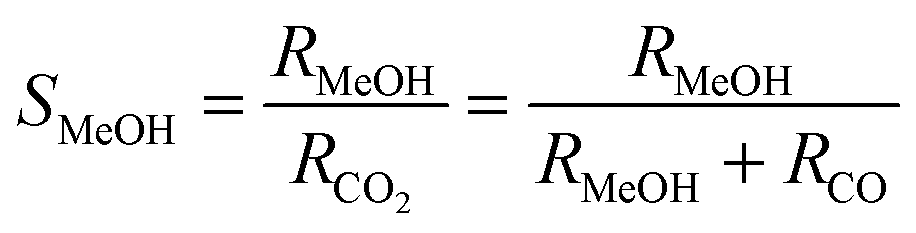
The influent and effluent gases were analyzed by mass spectrometry (Pfeiffer Vacuum HiQuad QMG 700). In all measurements masses 18, 28, 29, 31, 32, 44 and 45 were monitored. MeOH was identified via masses 31 and 32, which represent the strongest signals for MeOH containing 12C and 13C, respectively. Based on the molar flow rate of MeOH formed under differential reaction conditions (ṅMeOH,out/CO2 and CO conversions ≤1%) and the absolute amount of Au metal (mAu), the Au mass-normalized MeOH formation rates (RMeOH) were calculated according to eqn (4). Turnover frequencies (TOFs) were calculated based on these Au mass-normalized reaction rates, the molar mass of Au (MAu), and the Au dispersion (DAu, obtained from TEM imaging) following eqn (5). Please note that these are normalized to the absolute amount of Au surface atoms rather than to the active site(s) for MeOH formation, which are not known for Au/ZnO catalysts so far. The selectivity for MeOH formation (SMeOH) is defined as the ratio of the MeOH formation rate to the overall CO2 hydrogenation rate (to MeOH and CO, see eqn (6)).
 | (4) |
 | (5) |
 | (6) |
Calibration on an absolute scale was realized by comparison with the signal of a test gas containing a well-defined amount (partial pressure) of MeOH, and secondly by a direct comparison between GC and MS measurements under various reaction conditions (with different MeOH formation rates) during the CO2 hydrogenation on Au/ZnO. Additionally, an isotopic exchange between 13CO2 and 12CO was separately determined over the Au/ZnO catalyst under identical reaction conditions (same temperature, pressure and space velocity as during the reaction), and was found to be negligible under present reaction conditions.
3. Results and discussion
3.1. Catalyst characterization
The Au loading of the Au/ZnO catalyst was determined by inductively coupled plasma optical emission spectroscopy (ICP-OES) and amounts to 1.0 wt%. TEM images of the sample after O400 pretreatment revealed an even distribution of the Au nanoparticles on the ZnO support. A representative TEM image of the Au/ZnO catalyst after O400 pre-treatment as well as the corresponding Au particle size distribution, which is obtained from the evaluation of more than 400 Au particles, are shown in Fig. 1. From the Au particle size distribution the volume–area mean diameter of the Au particles was determined to be 2.4 ± 0.4 nm, corresponding to a Au dispersion of 48.5%. The surface area of the Au/ZnO catalyst after calcination was 42 m2 g−1 (measured by low temperature N2 adsorption). A summary of the physical properties of the freshly calcined Au/ZnO catalyst is given in Table 1.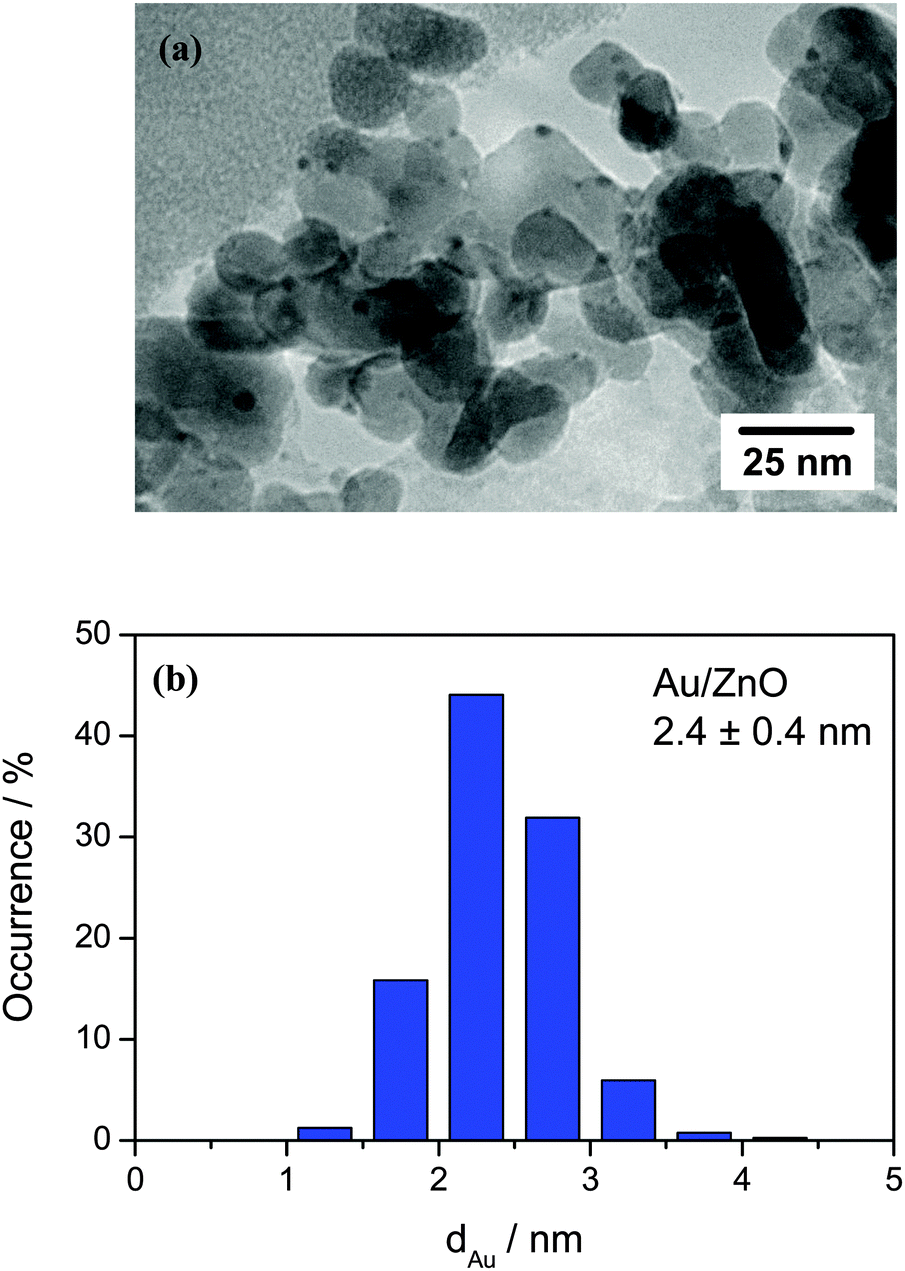 | ||
| Fig. 1 (a) Representative TEM image of the Au/ZnO catalyst after calcination in 1% O2/Ar at 400 °C and at atmospheric pressure for 1 h (O400) and (b) the corresponding particle size distribution. | ||
Note that we demonstrated already in a previous study that the changes in the average Au particle size and size distribution as well as the surface area of the Au/ZnO catalyst during its exposure to reaction conditions are negligible.32
3.2. MeOH formation from 13CO2 and 12CO
We will first focus on the overall MeOH formation rates during the CO and CO2 hydrogenation in CO/H2 and CO2/H2 reaction gas mixtures, respectively, at 5 bar and 240 °C. For the CO2/H2 reaction gas mixture we also additionally measured the influence of CO addition on the overall MeOH formation rate. Such data had been measured before, but only at a total pressure of 50 bar.32 Time dependent turnover frequencies (TOFs) of MeOH formation during CO hydrogenation (15% CO, 45% H2, balance Ar) and CO2 hydrogenation (15% CO2, 45% H2, balance Ar) on a freshly pre-treated Au/ZnO catalyst (O400) are presented in Fig. 2. Obviously, both the reaction characteristics and the MeOH formation rates differ significantly, despite the identical partial pressures of CO and CO2 and, hence, identical C/H ratios. The initial activity (TOF) of Au/ZnO for the (overall) CO2 hydrogenation is ∼5 × 10⁻³ s−1, and it then decreases steadily in an approximately exponential way, until reaching a final activity of 3.4 × 10⁻³ s−1 after 1000 min on stream. Focusing on methanol formation only, the situation is very different. It starts at 1.1 × 10⁻³ s−1 and increases during the initial 70 min to 1.8 × 10⁻³ s−1. Afterwards there is a slight decrease in activity with time on stream (deactivation), which finally results in a TOF of 1.5 × 10⁻³ s−1 after 1000 min, and when almost no more changes in activity are observed. The initial increase in the MeOH formation rate is also reflected by the selectivity towards MeOH formation, which increases over the first 100 min, from ∼25 to ∼40%. For the remaining time, the selectivity continues to increase slowly, to about 45% after 1000 min on stream. These results agree closely with previous findings under similar reaction conditions,32 but differ somewhat from the reaction characteristics of Au/ZnO during CO2 hydrogenation at 50 bar. For the latter case we recently reported that the catalyst is immediately in its most active state, and that there is hardly any deactivation with time on stream.32 | ||
Fig. 2 Time dependent MeOH formation activity (TOF) of the Au/ZnO catalyst (STREM Chemicals) during CO2 hydrogenation ( , 15% CO2/45% H2/balance Ar) and CO hydrogenation ( , 15% CO2/45% H2/balance Ar) and CO hydrogenation ( , 15% CO/45% H2/balance Ar) at 5 bar and 240 °C after calcination in 1% O2/Ar at 20 Nml min−1 and 400 °C for 1 h (O400). For CO2 hydrogenation the activity (TOF) (♦) and selectivity (▲) for MeOH formation are also included. , 15% CO/45% H2/balance Ar) at 5 bar and 240 °C after calcination in 1% O2/Ar at 20 Nml min−1 and 400 °C for 1 h (O400). For CO2 hydrogenation the activity (TOF) (♦) and selectivity (▲) for MeOH formation are also included. | ||
Moving on to the CO hydrogenation, this situation changes significantly. Here the initial activity at 5 bar is close to zero and increases steadily during the reaction, until it reaches its maximum value after about 200 min (TOF 0.8 × 10⁻³ s−1). Subsequently it decreases continuously with time on stream, reaching a steady-state activity of 0.5 × 10⁻³ s−1 after 1000 min. The discrepancy between the initial activity for the CO2 hydrogenation to methanol and the CO hydrogenation (to methanol) already indicated that under present reaction conditions methanol formation from CO2 does not proceed via the formation of CO (by the RWGS reaction) and its subsequent hydrogenation to MeOH, as for the latter reaction the initial activity is close to zero. The present findings for CO hydrogenation at 5 bar and its temporal evolution also differ remarkably from the behavior at 50 bar under otherwise identical conditions.32 In the latter case, we found that the activity is the highest right at the start of the reaction, followed by a continuous slight decrease with time on stream for at least 1000 min.
The difference in the initial phase of the reaction, where we observed an increase in the methanol formation rate for both CO2 hydrogenation and CO hydrogenation for the reaction at 5 bar, while at 50 bar it was about constant, may well be due to an experimental artifact. While for the reaction at 5 bar the first gas sample was taken at about 25 min after changing from bypass to the reaction gas mixture, this delay time was much longer for the reaction at 50 bar, since it took longer to reach steady-state conditions in the reactor gas composition. When the first gas sample was taken at 50 bar, the catalyst was exposed already for more than 1 h to a gas atmosphere which was getting increasingly closer to the final reaction gas composition. In that case it is not surprising that the initial activation observed at 5 bar is not detected for the reaction at 50 bar, but occurs before the first probe is taken. Finally we would like to note that the long term performance of the Au/ZnO catalyst, which is relevant for possible technical applications, is very promising. For the operation at 50 bar we did not find any indication for deactivation over 50 hours on stream.
The comparison of the MeOH formation activities from CO2 and CO under steady-state reaction conditions shows that this is significantly lower, by a factor of about 3, during the CO hydrogenation (3.6 × 10⁻⁶ mol s−1 gAu−1 and 1.2 × 10⁻⁶ mol s−1 gAu−1 for CO2 hydrogenation and for CO hydrogenation, respectively, corresponding to TOFs of 1.5 × 10⁻³ s−1 and 0.5 × 10⁻³ s−1). This trend is consistent with previous results at 50 bar, demonstrating that at both 5 and 50 bar CO2 hydrogenation on Au/ZnO is faster than CO hydrogenation at 240 °C under steady-state conditions.
Next we determined the influence of adding various amounts of CO (0.5–15% CO) to the CO2/H2 reaction gas mixture on the overall MeOH formation rate of Au/ZnO, the corresponding TOFs obtained under steady state conditions are shown in Fig. 3. Evidently, the addition of up to 15% CO has almost no effect on the MeOH formation rate under present reaction conditions. Similar to the reaction in a CO2/H2 mixture, the Au mass-normalized MeOH formation rates in all different CO2/CO/H2 mixtures are about 3.6 × 10⁻⁶ mol s−1 gAu−1, which corresponds to a TOF of 1.5 × 10⁻³ s−1 (Table 2). These MeOH formation rates are also comparable to the value reported previously for the CO2 hydrogenation on the same Au/ZnO catalyst under identical reaction conditions (3.8 × 10⁻⁶ mol s−1 gAu−1, 1.6 × 10⁻³ s−1) at 5 bar and 240 °C.31 Moreover, also the selectivity to MeOH in CO2/H2 mixtures in both studies is almost identical (44% and 48%, respectively). Hence, in spite of the increasing total amount of carbon containing species (CO2 and CO) and the increased C/H ratio, there is no significant increase in the rate of MeOH formation. This indicates that, similar to previous conclusions for the CO2 hydrogenation reaction at 50 bar,32 CO is not an intermediate in the CO2 hydrogenation reaction (eqn (1)). If CO2 is first converted to CO, via the RWGS reaction, and the resulting CO is subsequently hydrogenated to MeOH (eqn (2)), one would expect an increase in the MeOH formation rate with increasing CO content, independent of whether the first reaction step (RWGS of CO2) or the second step (CO hydrogenation) is rate limiting. This is obviously not the case under present reaction conditions. At 50 bar under otherwise identical reaction conditions, the MeOH formation rate even decreased as CO was added to a reaction gas mixture containing CO2 only.32 Hence, in both cases hydrogenation of CO2 and CO seem to proceed via different reaction pathways, which can occur in parallel.
 | ||
| Fig. 3 Steady-state MeOH formation rates (TOFs) during 13CO2 hydrogenation (15% CO2, 45% H2, balance Ar) in the absence and presence of 0.5–15% 12CO as well as during the 12CO hydrogenation (15% CO, 45% H2, balance Ar) on a Au/ZnO catalyst (STREM Chemicals) at 5 bar and 240 °C. | ||
| CO concentration/% | MeOH formation rate/10−6 mol s−1 gAu−1 | MeOH formation TOF/10−3 s−1 | Fraction of MeOH from 13CO2 | Fraction of MeOH from 12CO |
|---|---|---|---|---|
| 0 | 3.6 | 1.5 | 100 | 0 |
| 0.5 | 3.3 | 1.4 | 90 | 10 |
| 1 | 3.5 | 1.5 | 82 | 18 |
| 5 | 3.4 | 1.4 | 83 | 17 |
| 10 | 3.6 | 1.5 | 80 | 20 |
| 15 | 3.6 | 1.5 | 78 | 22 |
| Pure CO | 1.2 | 0.5 | 0 | 100 |
Further information on the effect of CO on the hydrogenation of CO2 was obtained from isotope labelling experiments, determining 12CH3OH and 13CH3OH product formation from 13CO2/12CO/H2 mixtures. This provides direct information on the carbon source for MeOH. The individual contributions of 13CO2 and 12CO to the total amount of MeOH formed at 5 bar and 240 °C with increasing amounts of 12CO added to the 13CO2/H2/Ar mixture are presented in Fig. 4a (see also Table 2). As already described above, the overall MeOH formation rate is essentially the same for all gas mixtures except for CO only. The activity for MeOH formation from CO2, however, slightly decreases upon the addition of 0.5% CO (CO2/CO = 30/1), from 1.5 × 10⁻³ s−1 to 1.2 × 10⁻³ s−1 (Fig. 4b). Obviously, MeOH formation from CO2 is somewhat inhibited by the presence of CO. At the same time, about 10% of the overall MeOH formed originate from CO (TOF = 0.14 × 10⁻³ s−1), although the partial pressure of CO is much lower than that of CO2. Accordingly, the fraction of MeOH from CO2 decreases from 100% (for CO2/H2 only) to 90% in the presence of 0.5% CO (Fig. 4a).
 | ||
| Fig. 4 (a) Ratios of MeOH formation from CO2 and CO, respectively, during 13CO2 hydrogenation (15% CO2, 45% H2, balance Ar) in the absence and presence of 0.5–15% 12CO as well as during the 12CO hydrogenation (15% CO, 45% H2, balance Ar) and (b) the corresponding MeOH formation activities (TOFs) on a Au/ZnO catalyst (STREM Chemicals) at 5 bar and 240 °C. | ||
Upon increasing the CO concentration to 1% (CO2/CO = 15/1) the fraction of MeOH formed from CO2 decreases further to approximately 80%. Hence, up to 1% CO in the reaction gas mixture there is an almost linear decrease/increase in the MeOH formation rate from CO2/CO, respectively. Increasing the CO concentration further to 5% and higher (up to 15%; CO2/CO = 1/1), however, does not result in significant changes in the CO2 and CO contributions to the total MeOH production. For each of the reaction gas mixtures tested (15% CO2, 45% H2, +1%, +5%, +10%, and +15% CO, balance Ar), the fractions of MeOH from CO2 and CO are about 80% and 20%, respectively, (see Table 2). Hence, even for identical partial pressures of CO and CO2 the majority of MeOH formed originates from CO2, clearly indicating that over a wide range of CO2/CO compositions, CO2 is the main carbon source in MeOH formation under present reaction conditions (240 °C, 5 bar). Moreover, there is no further increase in the MeOH formation rate from CO upon increasing the CO concentration to values higher than 1%. This can be most easily explained by a saturation of CO adsorption sites under these conditions, which results in a reaction order for CO close to zero for CO concentrations of 1% and higher. Remarkably, there is also no further inhibition of the CO2 hydrogenation upon CO addition, clearly demonstrating that the main reaction pathway for this reaction is not affected by the increasing presence of CO. This situation, however, is different for the other products formed (MeOH and water), which have been demonstrated to have an inhibiting effect on the MeOH formation rate on Au/ZnO (similar to Cu-based catalysts).32 This is further evidence that the dominant reaction pathways of both reactions, CO2 and CO hydrogenation, proceed parallel to and are independent of each other. This finding agrees well with our previous findings, where we came to similar conclusions regarding the influence of CO on the overall MeOH formation rate for the reaction at 50 bar.32 In that study we had also performed spectroscopic measurements in order to detect differences in the reaction mechanism, e.g., different adsorption sites for CO and CO2, following the formation of adsorbed surface species during CO2 hydrogenation and CO hydrogenation under reaction conditions (240 °C, 5 bar) by diffuse reflectance infrared Fourier transform spectroscopy (DRIFTS).32 From these measurements it was, however, not possible to derive any insights on the adsorption sites for CO or CO2.
It should be noted that although independent of the CO2/CO ratio the majority of MeOH results from CO2 hydrogenation, this does not mean that MeOH formation from CO is little effective. This is illustrated best by the fact that even at a composition of CO2/CO = 15/0.5, about 10% of the resulting MeOH comes from CO hydrogenation, which is significantly more than expected from the composition of the reaction gas (assuming reaction orders of 1 for CO2 and CO). On the other hand, considering the overall objective of our work to efficiently convert CO2 to methanol, it is most important whether the formation of CO does reduce the activity for CO2 hydrogenation to methanol in general, which is hardly the case.
In this sequence of measurements we had not considered so far that the addition of CO to the CO2/H2 mixture at constant CO2 and H2 partial pressures results in increasingly higher C/H ratios than during the initial CO2 hydrogenation (CO2/H2 = 1/3). Since this may hamper the understanding of the effect of CO on the hydrogenation of CO2, we also tested the reaction at a similar C/H ratio of 1/3 (with 45% H2), using a reaction gas mixture of 7.5% 13CO2/7.5% 12CO/45% H2 (balance Ar). Comparable with the reaction in the presence of 15% CO2 and 15% CO, this again results in an equimolar CO2/CO ratio, but this time with a C/H ratio of 1/3, identical to the original gas mixture during CO2 hydrogenation only (15% CO2, 45% H2). In that case the overall MeOH formation rate is slightly lower compared to the carbon rich reaction atmosphere (TOF 1.1 × 10⁻³ s−1), but the fractions of MeOH formed from CO2 and CO (77% and 23%, respectively) are almost identical to the reaction atmosphere with 15% CO2 and 15% CO. Obviously, the ratio of MeOH formed from CO2 and CO does not depend on the C/H ratio under present reaction conditions. This also means that the direct comparison between CO2/H2 and CO2/CO/H2 is possible despite the increasing amount of carbon in the reaction gas feed.
In another additional measurement we also tested for changes in the MeOH formation rate upon increasing the partial pressure of CO2, while keeping the partial pressure of H2 constant. Hence, instead of adding CO we added CO2 to the original reaction gas mixture, which equally results in an increased C/H ratio, similar to the above described experiments (CO2 + CO). The corresponding results are shown in the ESI† (Fig. S1). In this case there is almost no change in the MeOH formation rate, which stays almost constant at about 3.8 × 10⁻⁶ mol s−1 gAu−1. Moreover, there are also no significant changes in the selectivity for MeOH formation, which is in between 44% and 41% for all reaction gas mixtures investigated (15–30% CO2, 45% H2, balance Ar). Hence, similar to the above described findings for CO, all CO2 adsorption sites seem to be blocked in a reaction gas mixture containing 15% CO2, and further addition of CO2 is not beneficial for the MeOH formation rate (zero reaction order for CO2). However, considering the lower MeOH formation rates in the presence of 7.5% CO2 as described above (7.5% CO2, 7.5% CO, 45% H2) one can assume that for the CO2 content lower than 15% CO2 this is not true any longer, and the reaction order for CO2 becomes positive at lower CO2 partial pressures.
Regarding the main source of carbon in the MeOH formation on supported Au catalysts, our findings are also in agreement with an earlier proposal from Sakurai et al., who also claimed that MeOH is mainly formed via the CO2 hydrogenation.53 This conclusion was based on a comparison of the CO2 hydrogenation and CO hydrogenation activities over Au catalysts and, hence, neither in the presence of both reactants simultaneously nor directly by isotope labelling experiments. On the other hand, the results obtained for the Au/ZnO catalyst in this work are similar to the results of previous tracer atom experiments on Cu-based catalysts. First experiments to determine the main source of carbon in MeOH formation from CO2/CO/H2 mixtures on a commercial copper-containing oxide catalyst and on a Cu/ZnO/Al2O3 catalyst were reported by Rozovskii et al. and Chinchen et al., respectively, using 14C-labelled species.48,51 Under conditions similar to those employed industrially, i.e., at 50 bar and temperatures between 180 and 250 °C, both studies arrived at the conclusion that MeOH was predominantly formed from CO2, using reaction mixtures containing 20% CO2/1% CO51 or 10% CO2/10% CO.48 Chinchen et al. additionally also varied the ratio of the partial pressures of CO2 and CO. In that case they found that at higher partial pressures of CO2 (CO2![[thin space (1/6-em)]](https://www.rsc.org/images/entities/char_2009.gif) :CO = 1:2) MeOH was essentially formed from CO2 only, and that MeOH formation from CO occurred only at extremely low levels of CO2 (<100 ppm CO2).48 In another more recent isotope labelling experiment on Cu-based catalysts performed at 30 bar and 230 °C with a gas mixture containing 8% 13CO2/6% CO/59% H2 (balance inert gas), Studt et al. found that more than 90% of the resulting MeOH originated from CO2, both for Cu supported on irreducible MgO, which exhibited a poor MeOH formation rate, and also for Cu on ZnO, which exhibits a high turnover MeOH rate.45 Although the reaction conditions in these studies were markedly different from ours, in particular the total pressure during the reaction, there is nevertheless good agreement on the dominant contribution of CO2 hydrogenation to MeOH, which points to rather similar reaction characteristics on supported Cu and Au catalysts. Similar findings, yet for much lower total pressures, were reported by Yang et al.,52 who observed for the reaction of a 12CO2/13CO/D2 reaction gas mixture (1:1:6) on a Cu/SiO2 catalyst under almost identical reaction conditions (6 bar and 240 °C), that also at much lower pressures than in the studies cited above the majority (78%) of MeOH formed originates from CO2.
:CO = 1:2) MeOH was essentially formed from CO2 only, and that MeOH formation from CO occurred only at extremely low levels of CO2 (<100 ppm CO2).48 In another more recent isotope labelling experiment on Cu-based catalysts performed at 30 bar and 230 °C with a gas mixture containing 8% 13CO2/6% CO/59% H2 (balance inert gas), Studt et al. found that more than 90% of the resulting MeOH originated from CO2, both for Cu supported on irreducible MgO, which exhibited a poor MeOH formation rate, and also for Cu on ZnO, which exhibits a high turnover MeOH rate.45 Although the reaction conditions in these studies were markedly different from ours, in particular the total pressure during the reaction, there is nevertheless good agreement on the dominant contribution of CO2 hydrogenation to MeOH, which points to rather similar reaction characteristics on supported Cu and Au catalysts. Similar findings, yet for much lower total pressures, were reported by Yang et al.,52 who observed for the reaction of a 12CO2/13CO/D2 reaction gas mixture (1:1:6) on a Cu/SiO2 catalyst under almost identical reaction conditions (6 bar and 240 °C), that also at much lower pressures than in the studies cited above the majority (78%) of MeOH formed originates from CO2.
3.3. Influence of the reaction temperature on MeOH formation from CO2
For the reaction gas mixture with 15% 13CO2/15% CO/45% H2, we also investigated changes in the isotopic composition of the product MeOH with increasing reaction temperatures at a constant total pressure of 5 bar. After reaching a steady-state situation at 240 °C, the reaction temperature was increased to 270 °C and finally to 300 °C. The corresponding MeOH formation rates and the isotopic composition of MeOH are plotted in Fig. 5 (see also Table 3 and Table S3, ESI†). As expected for the kinetically controlled regime (note that both CO2 and CO conversion were always well below the thermodynamic limit), the overall rate of MeOH formation increases with increasing reaction temperature, from 3.6 × 10⁻⁶ mol s−1 gAu−1 (TOF 1.5 × 10⁻³ s−1) to 8.6 × 10⁻⁶ mol s−1 gAu−1 (3.6 × 10⁻³ s−1) and finally to 10.4 × 10⁻⁶ mol s−1 gAu−1 (4.4 × 10⁻³ s−1) at 240 °C, 270 °C, and 300 °C, respectively. Although the MeOH formation rate from CO2 hydrogenation also increases with increasing temperature, its fraction of the overall MeOH formation decreases due to the more pronounced increase of the CO hydrogenation with temperature, from about 78% at 240 °C via 73% at 270 °C to finally 68% at 300 °C. Obviously, the temperature has a pronounced influence on the ratio of the (parallel) reaction pathways for CO2 and CO hydrogenation, with continuously less contribution from CO2 with increasing temperatures. Such tendency had already been reported by Sakurai et al.53 when comparing the CO2 and CO hydrogenation activities of Au/ZnO catalysts at temperatures between 150 and 400 °C and at 8 bar total pressure. They observed that up to 250 °C the MeOH yield from CO2 (for CO2/H2 = 3 and for CO2/H2 = 2) was higher than that from CO (CO/H2 = 2). At higher temperatures (≥300 °C), however, the MeOH yield from the CO/H2 reaction gas mixture became dominant. While their findings are in good agreement with our present results, both with the reaction activities measured separately in CO2/H2 and CO/H2 gas mixtures at 240 °C, and with the temperature dependent trend in the activities for COx hydrogenation in the CO2/CO/H2 mixture described above, their proposal was somewhat tentative since those authors did not perform measurements in the simultaneous presence of both CO and CO2. | ||
| Fig. 5 MeOH formation rates (TOFs, left axis) and the fraction of MeOH formed from 13CO2 (right axis) under steady-state conditions during reaction in 15% 13CO2/15% 12CO/45% H2 (CO2/CO = 1/1) at 5 bar on a Au/ZnO catalyst (STREM Chemicals) at various temperatures between 240 and 300 °C. | ||
| Temperature/°C | MeOH formation rate/10−6 mol s−1 gAu−1 | MeOH TOF/10−3 s−1 | Fraction of MeOH from 13CO2 |
|---|---|---|---|
| 240 | 3.6 | 1.5 | 78 |
| 270 | 8.6 | 3.6 | 73 |
| 300 | 10.4 | 4.4 | 68 |
In a recent study on MeOH formation on the Au/ZnO catalyst at pressures between 20 and 40 bar and at a temperature of 300 °C, Strunk et al. compared the activity of the catalyst for MeOH formation in CO2-containing and CO2-free reaction gas mixtures (CO/H2).54 They found that the partial replacement of CO by CO2 at 300 °C (switching from 15% CO/85% H2 to 6% CO/8% CO2/64% H2) resulted in lower MeOH formation rates.54 (Note that this involved also a change in the C/H ratio.) They explained this decrease of the MeOH formation rate in the presence of CO2 by either blocking oxygen vacancies on ZnO, which they had proposed as active sites for CO hydrogenation, by stable adsorbed formate species, or by the annihilation of these sites by the extra oxygen present in CO2. At first glance the higher MeOH formation rate in CO/H2 compared to that in a CO2-containing reaction gas mixture (CO/CO2/H2) reported in their study seems to be in contrast to our previous findings at 50 bar and 240 °C on Au/ZnO, where (i) the addition of 5–15% CO to a 15% CO2/45% H2 mixture resulted in a decrease in the MeOH formation rate and (ii) the MeOH formation rates in the presence of CO2 (in the absence and presence of CO) were always significantly higher than those obtained in a reaction gas mixture containing only CO/H2.32 However, taking into account the continuously higher contributions from CO to the overall MeOH formation with increasing temperatures, this apparent discrepancy can easily be rationalized. Obviously, CO hydrogenation becomes increasingly more important for MeOH formation upon increasing the reaction temperature from 240 to 300 °C.
The more pronounced increase in the MeOH formation from CO with increasing temperatures points directly to a higher apparent activation energy for the CO hydrogenation as compared to the CO2 hydrogenation. To derive more insights into the apparent activation barriers in the MeOH formation via the CO2 hydrogenation and the CO hydrogenation, we measured their activities in a temperature range between 220 °C and 270 °C in the CO2/H2 and CO/H2 mixtures. The results obtained are presented in Fig. 6a. They show that for both reactions the TOF for MeOH formation continuously increases as temperature increases. Consistent with the results presented above, the MeOH formation from CO2 is always higher than that from CO in the temperature range investigated (up to 270 °C). The apparent activation energies for MeOH formation calculated from the temperature dependence of the rates are 66 ± 5 and 92 ± 5 kJ mol−1 for the CO2 hydrogenation and CO hydrogenation on Au/ZnO at 5 bar, respectively, (see Fig. 6b). For comparison, the activities for MeOH formation from CO2 and CO measured in the simultaneous presence of CO and CO2 (15% CO2/15% CO/45% H2) at 240 °C, 270 °C, and 300 °C are also included in this figure. For 240 °C and 270 °C the MeOH formation rates from CO2 in the CO2/CO mixture and in pure CO2 are rather close to each other and show an almost identical temperature dependency. Only at 300 °C the MeOH formation from CO2 is somewhat lower than expected, but this may easily be rationalized by a decreasing selectivity for MeOH formation with increasing reaction temperature.32 Similar to that, also for MeOH formation from CO the activities are slightly higher for CO only than obtained in the presence of CO2, and the temperature dependence up to 270 °C seems comparable. Overall it is obvious from these measurements that the apparent activation energy for CO hydrogenation is higher compared to that for MeOH formation from CO2, for the individual reactions as well as for reaction gas mixtures containing CO2 and CO. This provides additional evidence that the CO2 hydrogenation to MeOH proceeds not via the RWGS reaction (eqn (1), see above). Otherwise, CO hydrogenation would be part of the MeOH formation from CO2, which accordingly should have at least the same activation barrier as CO hydrogenation. Hence, these results also indicate that CO2 is directly hydrogenated to MeOH under present reaction conditions. Since neither for the CO2 hydrogenation nor for the CO hydrogenation the nature and number of active sites or the local coverages of adspecies and reaction intermediates are known, the physical origin of different apparent activation energies and, hence, the increasing contribution from CO to the overall MeOH formation with increasing temperatures needs to be addressed in future studies.
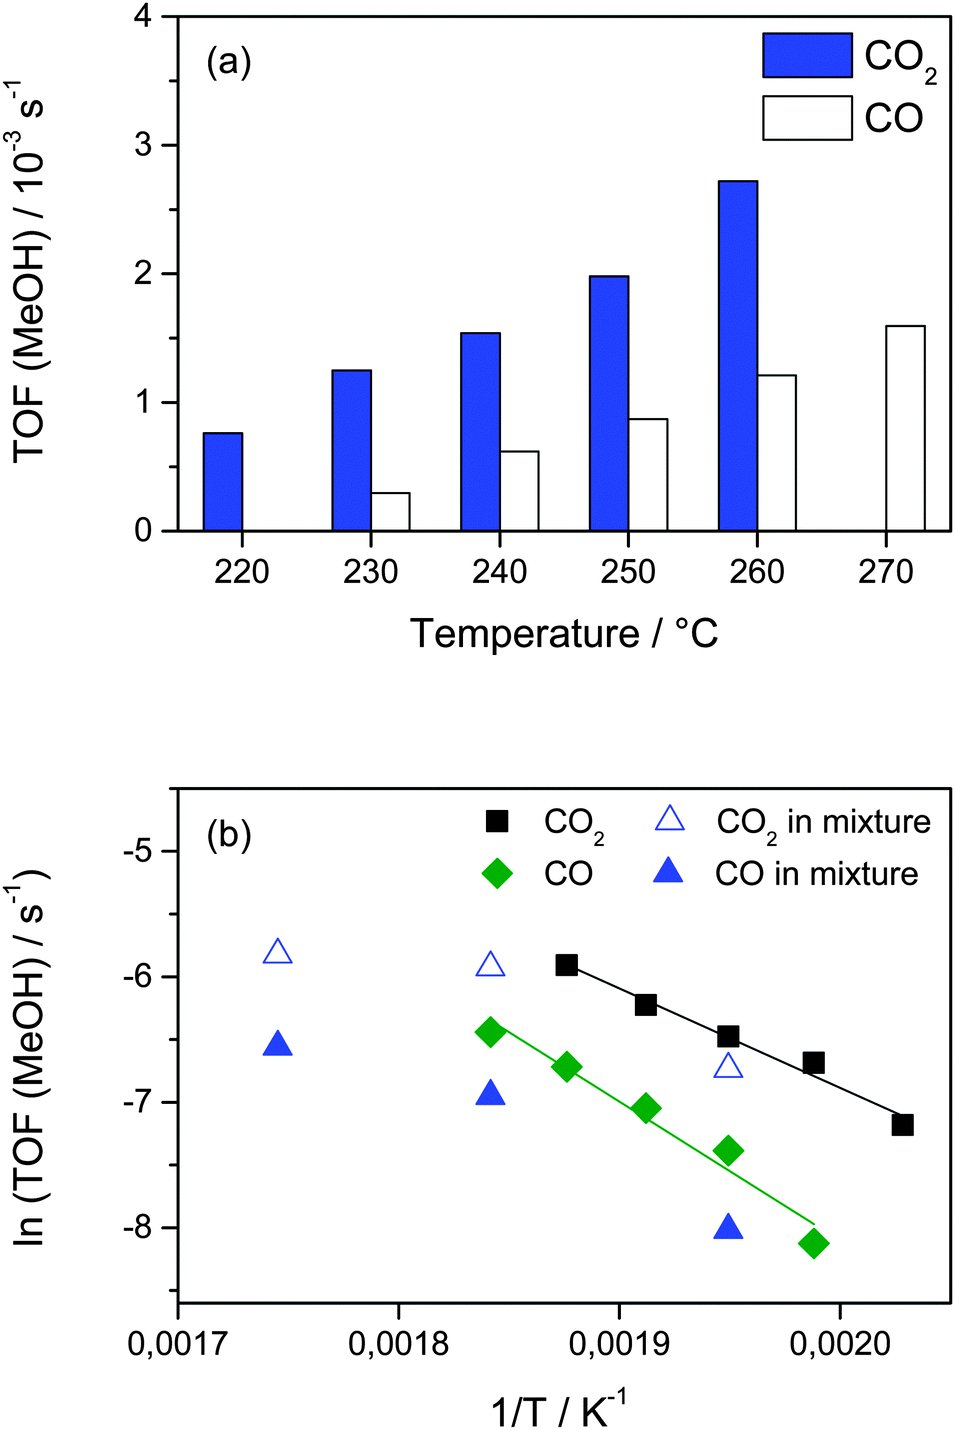 | ||
| Fig. 6 (a) Steady-state MeOH formation rates (TOFs) during CO2 (15% CO2, 45% H2, balance Ar) and CO (15% CO, 45% H2, balance Ar) hydrogenation at 5 bar and temperatures between 220 and 270 °C and (b) Arrhenius plots of the MeOH formation rates obtained in the above measurements. For comparison we also show the activities for MeOH formation from CO2 and CO in a mixture containing 15% CO2, 15% CO, 45% H2, balance Ar. | ||
In our previous studies we already compared Au catalysts with different oxide supports and different Au particle sizes (for Au/ZnO) in order to unravel the active site(s). Moreover, we also performed operando IR spectroscopic measurements during both CO2 hydrogenation and CO hydrogenation on Au/ZnO to gain further insight into the nature of the adspecies formed during the reaction. So far, however, these measurements did not allow us to draw firm conclusions on the nature of the active site or the reaction intermediates. This is the topic of ongoing studies in our laboratory, which aim at gaining more mechanistic insight, for example, by using Au/ZnO catalysts with different Au loadings.
3.4. Consequences of our results on application in renewable energy storage
The main aim of the present study was to further elucidate the role of CO in the hydrogenation of CO2 to MeOH. The latter reaction may be part of concepts for renewable energy storage, if the H2 required for this reaction is produced by renewable energies. It may help to overcome natural fluctuations in the supply of renewable energy as well as to diminish the overall CO2 emission. This, however, is only feasible if (i) the catalysts used for CO2 hydrogenation are highly selective towards MeOH formation, (ii) the CO formed via the parallel RWGS reaction has no or only little detrimental effect on the MeOH formation activity from CO2, and (iii) the CO resulting from the RWGS reaction can also be efficiently hydrogenated to MeOH. We have already demonstrated previously that Au/ZnO catalysts, to the best of our knowledge, have higher selectivities towards MeOH formation in this process in comparison to commercial Cu-based systems.32 Although there are also catalysts with even higher selectivities (up to 100%) under comparable reaction conditions,34–38 during CO2 hydrogenation on Au/ZnO there is always some CO present in the reaction gas atmosphere, whose partial pressure within the catalyst bed will increase together with the formation of MeOH. The present study provided clear evidence that the presence of up to 15% CO in the reaction atmosphere has almost no influence on the overall MeOH formation under present reaction conditions (5 bar, 240 °C). Although MeOH formation from CO2 is slightly diminished in the presence of CO, this is counterbalanced by additional MeOH formation from CO hydrogenation. The origin of the resulting MeOH formation, CO2 or CO hydrogenation, was unraveled. It should be noted that different from the present findings for reaction at 5 bar the MeOH formation from CO2 was found to decrease slightly in the presence of CO concentrations >1% for reaction at 50 bar.32 This has to be considered for practical applications, where the reaction will most likely be performed at rather high reaction pressures, due to higher MeOH yields at higher pressure.After the principal potential of Au/ZnO catalysts for CO2 hydrogenation to methanol has been clearly demonstrated, future work shall focus on (i) improving the activity and thus lower the catalyst costs and (ii) addressing mechanistic aspects by using operando spectroscopy. In this context the specific role of Au/ZnO is of particular interest.
4. Conclusions
From detailed kinetic isotope labelling measurements on MeOH formation from CO2 in CO containing syngas mixtures (13CO2/CO/H2) on highly selective Au/ZnO catalysts, performed at 5 bar total pressure and in the temperature range of 240–300 °C, we arrived at the following conclusions:1. Under present reaction conditions the activity of the Au/ZnO catalyst for CO2 hydrogenation in CO2/H2 is significantly higher than that for CO hydrogenation in CO/H2 syngas. Moreover, for the reaction in CO2/CO/H2 mixtures, up to equimolar amounts of CO and CO2 (15% CO2 and 15% CO), CO2 is the preferred carbon source of MeOH.
2. During the reaction in CO2/CO/H2 mixtures the fraction of MeOH formed from CO increases linearly from 10% to approximately 20% for the CO content up to 1%. At higher CO content, however, the changes in the CO contribution to the final MeOH product are negligible. This is tentatively explained by saturation of the active CO adsorption sites under these conditions.
3. The presence of CO in the reaction gas mixture has little effect on the activity of the Au/ZnO catalyst for CO2 hydrogenation to MeOH, as indicated by the very small decay in the TOF for MeOH formation from CO2. Furthermore, the addition of CO (0.5–15% CO) to a gas mixture containing only CO2/H2 has almost no effect on the overall MeOH formation rate of Au/ZnO.
4. From the fact that the main reaction pathway for CO2 hydrogenation is little affected by the presence of CO we conclude that CO2 and CO hydrogenation reactions proceed in parallel reaction pathways, independent of each other. Further evidence for this suggestion comes from (i) the time dependence of the reaction rates in CO2/H2 and CO/H2, where the very low activity observed for CO hydrogenation in the initial phase of the reaction is in contrast to the much higher initial activity for methanol formation from CO2 hydrogenation and (ii) the significantly higher apparent activation energy of Au/ZnO for MeOH formation from CO compared to CO2.
5. The relative activities for CO and CO2 hydrogenation depend strongly on the temperature. For reaction with equimolar amounts of CO2 and CO the main carbon source for MeOH at reaction temperatures between 240 °C and 300 °C is always CO2, but with an increasing tendency towards CO hydrogenation with increasing temperatures. Hence, at even higher temperatures, CO is expected to eventually dominate the MeOH formation under otherwise identical conditions.
Considering (i) the similar trends when comparing the activities of CO hydrogenation and CO2 hydrogenation as well as (ii) the qualitatively identical influence of CO addition to a CO2/H2 gas mixture on the overall MeOH formation rate at 5 bar and at 50 bar, we are confident that the present findings are valid also at elevated pressures (at 50 bar), which are more relevant for practical applications. Overall, the results further underline the remarkable potential of Au/ZnO catalysts for application in the hydrogenation of CO2 to “green MeOH” as an energy storage molecule.
Acknowledgements
We gratefully acknowledge extended discussions with S. Dahl (Haldor Topsøe A/S).References
- R. Schlögl, Angew. Chem., Int. Ed., 2011, 50, 6424 CrossRef PubMed.
- R. Schlögl, Nachr. Chem., 2012, 60, 1 CrossRef.
- G. A. Olah, Angew. Chem., Int. Ed., 2004, 44, 2636 CrossRef PubMed.
- G. A. Olah, Angew. Chem., Int. Ed., 2013, 52, 104 CrossRef CAS PubMed.
- Methanol: The Basic Chemical and Energy Feedstock of the Future, ed. M. Bertau, H. Offermanns, L. Plass, F. Schmidt and H.-J. Wernicke, Springer Verlag, Heidelberg, 2013 Search PubMed.
- J. B. Hansen and P. E. Højlund Nielsen, Handbook of Heterogeneous Catalysis, Wiley VCH, 2008, vol. 13.13, p. 2920 Search PubMed.
- X. Xu and J. A. Moulijn, Energy Fuels, 1996, 10, 305 CrossRef.
- H. Yang, Z. Xu, M. Fan, R. Gupta, R. B. Slimane, A. E. Bland and I. Wright, J. Environ. Sci., 2008, 20, 14 CrossRef CAS.
- A. J. Hunt, E. H. K. Sin, R. Marriott and J. H. Clark, ChemSusChem, 2010, 3, 306 CrossRef CAS PubMed.
- G. Ferey, C. Serre, T. Devic, G. Maurin, H. Jobic, P. L. Llewellyn, G. De Weireld, A. Vimont, M. Daturi and J. S. Chang, Chem. Soc. Rev., 2011, 40, 550 RSC.
- W. Wang, S. Wang, X. Ma and J. Gong, Chem. Soc. Rev., 2011, 40, 3703 RSC.
- M. Aresta, in Activation of Small Molecules, ed. W. B. Tolman, 2006, vol. 1, p. 1 Search PubMed.
- G. A. Olah, A. Goeppert and G. K. Suryia Prakash, J. Org. Chem., 2009, 74, 487 CrossRef CAS PubMed.
- G. A. Olah, G. S. Prakash and A. Goeppert, J. Am. Chem. Soc., 2011, 133, 12881 CrossRef CAS PubMed.
- M. Behrens, F. Studt, I. Kasatkin, S. Kühl, M. Hävecker, F. Abild-Pedersen, S. Zander, F. Girgsdies, P. Kurr, B.-L. Kniep, M. Tovar, R. W. Fischer, J. K. Nørskov and R. Schlögl, Science, 2012, 336, 893 CrossRef CAS PubMed.
- M. Behrens, Angew. Chem., Int. Ed., 2014, 53, 12022 CrossRef CAS PubMed.
- A. Goeppert, M. Czaun, J. P. Jones, G. S. Prakash and G. A. Olah, Chem. Soc. Rev., 2014, 43, 7995 RSC.
- The George Olah Renewable Methanol Plant, 2009, http://www.carbonrecycling.is.
- H. H. Kung, Catal. Rev.: Sci. Eng., 1980, 22, 235 CrossRef CAS.
- K. Klier, Adv. Catal., 1982, 31, 243 CAS.
- G. Ghiotti and F. Boccuzzi, Catal. Rev.: Sci. Eng., 1987, 29, 151 CrossRef CAS.
- J. C. J. Bart and R. P. A. Sneeden, Catal. Today, 1987, 2, 1 CrossRef CAS.
- G. C. Chinchen, P. J. Denny, J. R. Jennings, M. S. Spencer and K. C. Waugh, Appl. Catal., 1988, 36, 1 CrossRef CAS.
- A. Kiennemann and J. P. Hindermann, Stud. Surf. Sci. Catal., 1988, 35, 181 CrossRef.
- R. G. Herman, Stud. Surf. Sci. Catal., 1991, 64, 265 CrossRef CAS.
- K. C. Waugh, Catal. Today, 1992, 15, 51 CrossRef CAS.
- X.-M. Liu, G. Q. Lu, Z.-F. Yan and J. Beltramini, Ind. Eng. Chem. Res., 2003, 42, 6518 CrossRef CAS.
- K. C. Waugh, Catal. Lett., 2012, 142, 1153 CrossRef CAS.
- L. C. Grabow and M. Mavrikakis, ACS Catal., 2011, 1, 365 CrossRef CAS.
- J. Graciani, K. Mudiyanselage, F. Xu, A. E. Baber, J. Evans, S. D. Senanayake, D. J. Stacchiola, P. Liu, J. Hrbek and J. F. Sanz, Science, 2014, 345, 546 CrossRef CAS PubMed.
- Y. Hartadi, D. Widmann and R. J. Behm, ChemSusChem, 2015, 8, 456 CrossRef CAS PubMed.
- Y. Hartadi, D. Widmann and R. J. Behm, J. Catal., 2015, 333, 238 CrossRef.
- E. L. Kunkes, F. Studt, R. Schlögl, F. Abild-Pedersen and M. Behrens, J. Catal., 2015, 328, 43 CrossRef CAS.
- J. Toyir, P. R. de la Piscina, J. L. G. Fierro and N. Homs, Appl. Catal., B, 2001, 29, 207 CrossRef CAS.
- J. Sloczynski, R. Grabowski, A. Kozlowska, P. Olszewski, J. Stoch, J. Skrzypek and M. Lachowska, Appl. Catal., A, 2004, 278, 11 CrossRef CAS.
- O. Martin, C. Mondelli, D. Curulla-Ferré, C. Drouilly, R. Hauert and J. Perez-Ramirez, ACS Catal., 2015, 5, 5607 CrossRef CAS.
- X.-L. Liang, X. Dong, G.-D. Lin and H.-B. Zhang, Appl. Catal., B, 2009, 88, 315 CrossRef CAS.
- L. Jia, J. Gao, W. Fang and Q. Li, Catal. Commun., 2009, 10, 2000 CrossRef CAS.
- Z. S. Hong, Y. Cao, J. F. Deng and K. N. Fan, Catal. Lett., 2002, 82, 37 CrossRef CAS.
- R. Raudaskoski, M. V. Niemelä and R. L. Keiski, Top. Catal., 2007, 45, 57 CrossRef CAS.
- P. Gao, L. Zhong, L. Zhang, H. Wang, N. Zhao, W. Wei and Y. Sun, Catal. Sci. Technol., 2015, 5, 4365 Search PubMed.
- Z. Q. Wang, Z. N. Xu, S. Y. Peng, M. J. Zhang, G. Lu, Q. S. Chen, Y. Chen and G. C. Guo, ACS Catal., 2015, 5, 4255 CrossRef CAS.
- N. Y. Topsøe and H. Topsøe, Top. Catal., 1999, 8, 267 CrossRef.
- S. Kuld, C. Conradsen, P. G. Moses, I. Chorkendorff and J. Sehested, Angew. Chem., Int. Ed., 2014, 53, 5941 CrossRef CAS PubMed.
- F. Studt, M. Behrens, E. L. Kunkes, N. Thomas, S. Zander, A. Tarasov, J. Schumann, E. Frei, J. B. Varley, F. Abild-Pedersen, J. K. Nørskov and R. Schlögl, ChemCatChem, 2015, 7, 1105 CrossRef CAS.
- A. Le Valant, C. Comminges, C. Tisseraud, C. Canaff, L. Pinard and Y. Pouilloux, J. Catal., 2015, 324, 41 CrossRef CAS.
- C. Tisseraud, C. Comminges, T. Belin, H. Ahouari, A. Soualah, Y. Pouilloux and A. Le Valant, J. Catal., 2015, 330, 533 CrossRef CAS.
- G. C. Chinchen, M. S. Spencer, K. C. Waugh and D. A. Whan, J. Chem. Soc., Faraday Trans. 1, 1987, 83, 2193 RSC.
- M. Muhler, E. Törnqvist, L. P. Nielsen, B. S. Clausen and H. Topsoe, Catal. Lett., 1994, 25, 1 CrossRef CAS.
- G. Liu, D. Willcox, M. Garland and H. H. Kung, J. Catal., 1985, 96, 251 CrossRef CAS.
- A. Y. Rozovskii, Russ. Chem. Rev., 1989, 58, 41 CrossRef.
- Y. Yang, C. A. Mims, D. H. Mei, C. H. F. Peden and C. T. Campbell, J. Catal., 2013, 298, 10 CrossRef CAS.
- H. Sakurai, S. Tsubota and M. Haruta, Appl. Catal., A, 1993, 102, 125 CrossRef CAS.
- J. Strunk, K. Kähler, X. Xia, M. Comotti, F. Schüth, T. Reinecke and M. Muhler, Appl. Catal., A, 2009, 359, 121 CrossRef CAS.
Footnote |
| † Electronic supplementary information (ESI) available. See DOI: 10.1039/c5cp06888f |
| This journal is © the Owner Societies 2016 |