 Open Access Article
Creative Commons Attribution 3.0 Unported Licence
Physical insights into salicylic acid release from poly(anhydrides)†
Queeny
Dasgupta
a,
Kaushik
Chatterjee
ab and
Giridhar
Madras
 *ac
*ac
aCentre for Biosystems Science and Engineering, Indian Institute of Science, Bangalore-560012, India. E-mail: giridhar@chemeng.iisc.ernet.in; Tel: +91-80-2293 2321
bDepartment of Materials Engineering, Indian Institute of Science, Bangalore-560012, India
cDepartment of Chemical Engineering, Indian Institute of Science, Bangalore-560012, India
First published on 7th December 2015
Abstract
Salicylic acid (SA) based biodegradable polyanhydrides (PAHs) are of great interest for drug delivery in a variety of diseases and disorders owing to the multi-utility of SA. There is a need for the design of SA-based PAHs for tunable drug release, optimized for the treatment of different diseases. In this study, we devised a simple strategy for tuning the release properties and erosion kinetics of a family of PAHs. PAHs incorporating SA were derived from related aliphatic diacids, varying only in the chain length, and prepared by simple melt condensation polymerization. Upon hydrolysis induced erosion, the polymer degrades into cytocompatible products, including the incorporated bioactive SA and diacid. The degradation follows first order kinetics with the rate constant varying by nearly 25 times between the PAH obtained with adipic acid and that with dodecanedioic acid. The release profiles have been tailored from 100% to 50% SA release in 7 days across the different PAHs. The release rate constants of these semi-crystalline, surface eroding PAHs decreased almost linearly with an increase in the diacid chain length, and varied by nearly 40 times between adipic acid and dodecanedioic acid PAH. The degradation products with SA concentration in the range of 30–350 ppm were used to assess cytocompatibility and showed no cytotoxicity to HeLa cells. This particular strategy is expected to (a) enable synthesis of application specific PAHs with tunable erosion and release profiles; (b) encompass a large number of drugs that may be incorporated into the PAH matrix. Such a strategy can potentially be extended to the controlled release of other drugs that may be incorporated into the PAH backbone and has important implications for the rational design of drug eluting bioactive polymers.
1. Introduction
Poly(anhydrides) (PAHs) are a versatile class of polymeric biomaterials that have found extensive use in biomedical applications, particularly in the area of drug delivery.1–3 These polymers are best suited for short term drug release;4,5 however, the controlled release of several drugs has been successfully achieved by loading drugs in the PAHs.6,7 These polymers are typically hydrophobic but they possess hydrolytically labile anhydride linkages, which qualify these materials as prospective biodegradable materials. The major benefit of PAHs is that they are typically composed of diacid precursors. Because these precursors are often endogenous to the human body, PAHs do not elicit inflammatory responses when used as biomaterial implants.8,9A variety of PAH structures has been synthesized and evaluated to accomplish application specific drug release behavior. Apart from changing the nature/structure of the polymeric backbone to aliphatic or aromatic, combinations of the two have also been tried.10,11 PAHs like poly(maleic anhydride) have been synthesized such that anhydride linkages are present in the pendant side chains instead of the primary backbone.12,13 Owing to the diverse requirements of stimuli-responsiveness14 in drug release applications, it is important to understand the correlation between the structure of the polymer and its subsequent influence on physical properties such as degradation and drug release.15
Aliphatic PAHs have created significant interest in the area of short term drug release, particularly because of their simple diacid constitution. They are semi-crystalline in nature and typically have melting temperatures higher than the physiological temperature.16 These are commonly synthesized by simple solvent-free melt polycondensation techniques and may, therefore, be considered safe for biomedical applications. Since PAHs come under the class of insoluble, hydrophobic polymers, degradation or mass loss involves an inevitable step of erosion (as a consequence of polymer chain scission). For such hydrolytic chain scission to occur, the bonds present in the vicinity of the cleavable bonds also play a pivotal role. A more hydrophobic chemical structure present in the proximity of the anhydride bond will allow less water retention and subsequently, slower degradation than in a hydrophilic structure.
The influence of linker structure on release from the PAH backbone has been studied previously.17 However, a systematic study of the degradation and release properties of a family of SA based PAHs have not been conducted. In the present study, we use the particular strategy of varying the chain length of diacid to understand its influence on the degradation/erosion kinetics and on the SA release behavior. This study thus provides a systematic comparison of SA-loaded polyanhydrides that offers new physical insights into changes that occur in physico-chemical, degradation and release properties, resulting from the differences in chain length of the reactant. We believe that these physical insights can facilitate the rational design of SA loaded polymers for drug delivery.
SA is a potent drug used for its antibacterial,18,19 anti-inflammatory,20,21 anti-pyretic, and anti-cancerous22 applications. However, the dosages vary significantly depending on the intended application. The time course of release is also an important characteristic that determines its suitability for an application. The PAHs are of particular interest in drug delivery because they undergo surface erosion and are most suitable for providing controlled release. The anti-inflammatory and anti-microbial effects of SA are well reported and the immediate release of SA from these anhydrides could help mitigate these issues. The only parameter varied in these PAHs is the diacid such as adipic acid, suberic acid, sebacic acid and dodecanedioic acid. These are linear, aliphatic diacids that have monotonically increasing chain lengths.
2. Experimental
2.1 Materials
Diacyl chlorides, adipoyl chloride (AC, Sigma Aldrich), suberoyl chloride (SC, Sigma Aldrich), sebacoyl chloride (SeC, TCI chemicals, India), and dodecanedioyl chloride (DC, Sigma Aldrich) were used. Acetic anhydride (AAn) was procured from Sigma Aldrich. Salicylic acid (SA) was obtained from SD Fine Chemicals, India. Solvents used at various stages of the study include ethyl acetate (EtoAc), chloroform, dichloromethane (DCM), dimethylsulfoxide (DMSO), N,N-dimethylformamide (DMF), and acetone (all from Merck, India).2.2 Synthesis
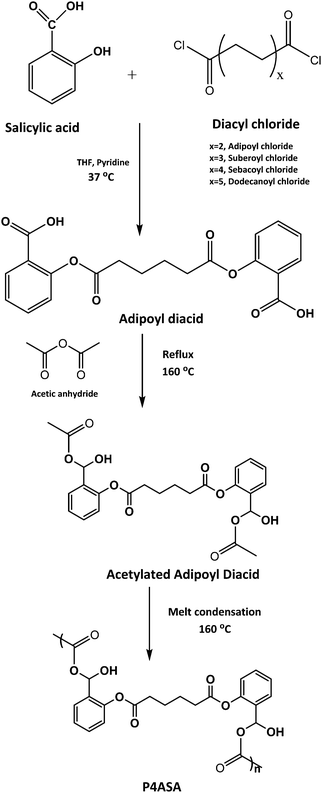 | ||
| Scheme 1 Synthesis scheme of SA incorporated PAHs (P4ASA). Diacyl chlorides were changed to result in different PAHs. | ||
The loading concentrations of SA as obtained by dissolving polymer discs in PBS (pH 9.0) were 4.6, 3.5, 2.6 and 1.9% by weight for P4ASA, P6ASA, P8ASA and P10ASA, respectively.
2.3 Materials characterization
 | (1) |
In eqn (1), M0 and Mt indicate the initial and final weights of the PAH discs, respectively. All samples were made in triplicate and the mass loss data are represented as mean ± standard deviation.
After treatment in conditioned media, cell viability was estimated using MTT (3-(4,5-dimethylthiazol-2-yl)-2,5-diphenyltetrazolium Bromide, Sigma Aldrich) assay. The respiratory chain reduces MTT and other tetrazolium salts by the action of oxidoreductases produced by live cells. A stock solution of 5 mg mL−1 of MTT was made initially. The working solution was a diluted solution of 1 mg mL−1. For the cell proliferation assay, 200 μL of MTT solution (1 mg mL−1) was added to each well. The well plates were kept unperturbed at 37 °C in 5% CO2 for 3 h. Water insoluble formazan crystals were solubilized in DMSO and the absorbance was measured at 570 nm in a well plate reader (Synergy HT, Biotek). The absorbance value is proportional to the number of mitochondria in the well. The mean of absorbance values from five independent wells was obtained to give the final absorbance. The data are represented as mean ± S.D. for n = 5. Analysis of variance (ANOVA) with Tukey's test was used for all statistical analysis, and significances were considered significant for p < 0.05.
3. Results and discussion
The synthesized PAHs have molecular weights ranging from 8300 to 49![[thin space (1/6-em)]](https://www.rsc.org/images/entities/char_2009.gif) 000 Da (as shown in Table 1) with a polydispersity index of 1.4. The molecular weights increased as the chain length of the diacid precursor increased.
000 Da (as shown in Table 1) with a polydispersity index of 1.4. The molecular weights increased as the chain length of the diacid precursor increased.
| Polyester | M w (Da) | T g (°C) | T m (°C) | T c (°C) | ΔH (J g−1) | Contact angleb (°) | Mass loss (%) in 7 daysc | Degradation rate constant, k × 10−3 (h−1) | SA release (%) in 7 daysc | Release rate constant, kr × 10−3 (h−1) |
|---|---|---|---|---|---|---|---|---|---|---|
| a Within a range of ±2 °C. b Within a range of ±2°. c Error ±1. | ||||||||||
| P4ASA | 8300 | −27 | 53 | 40 | 38 | 32 | 100 | 120 | 100 | 94 |
| P6ASA | 10![[thin space (1/6-em)]](https://www.rsc.org/images/entities/char_2009.gif) 200 200 |
−21 | 57 | 43 | 48 | 56 | 100 | 45 | 100 | 40 |
| P8ASA | 13![[thin space (1/6-em)]](https://www.rsc.org/images/entities/char_2009.gif) 300 300 |
−5 | 66 | 57 | 92 | 68 | 85 | 11.9 | 84 | 9.9 |
| P10ASA | 49![[thin space (1/6-em)]](https://www.rsc.org/images/entities/char_2009.gif) 000 000 |
−3 | 84 | 64 | 132 | 82 | 57 | 4.5 | 28 | 2.2 |
3.1 FTIR spectroscopy
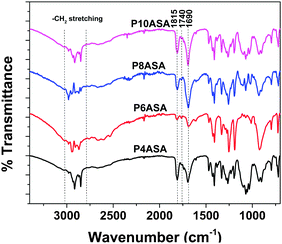
All the acids (AC, SC, SeC and DC) show the characteristic IR peak at 1690 cm−1 due to the –C![[double bond, length as m-dash]](https://www.rsc.org/images/entities/char_e001.gif) O stretching of carboxylic chloride. After the synthesis of the diacid in the first step, a peak appeared at 1750 cm−1, indicating the formation of the ester bond at the –OH group of SA. The peak at 1690 cm−1 was still present, indicating the presence of the free –COOH group. After the reaction with AAn and subsequent polymerization under vacuum, two peaks were observed at 1815 cm−1 and 1740 cm−1, which are characteristic of two –C
O stretching of carboxylic chloride. After the synthesis of the diacid in the first step, a peak appeared at 1750 cm−1, indicating the formation of the ester bond at the –OH group of SA. The peak at 1690 cm−1 was still present, indicating the presence of the free –COOH group. After the reaction with AAn and subsequent polymerization under vacuum, two peaks were observed at 1815 cm−1 and 1740 cm−1, which are characteristic of two –C![[double bond, length as m-dash]](https://www.rsc.org/images/entities/char_e001.gif) O stretching vibrations and indicate the formation of the anhydride bond, generally characterized by two peaks (Fig. 1). All peaks match previously reported literature.25
O stretching vibrations and indicate the formation of the anhydride bond, generally characterized by two peaks (Fig. 1). All peaks match previously reported literature.25
3.2 NMR spectroscopy
NMR spectroscopy (Fig. S1, see ESI†) confirmed the chemical characterization as observed in FTIR. All peaks in the 1H NMR spectra match previously reported data in literature.26,271H NMR confirmed the presence of all the peaks corresponding to protons in the –CH2 (methylene) units of the diacids. The peaks from the di-carboxylic acids are displayed in the range between 0.8 and 2.4 ppm. The peaks of the monomers match those obtained in the polyesters. More shielded Cγ, Cδ protons are present in the higher chain diacids of sebacic and dodecanedioic acid as compared to the lower chain diacids. P4ASA contains protons only attached to α, β carbons; whereas, P10ASA contains protons attached to α, β, γ, δ and ε carbons. This confirmed the structure of the PAHs. However, the formation of the anhydride was confirmed by the 13C NMR that confirmed the presence of a peak at 170 ppm corresponding to the carbon of the anhydride bond that was present for all the synthesized PAHs.3.3 Differential scanning calorimetry
Thermal characterization (Fig. S2, see ESI†) of the four PAHs showed that the melting temperature (Tm) increases as the chain length of the diacid increases. The Tm values obtained are 53, 57, 66 and 85 °C for P4ASA, P6ASA, P8ASA and P10ASA, respectively. The longer hydrophobic chains of DC as compared to AC cause the substantial increase of the Tm from 53 to 85 °C. There is also a considerable increase in the crystallization temperature (Tc) as the chain length increases. Tc is 40, 42, 56 and 74 °C for P4ASA, P6ASA, P8ASA and P10ASA, respectively. Correspondingly, the Tg ranges from −27 to −3 °C and increases with the diacid chain length. The increase in Tg may be attributed to the higher degree of polymerization in the higher chain length PAHs as compared to their shorter chain counterparts (as shown in Table 1). The longer chain restricts the rotational flexibility of the polymer chains, thereby causing an increase in Tg. However, since all the synthesized PAHs have Tg lower (and Tm higher) than the physiological temperature (37 °C), this family of PAHs is suitable for biomedical applications. The ends of a polymer chain have more freedom of motion as compared to the inner segments; low molecular weight polymers have more chain ends per unit volume, and therefore, higher free volume and lower Tg.The crystallization temperature (Tc) also increases as the chain length of the diacid increases. Tc values range from 40 to 74 °C between the 4 PAHs and increase as a function of the diacid chain length. The degree of crystallinity may be calculated by considering the area under the crystallization curve and is the enthalpy of crystallization (ΔH). It is observed that the crystallinity increases as the chain length of the diacid increases. The ΔH values obtained are 38, 48, 92 and 132 J g−1 for P4ASA, P6ASA, P8ASA and P10ASA, respectively. The increase in crystallinity is generally accompanied with a concomitant increase in the Tm, as observed in this family of PAHs.
PAHs with higher loading concentrations of SA (∼15%) were synthesized and it was observed that these polymers had Tm values very close to 37 °C. This is undesirable as drug delivery is considerably affected if Tm is ≤37 °C. Therefore, all further synthesis and characterization were performed on PAHs with loading <5%.
3.4 Surface water wettability
The surface water wettability pertains to the hydrophobicity of the polymeric material. The hydrophobicity increases in the following trend: P4ASA < P6ASA < P8ASA < P10ASA. The values of the water contact angles are tabulated in Table 1. The increase in the contact angle and subsequent decrease in the wettability may be attributed to the number of methylene (–CH2) units present in the parent diacid. Longer aliphatic chains are more hydrophobic than their shorter counterparts. The greater hydrophilicity of the shorter chain diacids may be attributed to the higher loading percentage of SA in these diacids than in their longer chain counterparts. SA is hydrophilic and its greater inclusion in the matrix leads to the increased hydrophilicity of the PAH.3.5 Hydrolytic degradation studies
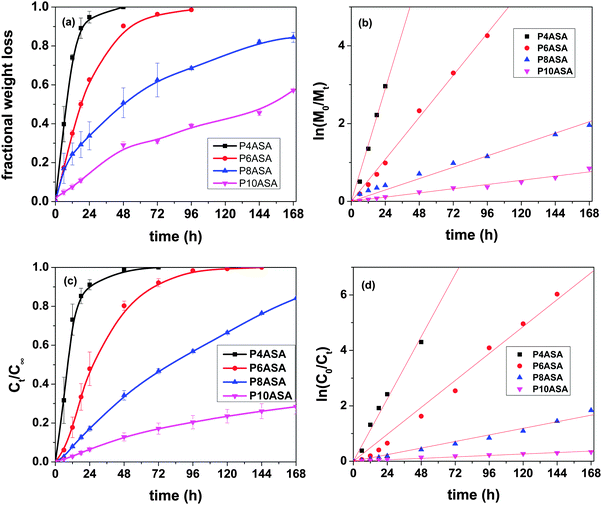
The hydrolytic degradation rate increases as the chain length decreases and follows the trend P4ASA > P6ASA > P8ASA > P10ASA. P4ASA, P6ASA, P8ASA and P10ASA degrade by 100%, 90%, 50% and 28% in 48 h, respectively (Fig. 2a). The degradation data show that the PAHs degrade between 30% and 100% in the first 48 h of hydrolysis. This fast degradation may limit their uses in biomedical applications. However, since the need for antimicrobial, anti-inflammatory drugs is most often immediate after an implantation, and the incorporated SA is reported to possess both these features, they may therefore, be considered suitable for therapeutic applications.The higher hydrophobic chains of the longer chain acids allow less water permeation than in the shorter chain diacids. The solubility of adipic acid in water is considerably higher than that of the other diacids.28 The hydrolytically labile anhydride bonds are located in the proximity of the aliphatic chains. As shown in the contact angle studies, the hydrophobicity of these chains increases with the diacid chain length. Owing to this, the water available at the vicinity of the anhydride bond decreases as the chain length increases. Less water results in lower hydrolysis of the anhydride bonds and consequently, lower mass loss.
Hydrolytic degradation causes chain scission in the backbone of the polymer due to bulk or surface erosion.29,30 In most cases, it occurs as a simultaneous bulk or surface phenomenon, wherein one mechanism is more predominant. The anhydride bonds are extremely labile to hydrolysis and thus, the degradation of the surface anhydrides takes place much faster than its penetration into the bulk of the matrix.31 Since the mass loss due to degradation is accompanied by a concomitant decrease in the sample dimensions, it is likely that the erosion takes place layer by layer from the surface of the matrix.29 This is further corroborated by the kinetics of mass loss, as discussed in the following section.
3.6 Kinetics of degradation
The degradation kinetics of these PAHs may be modeled using the following equation: | (2) |
In eqn (2), k is the degradation rate constant and n is the order of degradation. First order release kinetics is followed in all four PAHs as is evident by fitting the degradation data to the following equation:
 | (3) |
In eqn (3), Mt and M0 are the final and initial weights of the polymer at time t and time t = 0, respectively. A semi-log plot of  with time was linearly regressed to obtain the degradation rate constant (Fig. 2b). The values of k (×10−3 h−1) obtained are 120, 45, 11.9 and 4.5 for P4ASA, P6ASA, P8ASA and P10ASA, respectively. The value of k increases by an order of magnitude for P4ASA as compared to P8ASA and similarly, for P6ASA compared to P10ASA.
3.7 SA release studies
SA release was evaluated by monitoring the SA concentration in the release media. It was observed that the release follows the trend P4ASA > P6ASA > P8ASA > P10ASA. In the first 48 h, the polymers P4ASA, P6ASA, P8ASA and P10ASA release 98%, 80%, 34% and 12%, respectively (Fig. 2c). The fast SA release observed in P4ASA and P6ASA may be attributed to two factors: (i) the lesser hydrophobic nature of AC and SC as compared to SeC and DC; (ii) the complete degradation of the P4ASA and P6ASA in 48 h and 96 h, respectively. Another major factor driving the release of SA from these polymeric matrices is the generally hydrophobic nature of these aliphatic PAHs,29 which leads to the tendency for the hydrophilic SA to be released into the media.3.8 Kinetics of release
The kinetics of release followed first order degradation of the PAH matrices. The SA release may be modeled using the following equation, | (4) |
In eqn (4), C is the concentration of the drug remaining in the polymer, kr is the release rate constant and n is the order of release. Considering first order release and integrating eqn (4), we obtain equation 5,
 | (5) |
In eqn (5), C0 and Ct are the initial and final SA concentrations at time t = 0 and t = t, respectively. The semi-log plot of Ct/C0 with time shows that the kr (×10−3 h−1) values obtained are 94, 40, 9.9 and 2.2 for P4ASA, P6ASA, P8ASA and P10ASA, respectively (Fig. 2d). The release rates are consistent with the degradation data and show that the release rate constant increases with a decrease in the diacid chain length. Thus, kr/k is nearly the same for P4ASA, P6ASA and P8ASA, indicating that release and degradation are related. Similar to the degradation rates, the rate constant of release is nearly an order of magnitude higher for P4ASA as compared to P8ASA. Higher hydrophobicity of P8ASA compared to P4ASA (Table 1) allows lesser water in their vicinity,32,33 thereby hindering the degradation and consequently, the release from the PAH matrix. Thus, the degradation of the polymer plays a key role in determining the amount of drug released from the matrix.
3.9 Cytocompatibility studies
The cell studies showed that cell proliferation was not affected by the degradation products of the PAHs. Despite the decreased pH of the medium due to the fast degradation of P4ASA and P6ASA, the conditioned media were not toxic to the cells. P4ASA, P6ASA, P8ASA and P10ASA released 350 ppm, 100 ppm, 40 ppm and 25 ppm, respectively, in 24 h. These concentrations were estimated as per the release profiles of SA in PBS. Release concentrations may differ slightly in a complete culture medium. Release concentration could not be obtained directly from the medium because of the interference of serum proteins at the maximum emission of SA (297 nm). The MTT assay (Fig. 3) shows comparable cell viability in the conditioned media treated cells to that of the control (fresh medium treated). The cell numbers increased congruously, as monitored after 1 day and 3 days. The cells appeared to be well spread across all samples and good cell to cell contact was established in 3 days (Fig. 4). There was no statistically significant difference observed across the samples.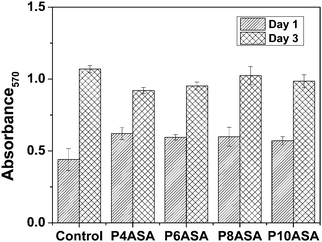 | ||
| Fig. 3 Cell viability assay (MTT data) of P4ASA, P6ASA, P8ASA and P10ASA based on absorbance at 570 nm. | ||
 | ||
| Fig. 4 Optical micrograph of HeLa cells subjected to conditioned medium from P4ASA after (a) 6 h, (b) 24 h and (c) 72 h. | ||
3.10 Antibacterial studies
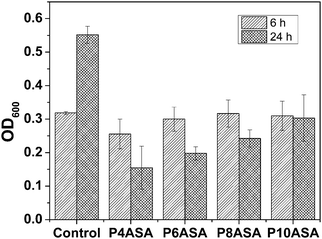
The antibacterial studies of the PAHs show that all four PAHs are active against S. aureus. This study also shows that the released SA is pharmacologically active. The polymers did not show any significant difference from the blank (untreated) after 6 h. However, after 24 h of growth in the presence of the PAHs, there was a significant drop in the OD600 value indicating much less bacterial growth. All the PAHs showed similar antibacterial effect. In order to find significant differences between the polymers, a paired t-test with p = 0.05 was conducted, and it was observed that P4ASA and P10ASA had significantly different antibacterial activities (Fig. 5). This difference may be due to the appreciable disparity in the amount of SA released by the two polymers. P4ASA and P10ASA released 350 and 25 ppm, respectively, in 24 h. This higher release of SA from P4ASA may be attributed to its higher activity against S. aureus. P4ASA showed ∼72% decrease in bacterial count compared to the control (blank untreated sample).4. Conclusions
We successfully synthesized a family of PAHs for SA delivery. We investigated in detail their degradation and drug release kinetics by varying the chain length of the precursor diacid. The chain length of the precursor plays an important role in controlling the rate of drug release from the polymeric system. It may therefore be effectively used as a strategy to tailor drug release from aliphatic PAHs for application specific purposes. The released drug showed pharmacological activity against bacterial cells. Owing to their cytocompatibility, these SA-based polymers may find uses in biomedical applications.Acknowledgements
The authors are grateful to the Department of Biotechnology (DBT), India (BT/PR5977/MED/32/242/2012) for providing financial support for this study. G. M. thanks the Department of Science and Technology (DST), India, for J. C. Bose fellowship. K. C. acknowledges the Ramanujan fellowship from DST. The authors wish to thank the NMR research centre, IISc Bangalore, for providing access to the NMR facility.References
- H. B. Rosen, J. Chang, G. Wnek, R. Linhardt and R. Langer, Biomaterials, 1983, 4, 131–133 CrossRef CAS PubMed.
- K. Leong, B. Brott and R. Langer, J. Biomed. Mater. Res., 1985, 19, 941–955 CrossRef CAS PubMed.
- W. Khan, V. G. S. Challa, R. Langer and A. J. Domb, Focal Controlled Drug Delivery, Springer, 2014, pp. 3–32 Search PubMed.
- B. D. Ulery, H. M. Kan, B. A. Williams, B. Narasimhan, K. W. H. Lo, L. S. Nair and C. T. Laurencin, Adv. Healthcare Mater., 2014, 3, 843–847 CrossRef CAS PubMed.
- S. Ponnurangam, G. D. O'Connell, C. T. Hung and P. Somasundaran, Colloids Surf., B, 2015, 136, 207–213 CrossRef CAS PubMed.
- J. P. Jain, S. Modi, A. Domb and N. Kumar, J. Controlled Release, 2005, 103, 541–563 CrossRef CAS PubMed.
- J. Wang, G. Yang, X. Guo, Z. Tang, Z. Zhong and S. Zhou, Biomaterials, 2014, 35, 3080–3090 CrossRef CAS PubMed.
- J. E. Vela-Ramirez, J. T. Goodman, P. M. Boggiatto, R. Roychoudhury, N. L. Pohl, J. M. Hostetter, M. J. Wannemuehler and B. Narasimhan, AAPS J., 2015, 17, 256–267 CrossRef CAS PubMed.
- S. S. Snyder, T. J. Anastasiou and K. E. Uhrich, Polym. Degrad. Stab., 2015, 115, 70–76 CrossRef CAS PubMed.
- E. Shen, M. J. Kipper, B. Dziadul, M.-K. Lim and B. Narasimhan, J. Controlled Release, 2002, 82, 115–125 CrossRef CAS PubMed.
- D. Teomim and A. J. Domb, Biomacromolecules, 2001, 2, 37–44 CrossRef CAS PubMed.
- I. Donati, A. Gamini, A. Vetere, C. Campa and S. Paoletti, Biomacromolecules, 2002, 3, 805–812 CrossRef CAS PubMed.
- M. Maniar, X. Xie and A. J. Domb, Biomaterials, 1990, 11, 690–694 CrossRef CAS PubMed.
- S. G. Roy, K. Bauri, S. Pal, A. Goswami, G. Madras and P. De, Polym. Int., 2013, 62, 463–473 CrossRef CAS.
- A. Göpferich and R. S. Langer, J. Polym. Sci., Part A: Polym. Chem., 1993, 31, 2445–2458 CrossRef.
- H. R. Kricheldorf and Z. Gomourachvili, Macromol. Chem. Phys., 1997, 198, 3149–3160 CrossRef CAS.
- A. Prudencio, R. C. Schmeltzer and K. E. Uhrich, Macromolecules, 2005, 38, 6895–6901 CrossRef CAS PubMed.
- N. D. Stebbins, M. A. Ouimet and K. E. Uhrich, Adv. Drug Delivery Rev., 2014, 78, 77–87 CrossRef CAS PubMed.
- L. Rosenberg, A. Carbone, U. Römling, K. Uhrich and M. Chikindas, Lett. Appl. Microbiol., 2008, 46, 593–599 CrossRef CAS PubMed.
- C. Banti, A. Giannoulis, N. Kourkoumelis, A. Owczarzak, M. Kubicki and S. Hadjikakou, J. Inorg. Biochem., 2015, 142, 132–144 CrossRef CAS PubMed.
- R. Amann and B. A. Peskar, Eur. J. Pharmacol., 2002, 447, 1–9 CrossRef CAS PubMed.
- E. Bastiaannet, K. Sampieri, O. Dekkers, A. de Craen, M. van Herk-Sukel, V. Lemmens, C. van den Broek, J. W. Coebergh, R. Herings and C. van de Velde, Br. J. Cancer, 2012, 106, 1564–1570 CrossRef CAS PubMed.
- Y. Chandorkar, R. K. Bhagat, G. Madras and B. Basu, Biomacromolecules, 2014, 15, 863–875 CrossRef CAS PubMed.
- E. Ron, E. Mathiowitz, G. Mathiowitz, A. Domb and R. Langer, Macromolecules, 1991, 24, 2278–2282 CrossRef CAS.
- J. P. Coates, Appl. Spectrosc. Rev., 1996, 31, 179–192 CrossRef CAS.
- B. M. Vogel and S. K. Mallapragada, Biomaterials, 2005, 26, 721–728 CrossRef CAS PubMed.
- E. Mathiowitz, E. Ron, G. Mathiowitz, C. Amato and R. Langer, Macromolecules, 1990, 23, 3212–3218 CrossRef CAS.
- E. C. Attané and T. F. Doumani, Ind. Eng. Chem., 1949, 41, 2015–2017 CrossRef.
- A. Göpferich and J. Teßmar, Adv. Drug Delivery Rev., 2002, 54, 911–931 CrossRef.
- A. Göpferich, Biomaterials, 1996, 17, 103–114 CrossRef.
- S. Domanskyi, K. L. Poetz, D. A. Shipp and V. Privman, Phys. Chem. Chem. Phys., 2015, 17, 13215–13222 RSC.
- Q. Dasgupta, K. Chatterjee and G. Madras, Biomacromolecules, 2014, 15, 4302–4313 CrossRef CAS PubMed.
- J. Yu, F. Lin, P. Lin, Y. Gao and M. L. Becker, Macromolecules, 2013, 47, 121–129 CrossRef.
Footnote |
| † Electronic supplementary information (ESI) available. See DOI: 10.1039/c5cp06858d |
| This journal is © the Owner Societies 2016 |

