 Open Access Article
Investigation of sodium insertion into tetracyanoquinodimethane (TCNQ): results for a TCNQ thin film obtained by a surface science approach
R.
Precht
 a,
S.
Stolz
ab,
E.
Mankel
ab,
T.
Mayer
a,
W.
Jaegermann
a and
R.
Hausbrand
a
a,
S.
Stolz
ab,
E.
Mankel
ab,
T.
Mayer
a,
W.
Jaegermann
a and
R.
Hausbrand
a
aDepartment of Materials Science, Surface Science Division, Darmstadt University of Technology, Jovanka-Bontschits-Str. 2, 64287 Darmstadt, Germany
bInnovationLab GmbH, Speyerer Str. 4, 69115 Heidelberg, Germany
First published on 7th January 2016
Abstract
In this contribution, we investigate the insertion of sodium into tetracyanoquinodimethane (TCNQ) and its effect on the electronic structure by means of a surface science experiment. We exposed a TCNQ thin film stepwise to sodium vapour and monitored the electronic structure by X-ray photoelectron spectroscopy (XPS) and ultra-violet photoelectron spectroscopy (UPS). During the insertion experiment three stages were observed, which can be related to three different phases, predominantly consisting of TCNQ0, TCNQ1− and TCNQ2−. With increasing sodium content the Fermi level shifts upwards and new electronic states appear in the band gap. For phases with high sodium content the sodium diffusion seems to be inhibited which we attribute to closed diffusion pathways in the molecular structure of TCNQ1−.
Introduction
Investigations on electronic properties of organic materials started as early as 19501 and have continued ever since. With the development of organic materials, e.g. for light emitting devices,2 solar cells3,4 and field effect transistors,5 conducting organic materials successively replace inorganic semiconductor materials in electronic devices. The major advantages for organic materials are a low ecological footprint, abundant resources,6,7 lightweight and easy as well as low cost processing. A more recent field for the application of organic materials are batteries.8Tetracyanoquinodimethane (TCNQ) is a n-type9 high work function (about 5.3 eV4) organic semiconductor. In semiconductor physics TCNQ is known from charge transfer complexes as an electron acceptor10 material. Electron transfer to TCNQ results in the formation of two new states in the (former) band-gap11 and increased electronic conductivity.12 TCNQ allows the insertion of alkali, and investigations on TCNQ8,11,13 as an electrode material in a lithium ion battery showed promising results.6,14 Calculations predict an electron transfer number of 2.3 per TCNQ molecule which correlates with a high specific capacity of 263 mA h−1 g−1 for TCNQ.6
Due to the higher abundance of natural resources,15 the use of sodium in ion batteries is attractive and subject to current research.16
In this contribution, we investigate the insertion of sodium into TCNQ and its effect on the electronic structure by means of a surface science experiment. We exposed TCNQ thin films subsequent to sodium vapour and monitored the electronic structure by surface sensitive X-ray photoelectron spectroscopy (XPS) and ultra-violet photoelectron spectroscopy (UPS). This approach has been successfully employed by us previously to study alkali insertion into inorganic materials17 and organic materials.11,18
In another publication we investigated the insertion of lithium into TCNQ.18 A loading of up to one electron or lithium ion per TCNQ molecule could be monitored. In this paper we report the insertion of sodium into TCNQ, which leads to a higher loading. The use of sodium offers advantages with respect to analysis due to a higher cross section and surface sensitivity. Specifically, we monitor the evolution of molecular structure, electronic structure and Fermi-level with increasing sodium insertion into TCNQ.
Experimental
For the experiments, 7,7,8,8-tetracyanoquinodimethane (98%) (TCNQ) from Sigma Aldrich Chemical Company was used. The chemical structure of TCNQ is given in Fig. 1.The experiments were performed in the DArmstädter Integrated SYstem for SOLar cells (DAISY-SOL), an integrated ultra-high vacuum system with a base pressure of about 10−10 mbar to 4 × 10⁻⁹ mbar (in the deposition chamber) where samples can be produced without contact to air or humidity. A molybdenum (Mo) foil was inserted as a substrate after ultrasonic cleaning. Subsequently, a 10 nm thick layer of TCNQ was prepared by thermal evaporation of TCNQ at about 140 °C. The thickness of the organic layer was calculated from the intensity ratio of the Mo3d substrate peak before and after the deposition of thinner TCNQ films. The pure TCNQ has been investigated with XPS and UPS. Afterwards the TCNQ film was stepwise exposed to sodium vapour from a dispenser (SAES getters). The deposition of sodium was done at a chamber pressure of (6–8) × 10−8 mbar in several steps with increasing time of deposition. In the first three steps sodium was deposited for 8, 16 and 30 s each. For the following steps the deposition time was doubled. After eight minutes there was a jump ahead to 30 minutes of sodium exposure. This last step was repeated once. After each step, the film was transferred under vacuum conditions to the analysis chamber and was analysed by XPS and UPS.
The Daisy-Sol system is equipped with a VG Escalab 250 photoelectron spectrometer. For XPS measurements a monochromated Al-Kα X-ray source (1486.6 eV) was used. The hemispherical photoelectron analyzer was operated with a constant analyzer energy of 50 eV pass energy for survey spectra and 10 eV pass energy for detailed spectra with an energy resolution of about 400 meV. The valence spectra have been recorded with UPS with an excitation energy of He I (21.2 eV). The work function was determined by the secondary electron cut-off. Under ultra-high vacuum the Mo-foil was cleaned additionally with argon ion sputtering until all carbon and oxygen species vanished from the surface.
All spectra of XPS and UPS have been calibrated to the Fermi edge and the core level lines of argon ion sputtered gold, silver and copper foil. For fitting the spectra Voigt functions and Shirley background subtraction were applied. To adjust relative intensities of different core emission peaks, cross sections of Scofield have been used. Overestimations of the stoichiometry caused by different information of depth in regions of heterogeneously distributed sodium were avoided by a post-adjustment of the early intensities.
For distinguishing the XPS and UPS spectra they are marked with the total deposition time for each step. In the text the step numbers are marked with “#”.
The values of the mean free path length of photoelectrons in TCNQ have been calculated using the software NIST Electron Inelastic-Mean-Free-Path Database, Version 1.2.
Results
XPS and UPS measurements
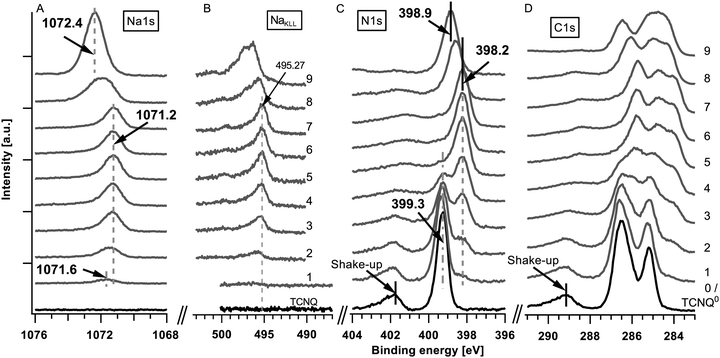
The detailed XPS spectra of the deposited sodium (Na1s and NaKLL) and TCNQ (N1s and C1s) are shown in Fig. 2. The corresponding secondary electron edge (work function) and the valence band can be found in Fig. 3.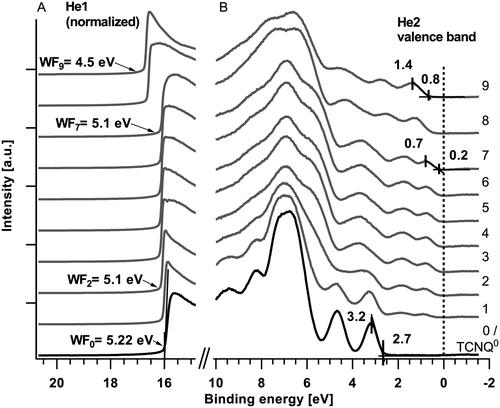 | ||
| Fig. 3 UPS spectra of the secondary electron edge or work function (A) and the valence band (B). The UPS spectra of the secondary electron edge are measured with He1 and the valence bands are measured with He2 radiation. The deposition times are in agreement with those of Fig. 2. | ||
The XPS analysis of the pristine film shows (Fig. 2(C) and (D) #0/black curves at the bottom) the well-known signature of TCNQ including the shake-up peak approximately 2.6 eV at higher binding energies in relation to the core level peaks (399.3 eV for N1s) for the N1s and C1s core levels.
During the first three deposition steps of sodium onto TCNQ a sodium peak appears at 1071.6 eV and shifts with an increasing intensity of about 0.4 eV towards lower binding energies (Fig. 2(A), step #1 to #3). The N1s at 399.3 eV and the C1s peak of TCNQ both show an additional emerging feature approximately 0.9 eV lower in binding energy while the peaks of TCNQ0 reveal a minor shift of about 0.1 eV towards higher binding energies. The work function calculated from the difference of the exciting energy and the secondary electron edge (Fig. 3(A)) reduces until step #2 from 5.22 eV to 5.1 eV. Native deposited TCNQ shows a valence band maximum of 3.2 eV (Fig. 3(B)) and a valence band on-set of 2.7 eV. Upon exposing TCNQ to sodium vapour new valence band states appear in the former band gap at about 0.7 eV with the onset at 0.2 eV.
In the following steps (#3 to #7) of sodium deposition the intensity respectively the peak area as well as the peak shape of Na1s (1071.2 eV) remains unchanged while the new components of N1s and C1s continue growing until they finally almost replace the signature of TCNQ0. The work function remains unchanged and the valence band shows no change with respect to the onsets, the shape and the relative intensities in the valence band signature. According to the binding energy of the sodium Auger emission NaKLL of steps #3 to #7 in Fig. 2(B) and literature values19 the Na1s emission is allocated to intercalated sodium.
In step #8 the Na1s peak nearly doubles in the full-width half-maximum (FWHM) as well as in the peak area. This is an indication for a new component forming a second peak at higher binding energies relative to the previous peak position. In the last deposition step the Na1s peak has a slightly reduced FWHM compared to step #8 but the intensity increases from step #7 nearly by a factor of 2.5. The peak maximum is approximately 1.2 eV shifted to higher binding energies.
In steps #7 to #9 only minor changes can be observed in the spectra of the N1s and C1s. In the last step #9 the signature of C1s reveals more pronounced changes while the N1s peak remains unaltered. From steps #7 to #9 the N1s and C1s peak as well as the valence band shift approximately 0.6 to 0.7 eV towards higher binding energies. The work function decreases about 0.6 eV to 4.5 eV.
Besides the core emissions of sodium and TCNQ oxygen emissions (O1s) and the molybdenum signal Mo3d of the substrate have also been monitored.
Throughout the experiment no O1s photoemission could be observed. The Mo3d signal is damped from step to step before it vanishes completely at step #7, indicating full coverage of the film.
The ratios of N1s/C1s and Na1s/N1s calculated from the peak intensities in Fig. 2 are shown in Fig. 4 considering the complete TCNQ emissions.
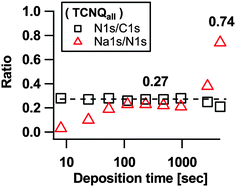 | ||
| Fig. 4 N1s/C1s stoichiometry of TCNQ core level lines and ratios of Na1s compared to N1s of TCNQall. | ||
During the entire insertion experiment the intensity ratio between N1s and C1s was determined to be 0.27 for the complete TCNQ signal. This value shows a good correlation with the theoretical stoichiometry of N/C = 4/12 = 1/3 in TCNQ (compare Fig. 1).
Calculating the content of Na1s in relation to N1s of the complete signal TCNQall we find for the midsteps of insertion a plateau value of about 0.27 which corresponds on average to the insertion of 1.1 electrons or sodium cations per TCNQ molecule. For the plateau we assume a balancing of the deposition rate of sodium onto TCNQ and the diffusion rate of sodium deeper into TCNQ. With increasing deposition time the ratio of Na1s/N1s increases to approximately 0.74 which accords to 3 electrons per TCNQ molecule (for more details see the discussion part about the evaluation of the composition).
Discussion
Core levels/evolution of phases
As already done in the last section also in the following discussion of the results the sequence of deposition steps is divided into three parts: the first until step #3, the second from steps #3 to #7 and the third part from steps #7 to #9.The data indicate that sodium is inserted in the film and TCNQ is successively reduced to TCNQx−. The reduction takes place under the formation of new electronic states in the valence band, which are known to be polaronic states.20 For the addition of an electron on a TCNQ molecule, Lin et al. showed that the former LUMO of TCNQ0 shifts down below the Fermi level due to an orbital rearrangement. It forms the new first HOMO state. The second HOMO at about 1.8 eV binding energy results from the former HOMO state which shifted upwards.11
Due to the charge transfer from the sodium to the electron acceptor material TCNQ the Fermi level shifts upwards as seen from the slightly increased binding energies (approx. 0.1 eV) of N1s and C1s core levels and the decrease in work function respectively. The substantially higher decrease of the Na1s core level binding energy is attributed to the changing Madelung energies during formation of reduced TCNQ. The reduced TCNQ (TCNQx−) which has already been reported by Giergiel et al.21 and Precht et al.18 can be observed by the new components within the N1s and C1s spectra which are shifted 0.9 eV to lower binding energies.
The literature22 indicates that TCNQ is present as a dimer [TCNQ2]2− and we presume that this is also the case in our experiment. The formation of dimers involves splitting of the bands23 up to approximately 100 meV. By considering the energetic resolution of the used photoelectron spectrometer, in XPS, we are not able to distinguish detail spectra between monomers and dimers. Therefore we denote the different spectral features of pure and reduced TCNQ as TCNQ0 and TCNQx−.
In summary, the results of the XPS measurements are in line with an increasing insertion of sodium and a change in composition, respectively, in the near-surface region.
The evolution of the N1s and C1s core levels demonstrate the continuing insertion of sodium into the TCNQ thin film. From the constant sodium emission we conclude that insertion occurs more in the bulk of the film and that the composition of the near-surface region remains unaltered. Due to the high binding energy of sodium the Na1s photoelectrons offer the smallest mean free path length (approx. 1.6 nm), i.e. the least depth of analysis compared to N1s and C1s (with a mean free path length of 3.3 nm and 3.6 nm respectively). Using surface sensitive XPS a depth of approximately three times the mean free path length of the photoelectrons can be monitored. This means that changes at a greater depth than 5 nm cannot be observed in the sodium emission, but only in the N1s and C1s emissions. The data are thus in line with a constant composition in the near-surface region and a diffusion of sodium into the bulk of the organic material.
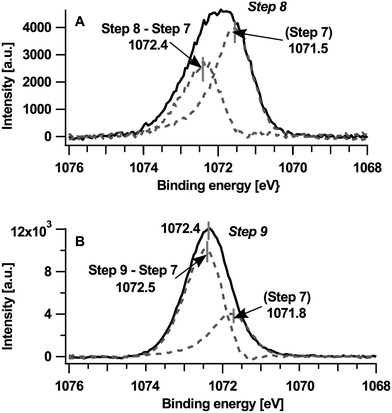
The common shift of 0.6 eV towards higher binding energies in the core level emissions of TCNQ as well as in the UPS measurements can be explained by a Fermi level shift similar to the 1st part caused by a changed composition of the surface near region. To reveal the spectra of the new component of Na1s at higher binding energies the peak of step #7 has been subtracted from step #8 (picture A in Fig. 5) and also from step #9 (picture B in Fig. 5). The right peak at 1071.8 eV can be correlated with the already known Na1s peak from step #7 only shifted for approx. 0.6 eV of the general binding energy shift (in step #9) towards higher binding energies.
Principally, the peak on the left-hand side could indicate both the presence of metallic sodium or sodium oxide, which we rule out in the present case, however. If metallic sodium would be present the NaKLL Auger spectrum on the right side in Fig. 2(B) should show a peak of metallic sodium at around 492.1 eV24 which is not observed. Also, neither distinctive structures25 of the surface nor bulk plasmons typical for metallic sodium are observed. Sodium oxide is not present in our sample due to the absence of oxygen (O1s and OKLL) emissions.
The increasing intensity of the sodium peak reveals a continuing insertion of sodium into TCNQ in the near-surface region. It is straightforward to assume that the increased content of sodium is associated with a further reduction of TCNQ, i.e. from TCNQ1− to TCNQ2−. The presence of two reduced states of TCNQ is also expected from electro-chemical insertion into TCNQ.26 Therefore we attribute the left peak to sodium ions associated with TCNQ2− at a binding energy of 1072.5 eV. While the Na1s peak of step #7 shifts as shown in Fig. 5(A) by 0.3 eV to higher binding energies the peak of TCNQ2− shifts only 0.1 eV to higher binding energies. Therefore the binding energy shift of the Na1s peak cannot be explained alone by a change in the Fermi level. Similar to the Na1s shifts in the first part (#1–#3) we presume a variation of the Madelung potential as a cause.
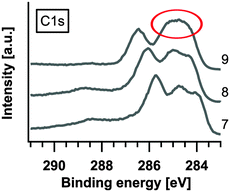
The C1s peak reflects the formation of TCNQ2−, albeit only slightly (see also the extract in Fig. 6). In contrast to the C1s peak the N1s peak does not show changes in the peak signature of deposition step #9. We expect the reason to be found in the structure of TCNQ2−. Bond et al. calculated the structure of Na+TCNQ1− from X-ray diffraction measurements, and concluded that the sodium ions are ordered in channel like structures.26 In the present case, we presume that the sodium ions are also placed between the layer stacked molecules where they mainly affect the carbon in the C6-ring and not the nitrogen which points to the direction of the occupied channels. Slow ion diffusion through the Na+TCNQ1− structured layer, present in the last steps of the experiment, probably leads to the further enrichment of the near-surface region with sodium ions, i.e. the formation of 2 Na+TCNQ2−.
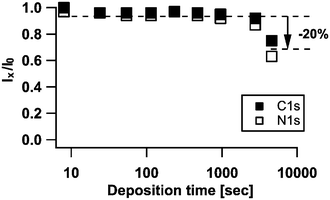
By calculating the damping of the C1s and N1s peaks compared to TCNQ0 for each deposition step we find (in Fig. 7) an outstanding decrease of about 20% of the peak intensities both for C1s and N1s while all previous steps exhibit only a decrease up to approximately 10%.
A decrease of such an amount in intensity for the TCNQ signals and the strongly increased intensity of Na1s in the last step #9 (in Fig. 2(A)) indicate the formation of a layered structure near to the surface, in which the additional sodium ions in TCNQ2− are placed in a top layer of the organic film. For inorganic materials this effect has been investigated by Schellenberger et al.27
The different stages of the experiment are summarized in Fig. 8, with the experiment proceeding from left to right. In the first stage the insertion of sodium in TCNQ changes the surface composition, resulting in the formation of Na+TCNQ− and a shift of the Fermi level. In the second stage the surface composition remains unchanged as sodium diffuses into the film and is inserted more in the bulk of the film. In this stage the Fermi level is constant. In the last stage, 2 Na+TCNQ2− is formed in the near-surface region due to slow diffusion of sodium into the bulk, resulting in a shift of the Fermi level again. The typical colour change28 upon sodium insertion into TCNQ is shown in the lower part of Fig. 8.
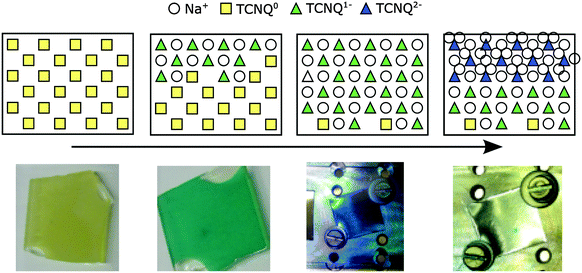 | ||
| Fig. 8 Top: scheme for insertion of sodium into a top layer of TCNQ near to the surface (from left to right). Bottom: the color of TCNQ samples depend on the content of intercalated sodium. | ||
In the following section the composition of the different layers is evaluated in more detail with respect to the reduced species of TCNQ (TCNQx−). Due to the very low thickness of the near-surface region the information depth of the XPS analysis has to be considered during the evaluation of its composition.
For calculations of stoichiometry the N1s peak is used to distinguish between negatively charged and uncharged TCNQ. The C1s peak is less convenient due to the complex peak structure which can be hardly fitted. The N1s spectra of the TCNQx− (a mixture of TCNQ1− and TCNQ2−) in Fig. 9 are obtained by graphical subtraction of the N1s peak of step #0 (representing TCNQ0).
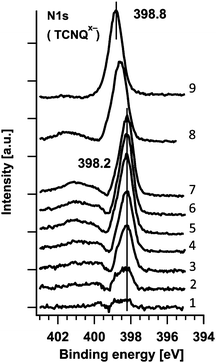 | ||
| Fig. 9 N1s spectrum of TCNQx− evaluated by subtracting the TCNQ0 spectrum from the mixed TCNQ0 + TCNQx− spectra. | ||
As discussed before, the Na1s peak of the last deposition step (#9) is a superposition of TCNQ2− and TCNQ1−. Due to full overlap of the Na1s peaks (see the lower picture in Fig. 5) the damping of the TCNQ1− peak cannot be estimated accurately and step #9 has not been considered for the calculation of ratios.
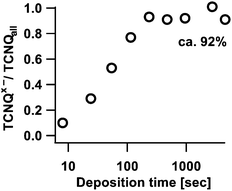
Fig. 10 shows that the ratio between negatively charged TCNQx− (which could be TCNQ− and/or TCNQ2−) and TCNQ0 runs into a saturation of approximately 92%. Obviously, a small amount of approximately 8% of TCNQ stays unaffected by sodium insertion. A possible explanation could be a lateral inhomogeneous diffusion of sodium into TCNQ.
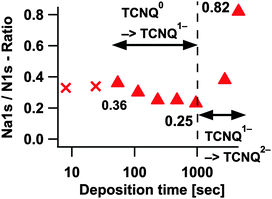
The evaluation of the surface composition revealed (Fig. 4), by considering the complete signal of TCNQall, a loading of 1.1 and 3 electrons per TCNQ molecule for the second part and deposition step #9. Since all TCNQ molecules with neighbouring sodium ions form TCNQx− the evaluation of the surface composition has been iterated in Fig. 11, neglecting peaks from TCNQ0. As there is no evidence for sodium oxide or metallic sodium we suggest that every sodium atom takes part in the formation of TCNQx−.
Since in Fig. 2 and 9 Na1s and N1s reveal very low peak intensities in step #1 and #2, they will not be further considered here (marked as crosses in Fig. 11). Deposition step #3 gives the first reliable value of approximately 0.36 which would mean 1.4 sodium ions or electrons respectively per TCNQ molecule. Adding more sodium decreases the ratio to 0.25 (one electron per molecule) prior to an increase to a value of 0.82 (approx. 3.3 electrons per molecule). The decrease of the Na1s/N1s ratio at deposition steps without homogeneously distributed sodium in TCNQ, during the formation of TCNQ1− or TCNQ2−, can be explained by the already known different information of depth of Na1s and N1s.
In Fig. 12 the thereby caused overestimation of the Na1s/N1s ratio due to the different information depth of the signal has been removed.
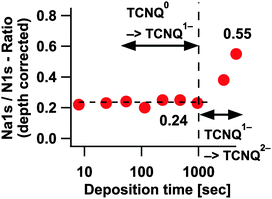 | ||
| Fig. 12 Na1s/N1s ratio without the overestimation in the first steps of each transformation process. | ||
After the depth correction we obtain for the first transformation process TCNQ0 → TCNQ1− a Na1s/N1s ratio of about 0.24 or approx. one electron or sodium ion per TCNQ molecule respectively. Presuming the same overestimation of sodium for the second process TCNQ1− → TCNQ2− as for the first process a ratio of 2.2 sodium ions per molecule or an electron transfer rate respectively can be estimated (0.55 Na1s/N1s). The value settles in the range of the transfer rate of 2.3 reported by Tobishima et al.14
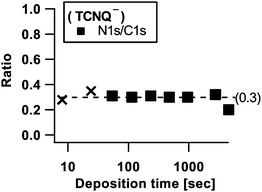
In order to check the integrity of the reduced TCNQ molecules, the N1s/C1s ratio has been calculated for TCNQx− in Fig. 13 in the same manner as for TCNQ0. The N1s/C1s ratio results in 0.3, which is in line with the non-degenerated theoretical stoichiometry implied by Fig. 1.
Valence band/electronic structure
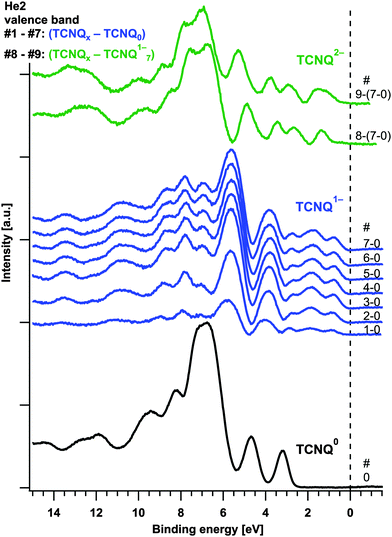
The superposition of the core levels leads to the assumption that Fig. 3(B) shows the overlay of different valence band signatures. By graphical subtraction of the TCNQ0 spectrum of the spectra of steps #1 to #7 the valence band of the TCNQ1− can be obtained. By subtraction of this spectrum of the last two spectra (# 8 and #9) another valence band signature was gained. We propose this spectrum to belong to the valence band of TCNQ2−. The valence bands of TCNQ0 and the calculated spectra of TCNQ1− and TCNQ2− are shown in Fig. 14.In the HOMO of the green coloured valence bands of TCNQ2− slight changes are still recognizable. As we can see in Fig. 12 there is no plateau for the TCNQ1− → TCNQ2− process for the Na1s/N1s ratio we attribute the small changes in the HOMO region of TCNQ2− to the incompletely developed phase of TCNQ2−.
The separated valence band signatures indicate the presence of three individual phases. With further exposition of the sample to sodium vapour, relative changes between the first and second HOMO of TCNQ1− cannot be observed.
In Fig. 8 the formation of a TCNQ2− layer near to the surface was proposed. For the He2 valence band we expect a stronger damping of the TCNQ0 signals compared to the N1s peaks due to the lower kinetic energy of the He2 photoelectrons. During the subtraction of the TCNQ0 signal from the mixed valence band spectra we found, however, that the damping of the TCNQ0 signal is less for the valence band than for the N1s detail peak however (see Fig. 15).
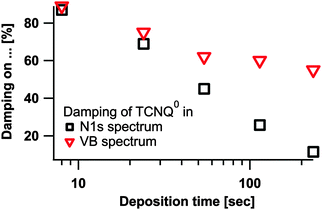 | ||
| Fig. 15 Damping of the TCNQ0 signal in the valence bands and in the N1s spectra compared to the first step #0. | ||
This effect can be explained by a lateral inhomogeneous diffusion of sodium into the sample. This is also supported by the calculation of the TCNQx−/TCNQall ratio (in Fig. 10).
The results of XPS and UPS measurements are illustrated in band diagrams in Fig. 16. Besides TCNQ0 the electronic structures for TCNQ1− and TCNQ2− are also given.
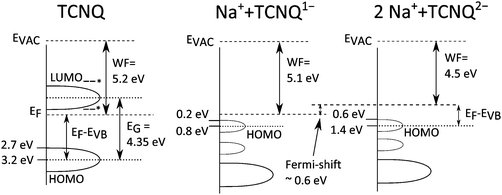 | ||
| Fig. 16 Band diagram including results of XPS and UPS measurements of TCNQ exposed to sodium vapour. Possible positions of the TCNQ HOMO are marked with stars.9,29 | ||
Correlation of Fermi-level and redox potentials
During the last two deposition steps of sodium onto TCNQ the XPS and UPS measurements reveal a shift of the Fermi level of approximately 0.6–0.7 eV upwards in the band diagram of TCNQ (in Fig. 16). As shown by Tobishima et al. and Hanyu et al.6,14 TCNQ can be used as an electrode material for battery applications. The organic material shows two redox potentials. Notably, the difference of the redox potentials, as measured by A.M. Bond et al. using liquid electrolytes, is about 0.55 V26 – a similar value like the Fermi level shift during the intercalation of sodium into TCNQ. Our own unpublished data from a battery with the TCNQ electrode and a solid electrolyte yield a difference of approx. 0.7 V which fits quite nicely to the shift of the Fermi level. According to our previously published paper,18 the Fermi level shift detected by photoelectron spectroscopy can directly be correlated with the electrode potential in a battery.Conclusion
A thin film of TCNQ was gradually exposed to sodium vapour, resulting in the insertion of sodium under reduction of TCNQ. The chemical and electronic structures as well as a work function of the sodium intercalated TCNQ were analysed by photoemission. The experiment proceeded in three stages as observed by near-surface composition and the Fermi level. In the first stage, the sodium content gradually increases (Na+TCNQ−/TCNQ mixed phase), in the second stage it remains unchanged (Na+TCNQ− phase) and in the last stage it gradually increases again (2 Na+TCNQ2−/Na+TCNQ− mixed phase). During the whole experiment, TCNQ0 is also observed which we attribute to inhomogeneous insertion of sodium into the film.For the Na+TCNQ− phase the ratio of TCNQ− to Na+ is 1, for the 2 Na+/TCNQ2− type phase the ratio of TCNQx− to Na+ is 2.2 for the highest sodium content. The gradual increase of sodium in the mixed phases is accompanied by changes in the Fermi level. The Fermi level difference between pure TCNQ and the Na+TCNQ− phase is 0.1 eV, and the difference to the phase with the highest sodium content is 0.7 eV.
The gradual sodium insertion and phase evolution is reflected in the valence band spectra. The insertion of sodium takes place under polaron formation. We present the valence band spectra of TCNQ− as well as TCNQ2−, showing distinctive differences. In contrast, the difference in the N1s and C1s core levels is less pronounced. We observe binding energy shifts in the Na1s emission, which we attribute to changes in the Madelung potential.
The Fermi level shifts can be correlated with the electrode potential of the sodium intercalated TCNQ. We find no indication of the degradation of TCNQ upon sodium insertion within the limits of the experimental technique. The results point towards a slow diffusion of sodium in the phases with high sodium content. These results underline that these materials are candidates for ion electrodes, albeit with kinetic limitations.
Acknowledgements
This research was funded by Novaled AG, Germany, and Sächsische Aufbaubank, Germany, under the project 100085111. We also would like to acknowledge funding by the BMBF (Bundesministerium für Bildung und Forschung).References
- (a) H. Akamatu, H. Inokuchi and Y. Matsunaga, Bull. Chem. Soc. Jpn., 1956, 29, 213–218 CrossRef; (b) M. M. Labes, R. Sehr and M. Bose, J. Chem. Phys., 1960, 33, 868–872 CrossRef CAS.
- (a) K. Brunner, et al. , J. Am. Chem. Soc., 2004, 126, 6035–6042 CrossRef CAS; (b) A. P. Kulkarni, et al. , Chem. Mater., 2004, 16, 4556–4573 CrossRef CAS.
- G. Li, et al. , Nat. Mater., 2005, 4, 864–868 CrossRef CAS.
- T. Mayer, et al. , Proc. SPIE – Int. Soc. Opt. Eng., 2008, 7052, 705212 CrossRef.
- L.-L. Chua, et al. , Nature, 2005, 434, 194–199 CrossRef CAS PubMed.
- Y. Hanyu and I. Honma, Sci. Rep., 2012, 2, 453 Search PubMed.
- B. Scrosati and J. Garche, J. Power Sources, 2010, 195, 2419–2430 CrossRef CAS.
- B. Scrosati, Polymer electrodes, Cambridge University Press, Cambridge, 1994, vol. 5 Search PubMed.
- K. Kanai, et al. , Appl. Phys. A: Mater. Sci. Process., 2009, 95, 309–313 CrossRef CAS.
- S. Braun, et al. , Org. Electron., 2010, 11, 212–217 CrossRef CAS.
- S. F. Lin, W. E. Spicer and B. H. Schechtman, Phys. Rev. B: Condens. Matter Mater. Phys., 1975, 12, 4184–4199 CrossRef CAS.
- (a) R. J. Hurditch, V. M. Vincent and J. D. Wright, J. Chem. Soc., Faraday Trans. 1, 1972, 68, 465–477 RSC; (b) R. G. Kepler, P. E. Bierstedt and R. E. Merrifield, Phys. Rev. Lett., 1960, 5, 503–504 CrossRef CAS; (c) J. B. Torrance, Acc. Chem. Res., 1979, 12, 79–86 CrossRef CAS.
- P. Nielsen, A. J. Epstein and D. J. Sandman, Solid State Commun., 1974, 15, 53–58 CrossRef CAS.
- S.-I. Tobishima, J. Electrochem. Soc., 1984, 131, 57 CrossRef CAS.
- News: Lithium (Li) Vorkommen weltweit – globale Vorräte 2011, available at: http://www.solar-und-windenergie.de/blog/?p=1241, accessed 30 July 2014.
- S. Wenzel, et al. , Energy Environ. Sci., 2011, 4, 3342 CAS.
- (a) Q.-H. Wu, A. Thissen and W. Jaegermann, Appl. Surf. Sci., 2005, 250, 57–62 CrossRef CAS; (b) W. Jaegermann and D. Tonti, New Trends in Intercalation Compounds for Energy Storage. Proceedings of the NATO Advanced Study Institute on New Trends in Intercalation Compounds for Energy Storage, 2002.
- R. Precht, R. Hausbrand and W. Jaegermann, Phys. Chem. Chem. Phys., 2015, 17, 6588–6596 RSC.
- D. Sun, et al. , J. Mater. Chem. A, 2014, 2, 12999–13005 CAS.
- G. Horowitz, J. Mater. Chem., 1999, 9, 2021–2026 RSC.
- J. Giergiel, et al. , Surf. Sci., 1991, 255, 31–40 CrossRef CAS.
- (a) I. Shirotani and N. Sakai, J. Solid State Chem., 1976, 18, 17–25 CrossRef CAS; (b) M. J. Rice, V. M. Yartsev and C. S. Jacobsen, Phys. Rev. B: Condens. Matter Mater. Phys., 1980, 21, 3437–3446 CrossRef CAS; (c) V. Dong, et al. , Acta Crystallogr., Sect. B: Struct. Crystallogr. Cryst. Chem., 1977, 33, 2428–2431 CrossRef.
- J. J. Novoa, et al. , CrystEngComm, 2002, 4, 373 RSC.
- P. Steiner, et al. , Phys. Status Solidi B, 1978, 90, 45–51 CrossRef CAS.
- P. Steiner, H. Höchst and S. Hüfner, Z. Phys. B: Condens. Matter, 1978, 30, 129–143 CAS.
- A. M. Bond, P. G. Symons and S. Fletcher, Analyst, 1998, 123, 1891–1904 RSC.
- A. Schellenberger, et al. , Surf. Sci. Lett., 1991, 241, L25–L29 CAS.
- M. S. Khatkale and J. P. Devlin, J. Chem. Phys., 1979, 70, 1851 CrossRef CAS.
- (a) C. E. Klots, J. Chem. Phys., 1974, 60, 1177 CrossRef CAS; (b) K. Imai, et al. , Tetrahedron, 2010, 66, 8012–8017 CrossRef CAS.
| This journal is © the Owner Societies 2016 |


