
 Open Access Article
 This Open Access Article is licensed under a Creative Commons Attribution-Non Commercial 3.0 Unported Licence
Molecular structure and vibrations of NTCDA monolayers on Ag(111) from density-functional theory and infrared absorption spectroscopy†
Ralf
Tonner
*ab,
Phil
Rosenow
a and
Peter
Jakob
*bc
aFachbereich Chemie, Philipps-Universität Marburg, 35032 Marburg, Germany. E-mail: tonner@chemie.uni-marburg.de
bWissenschaftliches Zentrum für Materialwissenschaften (WZMW), Philipps-Universität Marburg, 35032 Marburg, Germany
cFachbereich Physik, Philipps-Universität Marburg, 35032 Marburg, Germany. E-mail: peter.jakob@physik.uni-marburg.de
First published on 3rd February 2016
Abstract
The structure and vibrational properties of the metal–organic interface of 1,4,5,8-naphthalene-tetracarboxylic dianhydride (NTCDA) on Ag(111) were analysed using Fourier-transform infrared absorption spectroscopy in conjunction with density functional theory calculations including dispersion forces (PBE-D3). Mode assignments and polarizations as well as molecular distortions were determined for four adsorption geometries of NTCDA on top and bridge sites aligned either parallel or perpendicular to the Ag rows and compared to accurate calculations of the free molecule. This enables an in-depth understanding of surface effects on the computed and experimental vibrational spectra of the adsorbed NTCDA molecule. The molecule–substrate interaction comprises two major and equally important contributions: non-directional van der Waals forces between molecule and surface, and covalent bonding of the acyl oxygen atoms with underlying Ag atoms, which is quantified by charge-transfer analysis. Furthermore, adsorption energy calculations showed that the molecular axis of flat-lying NTCDA is oriented preferably in parallel to the Ag rows. The molecule is subject to particular distortions from the planar gas phase structure with covalent bonding leading to downward bending of the acyl oxygen atoms and Pauli repulsion to upward bending of the carbon core. In parallel, strong buckling of the silver surface was identified. As found in previous studies, the lowest unoccupied molecular orbital (LUMO) of the molecule slips below the Fermi level and becomes partially populated upon adsorption. Excitation of totally symmetric vibrational modes then leads to substantial interfacial dynamical charge transfer, which is convincingly reproduced in the calculated IR spectra.
Introduction
Metal–organic interfaces represent key elements of optoelectronic devices like light emitting diodes or field effect transistors as the macroscopic device performance is often affected by structural and electronic properties at the atomic scale. The understanding of complex interfaces is, however, still limited and model systems are needed for further advancement of methods, which can subsequently be applied to more realistic interfaces. In general, the quality of organic films critically depends on the properties of the metal–organic interface and a comprehensive characterization of the first organic layer on the metal substrate (contact primer layer) is of vital importance for an improved understanding of the growth kinetics of organic layers with well-defined properties. A profound understanding of internal interfaces may therefore be attained by analysing the first monolayer in detail. Preferentially, such studies are conducted using techniques which are likewise applicable to internal interfaces, such as infrared absorption spectroscopy (IRAS).The interaction of large organic molecules with solid substrates at metal–organic interfaces comprises different contributions.1,2 Firstly, covalent bonds can be formed which are directional and closely related to the electronic structure of the molecule and the substrate, with particular emphasis on molecular orbitals located at or near the Fermi level of the substrate. Secondly, isotropic dispersion interactions are non-directional and site-insensitive and depend only on distance and polarizability of the atoms involved. In addition, characteristics of the molecular structure as well as the atomic arrangement and relaxations of the substrate atoms need to be taken into account.3 Aside from the molecule–substrate interactions, lateral forces among adsorbates come into play when lateral ordering and phase transformations are considered.
As a model system for a moderately strong molecule–substrate coupling, we have chosen 1,4,5,8-naphthalene-tetracarboxylic dianhydride (NTCDA) molecules deposited onto a Ag(111) surface.4–10 NTCDA is a planar molecule with D2h symmetry (Scheme 1) thus exhibiting a short and a long molecular axis. NTCDA features two functionalities for bonding interactions with the surface: (i) The extended π-electron system associated with the naphthalene core and (ii) the acyl groups at the long ends of the molecule as part of the acid anhydride moieties. The suitability of NTCDA as a model system thereby stems from the possibility to employ these two functionalities, leading to a substrate-dependent delicate balance between covalent and dispersive bonding contributions. Modifications of the covalent bonds in the molecule, symmetry reduction upon adsorption, or localized bonding interactions with surface atoms may then be directly reflected in the vibrational spectrum and associated displacement patterns of normal modes. A detailed analysis of the IRAS spectra can therefore be used to test possible bonding configurations and obtain relevant information. In particular, changes in adsorption geometries could be identified as such, even in cases where the relative adsorbate–surface arrangement changes only marginally. These different adsorption geometries can have a crucial influence for the growth of the organic layer. Convenient features of IRAS thereby are its non-destructiveness and the ability to obtain information on mode polarizations and molecular symmetries by applying dipole and metal–surface selection rules.
 | ||
| Scheme 1 1,4,5,8-naphthalene-tetracarboxylic dianhydride (NTCDA) with nomenclature. The ‘long’ axis (x) connects the two anhydride oxygen atoms. The short axis (y) is aligned perpendicular to it. Coordinate system is chosen according to convention for surface science (z-axis perpendicular to surface/molecular plane of parallel oriented NTCDA). | ||
We note that even though vibrational spectra inherently contain a multitude of specific information, especially related to the bonding configuration, an in-depth discussion usually requires comparison to computational modelling. The method of choice in the surface and materials sciences is density-functional theory (DFT). The main reason is the ability of DFT to treat realistic system sizes with good accuracy,11,12 especially for the case of organic molecules on metal surfaces,13 although major challenges for DFT have also been proposed recently.14 An important development in recent years was tackling the problem of missing description of dispersion interactions in most exchange–correlation functionals. Several groups work actively on solving this issue.15–19 Semi-empirical atomic pairwise approaches (e.g. DFT-D3) have demonstrated to work reliably for molecular as well as periodic systems in the past.20–26 Other methods are also in use for this methodological challenge. For PTCDA on different metal substrates, Ruiz et al. could show good agreement with experimental structures by an extended DFT-vdW approach.27 A recent study also found the DFT-D3 approach being accurate for this system.3
In such a combined approach, several challenges need to be addressed on both, the experimental and theoretical sides. Due to the large unit cells encountered in organic monolayer systems, the feasibility of accurate calculations represents a serious concern. This is aggravated by the large number of vibrational modes, which often cannot be attributed to localized functional groups but instead must be designated skeletal vibrations involving most atoms of the ring.28–30 The approach we are pursuing in this study is to develop a detailed understanding of the vibrational spectrum of the free molecule and – in a second step – analyse the changes in the spectrum upon adsorption on the metal surface. By combining the molecular with the periodic approach, we retrieve the best of both worlds, namely, the possibility to benchmark our DFT data in the molecular approach, while designating mode symmetry to all vibrations together with the consideration of the metallic environment in the periodic approach of the adsorbed molecule. This allows a quantification of the substrate's influence on the vibrational spectrum.
On the experimental side, the major difficulty concerns detection sensitivity, especially in conjunction with identifying weak modes with distinct polarizations being indicative of a possible reduction in adsorption site symmetry. In previous work we have demonstrated our capabilities to reproducibly prepare well defined organic monolayer films.31,32 Besides spot profile analysis low energy electron diffraction (SPA-LEED) and thermal desorption spectroscopy (TDS), IRAS has been established as a powerful technique to characterize organic monolayer films in terms of their vibrational properties.32
The system studied here has served as a model system before, in particular regarding structural and electronic properties.4–10 NTCDA on Ag(111) forms two long range ordered phases, a commensurate (relaxed) and an incommensurate (compressed) monolayer phase.4,5,31,32 Whereas the former is readily produced by annealing a thicker layer to 400 K, the latter requires some more refined processing.31 In both cases a planar adsorption geometry prevails according to near edge X-ray absorption fine structure data.6,8 Despite this parallel orientation, in-plane vibrational modes are found to display substantial dynamic dipole moments perpendicular to the surface, which is attributed to a pronounced NTCDA–Ag(111) interfacial dynamical charge transfer (IDCT),31 very much alike PTCDA/Ag(111) which displays a similar signature of vibrational bands.33–35 This process has been associated with a partially filled molecular orbital at the Fermi energy εF subject to variations in energetic position, depending on vibrational motion.36 Indeed, the NTCDA lowest unoccupied molecular orbital (LUMO) is found to shift down in energy upon adsorption and is located slightly below εF,7 based on ultraviolet photoemission spectroscopy (UPS). In our study this experimental finding is confirmed by DFT computations.36
From normal incidence X-ray standing wave (NIXSW) experiments, the vertical positions of carbon and oxygen atoms with respect to bulk Ag atom positions were determined.9,10 These represent key parameters to be compared with structural data derived from our calculations and will be discussed in-depth below.
In this study, we will present a detailed computational investigation of the structure and vibrational modes of free and adsorbed NTCDA molecules and compare these to the experimental IRAS measurements.
Methods
Experimental details
The IRAS experiments were carried out in a UHV chamber at a base pressure of 5 × 10⁻¹¹ mbar. The Fourier-transform infrared spectrometer (FTIR) was a Bruker IFS 66v/S with evacuable optics. The spectra were recorded using a liquid N2-cooled Mercury–Cadmium–Telluride detector (spectral range 600–5000 cm−1). We used polarized light throughout and selected a spectral resolution of 2 cm−1. IRAS measurements were obtained at a sample temperature of 28 K. Temperature measurements used a K-type thermocouple welded to the edge of the Ag(111) sample. The Ag(111) crystal was cleaned by Ar+ sputtering (30 min at Uion = 700 eV, Iion = 3 μA, and Tsample = 373 K) followed by annealing to 773 K for 5 min. NTCDA was evaporated from a home-made thermal evaporator at TNTCDA = 390 K (deposition rate of 0.2 ML min−1) controlled by a Pt1000 temperature sensor. During evaporation, the background pressure typically increases by Δp = 1 × 10⁻¹⁰ mbar.Computational details
The projection operators for the non-local part of the pseudopotentials were evaluated in real space with the exception of the linear response calculations. The Brillouin zone for the adsorption studies was sampled by a Γ-centred 3 × 3 × 1 k-point mesh generated via the Monkhorst–Pack method.51 The Ag bulk structure was optimized with Ecutoff = 350 eV and a Γ-centred 25 × 25 × 25 k-mesh. All calculations employed the precision parameter setting “accurate”.
Structural optimization was performed starting from different initial structures by means of a conjugate-gradient or quasi-Newton algorithm for ionic positions and cell parameters until the forces converged to 1 × 10⁻² eV Å−1 and the energy during SCF cycles converged to 10−5 eV. Vibrational frequencies at the Γ-point of the periodic cell were calculated through building up the force constant matrix either via a density-functional perturbation theory (DFPT)52–54 and alternatively via a finite difference approach. IR intensities were calculated in a dynamic dipole-derivative ansatz considering only the component of the dipole moment change normal to the surface plane upon displacement. The vibrational frequencies have been determined from a partial hessian obtained by displacing only the NTCDA-atoms. A test with inclusion of the top-most Ag-layer in the force-constant calculation did not show a significant change of the frequencies (Δν = −0.05 cm−1).
The adsorption energies were calculated by subtracting the energy of the surface–adsorbate complex from the total energies of the relaxed Ag(111) substrate layers and the relaxed adsorbate molecule. Dispersion effects have been considered by the semi-empirical correction scheme proposed by Grimme in the D3 formulation41 (with “Becke-Johnson”-type damping function)42 in an implementation by Möllmann and Grimme.23 This methodology is abbreviated PBE-D3PBC in the following. For comparison, some values were derived with the older DFT-D2 version as well (PBE-D2PBC).55 All vibrational calculations were carried out in the harmonic approximation and representations of IR-spectra used a Lorentzian broadening with a 5 cm−1 full width at half maximum (FWHM). The intensities of IR-active modes are normalized to the most intense mode.
AIM atomic charges have been computed with a grid-based algorithm.56 The density of states (DOS) was obtained with the lobster 2.0.0 code57–59 by projection to a local basis set.60
Regarding the Ag(111) surface, relaxation effects are to be expected relative to the bulk positions. The four-layer slab model employed here (two bottom layers fixed) gives the correct relaxation sign and magnitude for the change of the first (Δd12/db = −0.9%) and the second interlayer spacing (Δd23/db = −0.3%) relative to the bulk spacing (db), when compared to LEED62 and X-ray scattering studies.63 Note that the LEED study showed that the third interlayer spacing is the same as the bulk interlayer spacing thus legitimating our four-layer slab approach. More refined results would need the consideration of finite-temperature effects which have been discussed in the past but are not the aim of this study.64
Results and discussion
Computational results
NTCDA is known to adsorb reversibly onto Ag(111) with desorption temperatures of about 430 K (low-coverage limit). The interaction of the molecules with the substrate thereby comprises two contributions, (i) the ubiquitous van der Waals interaction and (ii) a covalent binding component stemming from the interaction of the acyl groups at both ends of the molecule with Ag substrate atoms. The strength of the latter interaction is underlined by a pronounced out-of-plane displacement of the acyl oxygen atoms towards the surface, which is accompanied by an opposite vertical shift of the anhydride oxygen atoms.9,10 Specifically, the NIXSW experiments found an overall distance of 2.997 Å for the naphthalene core, a value much smaller than expected for van der Waals interactions alone. These observations are very similar to the findings of PTCDA, the perylene equivalent of NTCDA.65,66 We stress that the NIXSW measurements used an averaged C1s signal for all carbon atoms of NTCDA, therefore comprising not only the naphthalene core but also the anhydride carbon atoms.67 Therefore, we will discuss values for the naphthalene core (CRing in Scheme 1) as well as averaged values for all carbon atoms (Call).In IR spectra, the donor–acceptor bonds between Ag and the acyl groups are reflected in a bold red shift of νC![[double bond, length as m-dash]](https://www.rsc.org/images/entities/char_e001.gif) O frequencies from the gas phase values, as proclaimed in a very recent study of ours.31 In the present study, a theoretical analysis of NTCDA structure and vibrations, both of the free molecule and adsorbed on Ag(111) will be presented. The arrangements of NTCDA on Ag(111) which have been investigated computationally are displayed in Fig. 1. The chosen setup has two advantages: (i) there will be only one type of adsorption site for NTCDA (as opposed to the relaxed NTCDA/Ag(111) monolayer with two inequivalent sites), which reduces the calculation effort substantially and simplifies the derived vibrational spectra. (ii) Lateral interactions between neighbouring NTCDA molecules, especially H-bonding, can be neglected. In the experiment, these conditions have been met by sub-monolayer deposition of NTCDA onto Ag(111) at low temperature (T ≈ 28 K). In the following, we will first discuss the structure and molecular distortion of adsorbed NTCDA and then present our vibrational mode analysis. Based on calculations of single (gas phase) NTCDA molecules, the effect of bonding to Ag(111) is derived.
O frequencies from the gas phase values, as proclaimed in a very recent study of ours.31 In the present study, a theoretical analysis of NTCDA structure and vibrations, both of the free molecule and adsorbed on Ag(111) will be presented. The arrangements of NTCDA on Ag(111) which have been investigated computationally are displayed in Fig. 1. The chosen setup has two advantages: (i) there will be only one type of adsorption site for NTCDA (as opposed to the relaxed NTCDA/Ag(111) monolayer with two inequivalent sites), which reduces the calculation effort substantially and simplifies the derived vibrational spectra. (ii) Lateral interactions between neighbouring NTCDA molecules, especially H-bonding, can be neglected. In the experiment, these conditions have been met by sub-monolayer deposition of NTCDA onto Ag(111) at low temperature (T ≈ 28 K). In the following, we will first discuss the structure and molecular distortion of adsorbed NTCDA and then present our vibrational mode analysis. Based on calculations of single (gas phase) NTCDA molecules, the effect of bonding to Ag(111) is derived.
 | ||
| Fig. 1 Adsorption sites of NTCDA on Ag(111), together with adsorption energies in kJ mol−1 (a–d), and supercell for bridge1-site adsorption of NTCDA (e), visualising the surface arrangement as calculated using DFT (PBE-D3PBC). Nomenclature analogous to Alkauskas et al.68 referring to the position of the C–C bond relative to the topmost Ag-layer. Bridge1 and top1 adsorption geometries have the molecular axis parallel to the Ag rows, while for bridge2 and top2 configurations the axis is perpendicular to Ag rows. | ||
 | ||
| Fig. 2 Structural parameters of NTCDA (top view) with the LUMO overlaid (isosurface with contour value 0.03). Calculated bond lengths of the free molecule (MP2/TZ and PBE-D3/TZ in italics, D2h) and the adsorbed molecule (PBE-D3PBC in bold, C2v) are given together with data from X-ray diffraction69 (underlined) of the NTCDA molecular crystal (Ci). | ||
The next step in the computations comprises the investigation of NTCDA adsorption on the Ag(111) surface. In the course of the structural optimization, the NTCDA molecular structure and the coordination with respect to Ag(111) was allowed to relax. Our use of dispersion corrected DFT ensures a constraints-free structural optimization to reach the energetic minimum. In order to account for the elasticity of the Ag(111) surface, the upper two layers were allowed to relax as well, while the two bottom layers have been kept at (calculated) bulk positions. For further discussion of the bulk and surface computations, see the computational details section.
Several possible adsorption sites were tested in the calculations as shown in Fig. 1. Adsorption energies (PBE-D3PBC) are also included in Fig. 1 and will be discussed below. It can be deduced from these data that an adsorption geometry with the central CC bond located above a bridge site of Ag(111) and with the (long) O–O axis aligned along Ag atom rows is most stable (Eads = 202 kJ mol−1, Fig. 1a, bridge1). We identified an alternative adsorption geometry with the central C–C bond located above an Ag atom and with the O–O axis again aligned along Ag atom rows (Fig. 1c, top1) showing a marginally lower adsorption energy (Eads = 196 kJ mol−1). Substantially weaker bonding, on the other hand, is found for both of these two sites but with a 90° rotated azimuthal orientation (Eads = 168 kJ mol−1 (bridge2), 170 kJ mol−1 (top2)).
Upon adsorption of the NTCDA molecule on the Ag(111) surface, the bonds within the molecule are distorted as depicted in Fig. 2 for the most stable adsorption geometry. In order to explain the distortion pattern it is instructional to recall the (partial) filling of the LUMO of the free molecule upon surface adsorption. This experimental observation7,70 is confirmed by our calculations (see below). Therefore, we have overlaid the isosurface plot of the LUMO of NTCDA with the molecular structure (Fig. 2). The filling of the molecular LUMO orbital upon adsorption leads to an increase in bond strength (and thereby a shortening) of those bonds where additional electron density is accumulated. Accordingly, all bonds at nodes of this orbital become elongated with respect to the free molecule. The comparison of PBE-D3PBC values for the free (computed with PBC in a large box) and adsorbed molecule in Fig. 2 fully supports this hypothesis.
In addition to the in-plane distortion, the NTCDA molecule significantly bends towards the surface (Fig. 3). This reduces the (local) molecular symmetry from D2h to (approximately) C2v. Minor deviations from the exact C2v symmetry are for example differences of the vertical distances for the C–H groups from Ag surface atoms amounting to Δz ≈ 0.002 Å, i.e. the variation is less than 0.1%. This could be due to the inequivalent threefold hollow sites below the two carbon rings of the naphthalene core (Fig. 3b) which would reduce the molecular symmetry to CS. The side view (Fig. 3c) clearly describes the downward bending of the acyl groups. The distortions in z-direction are reproduced in more detail in Fig. 3a and b. While the carbon and oxygen atoms of the acyl groups are significantly bent toward the surface, the anhydridic oxygen atoms experience an opposite bending with respect to the neighbouring C-atoms. Due to an overall warping of the molecular plane, these are nonetheless located below the plane, defined by the average height of carbon atoms forming the naphthalene core (CRing). This is in accordance with previous experimental and theoretical studies related to NTCDA and PTCDA monolayers.3,9,10,48,65,66,71 Moreover, the carbon skeleton displays strong distortions as well. Besides the downward bending of the acyl group it is in particular the inner CC bond being bent upward relative to the above-defined molecular plane (atom positions 4 and 5 in Fig. 3a).
 | ||
| Fig. 3 Calculated (PBE-D3PBC) vertical distances of the various atoms of adsorbed NTCDA/Ag(111) in bridge1 mode. Shown are cuts through the molecule (a) connecting the Oacyl and Oanh atoms, and (b) connecting the hydrogen atoms together with (c) the most important vertical computed distances compared to NIXSW experiments.10 All vertical distance values refer to the bulk-extrapolated Ag surface atom positions. | ||
The surface itself also warrants attention. In Fig. 4 we have visualized the local vertical relaxations of the Ag(111) surface covered by NTCDA in a similar way as Bauer et al. did for PTCDA on Ag(111).3 In the course of the adsorption process, the Ag(111) surface is found to display considerable buckling, indicative of directional adsorbate–substrate bonds beyond pure van der Waals interactions. Specifically, the covalent bonds of acyl oxygen atoms cause a protrusion of nearby Ag atoms which is nevertheless surprisingly small (Δh ≈ 0.005 Å). Ag atoms below the central C–C backbone, on the other hand, experience a significant repulsion, pushing those Ag atoms below the average Ag surface plane (Δh ≈ −0.074 Å). The overall corrugation of the Ag surface is included in Table 1: we find a pronounced buckling of 0.134 Å for the topmost layer and 0.025 Å for the second layer for NTCDA occupying the bridge1 adsorption site; for the top1 site these numbers transform to 0.208 Å and 0.076 Å, respectively.
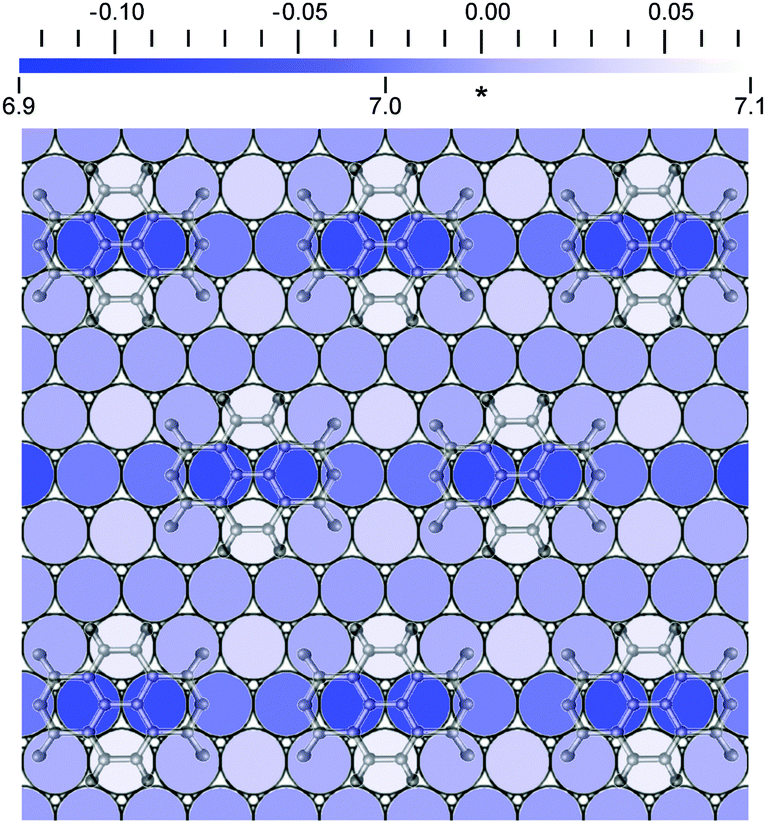 | ||
| Fig. 4 Corrugation of the Ag(111) surface stemming from PBE-D3PBC computations with vertical positions of Ag atoms displayed in different shades of blue according to the colour bar. The numbers underneath of the colour scale bar refer to the distance in Å from the bottom layer of our four-layer Ag slab. The average vertical position of the Ag(111) surface layer (7.026 Å) is denoted by an asterisk (*). This value is used as a reference for the upper scale. The arrangement of the NTCDA molecules is overlaid in light grey. The layer spacing of the Ag bulk in our calculation was Δd111 = 2.352 Å, which compares favourably with the experimental value of 2.349 Å. | ||
| A–B | PBE-D3PBC, dilute layera | Experiment, dense layer10 | |
|---|---|---|---|
| Bridge1 site | Top1 site | ||
| a Given are averaged values for equivalent atoms and the maximum deviation from this average. b Position of all carbon atoms averaged. c Position of ring carbon atoms averaged (Cring) – see Scheme 1. d The difference is smaller than the uncertainty in the measurements. e Difference in z-coordinates of Ag atoms (corrugation) of the topmost layer. f Difference in z-coordinates of Ag atoms (corrugation) of the sub-surface layer. | |||
| Oacyl–Ag | 2.577 ± 0.004 | 2.622 ± 0.003 | 2.747(25) |
| Oanh–Ag | 2.806 ± 0.001 | 2.798 ± 0.001 | 3.004(15) |
| Call–Agb | 2.905 ± 0.145 | 2.890 ± 0.090 | 2.997(16) |
| Cring–Agc | 2.946 ± 0.068 | 2.925 ± 0.051 | |
| Oacyl–Cring | −0.369 ± 0.070 | −0.307 ± 0.052 | −0.25(3) |
| Oanh–Cring | −0.140 ± 0.068 | −0.134 ± 0.051 | ≈0d |
| Oanh–Oacyl | 0.230 ± 0.004 | 0.173 ± 0.005 | 0.26(4) |
| δz Ag–Ag | 0.134 | 0.208 | |
| δz Ag/sub–Ag/sub | 0.025 | 0.076 | |
In accordance with similar observation for PTCDA on Ag(111)3 we conclude that the attraction of the molecule towards the surface by the acyl oxygen atoms leads to increased Pauli repulsion between the π-electrons of the naphthalene core and the Ag atoms underneath. Interestingly, Ag atoms below the HCCH subunits display a particularly severe up-shift. This is most probably an effect to counterbalance the downward motion of the Ag atoms underneath the molecule's centre. The surface corrugation due to electronic effects in the molecule–substrate interaction is quite pronounced and deserves further analysis for similar systems in the future.
The derived structural data for the most stable adsorption configuration (bridge1) allows a direct comparison to NIXSW measurements obtained for NTCDA/Ag(111).9,10 We note beforehand that the NIXSW data have been obtained from dense layers with H-bonding among neighbouring NTCDA molecules. The competition of such interactions with covalent bonding of Oacyl to Ag should weaken the Ag–Oacyl bond and most likely lead to a reduced downward bending of the acyl-oxygens. This hypothesis is based on NIXSW results by Kilian et al.71 referring to PTCDA/Ag(111).
Both, experimental and the (averaged) computational adsorbate–surface distances are compiled in Table 1 (for data on all adsorption geometries investigated see Table S2 in the ESI†). Since the NIXSW experiment did not distinguish between the various inequivalent C-atoms we introduced the values Call and CRing to quantify the average vertical distances of carbon entities defined in Scheme 1. In order to allow a proper comparison to experimental NIXSW data we have introduced a hypothetical Ag surface plane Ag* which corresponds to the extrapolated positions of Ag bulk atoms. The difference with respect to the true averaged Ag surface layer (Δh = 0.028 Å) corresponds to the Ag(111) surface relaxation (surface interlayer distance shorter than bulk value).
First of all, the PBE-D3 values provided in this study agree formidably with the experimental values. Note that a structural optimization without dispersion correction (PBE) gives unreasonably long surface–adsorbate distances, d(CRing–Ag) = 3.534 Å (further details in Table S2 in the ESI†). Thus, we confirm the finding that pure GGA functionals are not able to describe weak adsorbate–surface complexes correctly.72 The computed distance for the best binding site (bridge1) Call = 2.905 Å for NTCDA/Ag(111) using PBE-D3PBC is in accord with the experimentally found value of 2.997 Å. Both, experiment and theory confirm that the acyl oxygens are located substantially below the carbon plane as outlined above. The computed averaged Ag–Oacyl distance is 2.577(3) Å while the Ag–Oanh distance is 2.806(1) Å. The difference (0.229 Å) is comparable to NIXSW results (0.257 Å). Similar values are found for the energetically close-lying top1 adsorption geometry. The Ag–Oacyl distance is thereby at the upper end of the range for typical distances in molecular complexes of silver 2.4–2.6 Å.73 No reference data are available for Ag–Oanh-bonds in the solid state.
Actually, the calculations predict a notably stronger downward bending of the oxygen atoms as compared to the experiment. In addition, the anhydride oxygen atoms are located distinctly below the carbon plane while they are found above the carbon plane in the NIXSW data. These discrepancies are attributed to a severe overall bending of the entire NTCDA molecule. As our calculated numbers refer to NTCDA separated by at least one Ag atom row, they correspond to layers with negligible direct lateral interactions; experimental NIXSW data, on the other hand, were obtained from dense NTCDA-layers with substantial H-bonding between neighbouring molecules.9,10
According to our findings, the warping of the molecular plane is substantially stronger for the less densely packed arrangement of NTCDA molecules in our calculation. Unfortunately, low-coverage NIXSW data (isolated NTCDA adsorbates) which would compare directly with our theoretical values are not available. We therefore also investigated the relaxed monolayer phase of NTCDA on Ag(111) with distances between oxygen and hydrogen atoms of neighbouring NTCDA molecules amounting to 2–2.5 Å, i.e. with H-bonding contributions. This corresponds to the most recently found structure for the relaxed monolayer.32 For such dense layers the overall distance to the Ag(111) surface increases by 0.05–0.10 Å, in line with a weaker Ag–NTCDA interaction in this complex. Moreover, the warping of the molecular plane and the downward bending of the acyl oxygens is reduced notably.
Additional confirmation for our hypothesis of a more severe bending of adsorbed NTCDA in the absence of H-bonding (isolated adsorbed molecules) comes from previous studies on PTCDA/Ag(111) data.65,66,71 Specifically, two NIXSW data sets comprising dense as well as dilute layers exist and they have been used to estimate trends related to the effect of intermolecular interactions within well-ordered layers, as compared to less dense, disordered agglomerates of adsorbed molecules. These findings suggest that a dilute species is interacting more strongly with Ag(111) and experiences more severe distortions. When comparing our calculated structure data to NIXSW results (obtained for a dense relaxed NTCDA monolayer on Ag(111)) the influence of lateral interactions should therefore be kept in mind.
According to Stadler et al., the NIXSW data of NTCDA on Ag(111) show a rather small coherent fraction for the C1s signal, indicative of a relatively large spread in vertical distances of the individual C-atoms.10 This finding is in perfect agreement with the substantial warping of the NTCDA carbon skeleton according to our calculations. Recently, such a warping has also been suggested for PTCDA on various Ag surfaces based on dispersion-corrected DFT calculations.3
The adsorption energies for the arrangements studied in this work (see Fig. 1) are derived from PBE-D3PBC structural optimizations. Positive energies thereby represent stable surface–adsorbate complexes. The most favourable adsorption site is the bridge1 site aligned with the long axis along Ag atom rows (adsorption energy equals 202 kJ mol−1). Only slightly less stable is the equally aligned top1 site (196 kJ mol−1) while the other two sites investigated (bridge2 and top2, both aligned perpendicular to Ag atoms rows) are far less stable. Thus the computational data suggest that NTCDA adsorbs either on a bridge1 or a top1-site. In a test calculation without dispersion correction (PBE), the adsorption energy even turns negative with −2.7 kJ mol−1, in accordance with the unreasonably large adsorbate–surface distance CRing–Ag = 3.534 Å (see above) and similar findings for PTCDA/Ag(111) using a comparable theoretical approach.74
A closer look at the relative positions of the Oacyl atoms and the topmost layer of the silver slab reveals that in these two geometries, all four doubly-bonded oxygen atoms are located on top of Ag atoms, while they are displaced in the other two arrangements. This is another indication that the Ag–Oacyl interaction is decisive for the site preference of adsorbed NTCDA. Experimentally, an estimate of the adsorption energy is available from temperature programmed desorption (TPD) investigations of a dilute monolayer giving a value of 112 ± 10 kJ mol−1 (1.14 eV).4 This value reported by Stahl et al., however, appears much too low. In our opinion, the very gradual initial slope in the measurements presented points toward a heterogeneous surface layer or a mixture of different phases. As a consequence of the shallow initial slope of the desorption signal an unusually low prefactor of about 1012 s−1 is deduced. As our submonolayer TD spectra show this long tail towards the low temperature side as well, we decided to take the well-shaped TD spectra of the likewise parallel oriented NTCDA bilayer to obtain a lower bound for the adsorption energy of the NTCDA/Ag(111) monolayer species. Analysing the initial slope of the bilayer desorption signal yields an adsorption energy of 121 ± 10 kJ mol−1 (1.26 eV per molecule) and a prefactor of 1.5 × 10¹⁷ s−1 (such high prefactors are quite common for large molecules desorbing from metal surfaces75–77). According to the higher desorption temperatures of monolayer NTCDA and assuming a similar prefactor, we estimate the adsorption energy of monolayer NTCDA/Ag(111) to equal about 150 kJ mol−1 (1.56 eV per molecule) which is much closer to the calculated values.
It was already discussed in previous publications regarding NTCDA and PTCDA on various metal substrate surfaces that the LUMO of the free molecule may become partially occupied upon adsorption.3,7,48,70,71 In our study such behaviour is clearly confirmed as indicated by the partially occupied band (occupation 1.42 e, band located 0.04 eV below EFermi) shown in Fig. 5 exhibiting mainly LUMO (NTCDA) – character. This can also be seen in the partial density of states (pDOS) shown in Fig. 5c, which exhibits significant NTCDA-character of the states around the Fermi level (EFermi).
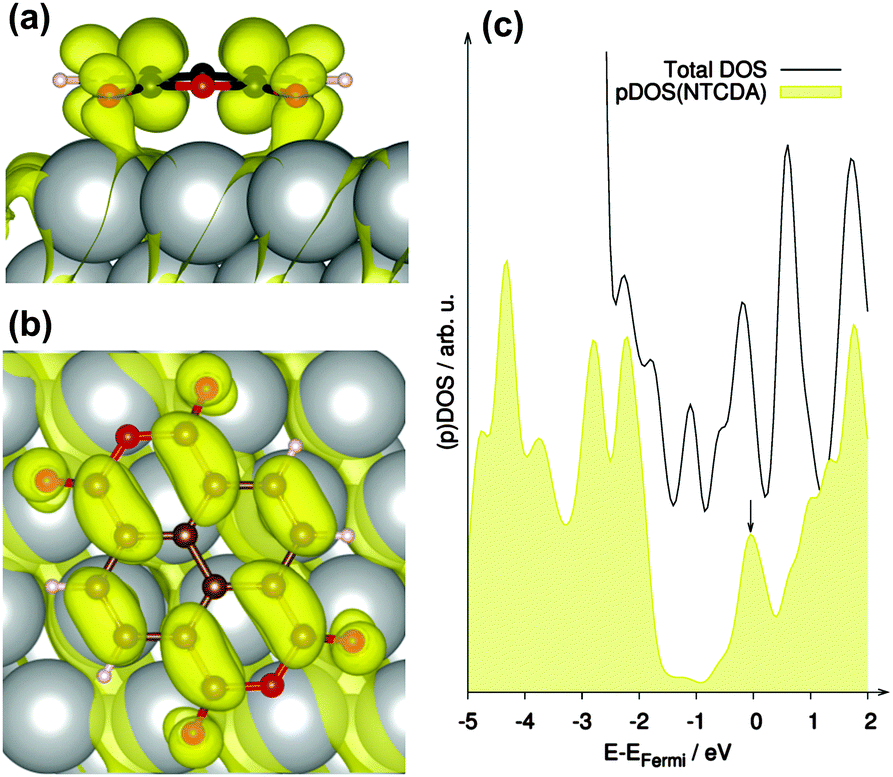 | ||
| Fig. 5 Band at the Γ-point mainly consisting of the former LUMO (0.04 eV below EFermi, indicated by black arrow in DOS plot) of NTCDA on Ag(111), which becomes partially occupied (1.42 e) upon adsorption on Ag(111) in side (a) and top (b) view together with (c) total density of states (DOS) of the complete system (black line) and partial DOS of the adsorbate (yellow). | ||
To quantify this partial filling of the LUMO and the net charge transfer between surface and adsorbate, we derived partial charges in the framework of the atoms-in-molecules (AIM) theory. The AIM results suggest a negatively charged NTCDA molecule with a charge of Δq = −0.94 e. This can be compared to the estimate of −0.35 e by charge summation78 and the value of −1.00 e for PTCDA on Ag(111) derived by a similar AIM approach as followed here.3 It can be concluded that NTCDA shows a similar charge transfer compared to PTCDA and thus differs considerably from a purely physisorbed state.
The accurate reproduction of experimental structural data of NTCDA adsorbed on the Ag(111) surface underlines the importance and accuracy of dispersion correction methods in DFT-based calculations to arrive at a trustworthy description of adsorbed large organic molecules. In addition to the NIXSW experiments,10 the calculations can then help in identifying subtle details of the adsorption geometry which are not (yet) resolved in the experimental studies, such as the corrugation of the Ag surface or of the carbon skeleton of adsorbed NTCDA.
In conclusion, we applied the DFT-D3 method to obtain a very good description of the adsorption structure of NTCDA on the Ag(111) surface in comparison to experimental data. The environment-dependent dispersion coefficients in the DFT-D3 scheme seem to capture the main features of dispersion interactions in these systems.
| Modea | Free NTCDA molecule | NTCDA/Ag(111) (bridge1) | Mode character | ||||||||
|---|---|---|---|---|---|---|---|---|---|---|---|
| MP2/TZ | PBE-D3PBC | PBE-D3PBC | |||||||||
| # | Symmetry | ν | I | ν | I | ν | ν | I | ν min − νmaxd | Δνe | |
| a The sorting of modes and the symmetry assignment refers to the MP2/TZ data (D2h symmetry). Matching of the vibrational modes for the different levels of approximation has been carried out by visual inspection of the displacement pattern and comparison to MP2/TZ. b Vibrational frequencies of adsorbed NTCDA computed with DFPT approach. c Vibrational frequencies and IR intensities of adsorbed NTCDA computed with dynamical dipole approach. d Spread of vibrational mode frequencies when considering all adsorption configurations for NTCDA/Ag. e Change in vibrational frequency upon adsorption (relative to dynamical dipole-derived frequencies). | |||||||||||
| 23 | b1u | 599.1 | 0.00 | 592.0 | 0.14 | 606.3 | 605.3 | 0.000 | 4.5 | 13.3 | |
| 24 | b3g | 600.5 | 0.00 | 593.5 | 0.00 | 602.8 | 603.1 | 0.000 | 3.9 | 9.6 | |
| 25 | ag | 664.4 | 0.00 | 652.2 | 0.00 | 648.9 | 648.1 | 0.004 | 2.9 | −4.2 | |
| 26 | b2u | 696.9 | 0.04 | 681.7 | 0.04 | 673.8 | 673.8 | 0.000 | 2.3 | −7.9 | |
| 27 | b2g | 727.6 | 0.00 | 686.9 | 0.00 | 665.4 | 665.4 | 0.000 | 7.1 | −21.5 | |
| 28 | b1g | 732.1 | 0.00 | 713.9 | 0.00 | 688.8 | 689.5 | 0.000 | 6.7 | −24.4 | |
| 29 | b3u | 747.7 | 0.09 | 747.1 | 0.09 | 734.0 | 717.9 | 0.058 | 6.7 | −29.2 | |
| 30 | au | 751.5 | 0.00 | 753.9 | 0.00 | 720.7 | 720.8 | 0.000 | 6.5 | −33.1 | |
| 31 | b1u | 752.2 | 0.00 | 745.3 | 0.07 | 750.7 | 748.8 | 0.000 | 4.8 | 3.5 | |
| 32 | b3g | 806.7 | 0.00 | 787.7 | 0.00 | 789.2 | 789.2 | 0.000 | 3.9 | 1.5 | |
| 33 | b1u | 828.6 | 0.00 | 812.4 | 0.05 | 796.0 | 813.6 | 0.000 | 4.6 | 1.2 | |
| 34 | b1g | 880.7 | 0.00 | 874.4 | 0.00 | 804.4 | 808.0 | 0.000 | 6.6 | −66.5 | |
| 35 | b3u | 881.9 | 0.05 | 874.6 | 0.04 | 815.8 | 813.0 | 0.002 | 5.4 | −61.6 | |
| 36 | au | 947.0 | 0.00 | 982.1 | 0.00 | 933.8 | 937.8 | 0.000 | 6.4 | −44.3 | |
| 37 | b2u | 954.0 | 0.02 | 934.0 | 0.05 | 915.3 | 916.3 | 0.000 | 8.7 | −17.7 | |
| 38 | b2g | 961.4 | 0.00 | 982.3 | 0.00 | 939.1 | 943.3 | 0.000 | 7.0 | −39.0 | |
| 39 | ag | 1014.6 | 0.00 | 990.3 | 0.00 | 986.6 | 987.0 | 0.002 | 6.0 | −3.4 | |
| 40 | b3g | 1049.1 | 0.00 | 986.7 | 0.00 | 957.2 | 958.6 | 0.000 | 15.2 | −28.1 | C–Oanh stretch |
| 41 | b2u | 1068.5 | 0.88 | 1011.6 | 0.79 | 958.0 | 959.5 | 0.000 | 11.6 | −52.1 | C–Oanh stretch |
| 42 | ag | 1125.0 | 0.00 | 1101.0 | 0.00 | 1101.0 | 1104.2 | 0.021 | 8.1 | 3.2 | |
| 43 | b1u | 1135.2 | 0.35 | 1108.1 | 0.11 | 1088.1 | 1084.5 | 0.000 | 8.3 | −23.6 | |
| 44 | b3g | 1164.7 | 0.00 | 1139.9 | 0.00 | 1122.2 | 1123.9 | 0.000 | 7.2 | −16.0 | |
| 45 | b2u | 1187.4 | 0.21 | 1156.5 | 0.13 | 1152.7 | 1155.8 | 0.000 | 7.2 | −0.7 | |
| 46 | b3g | 1235.8 | 0.00 | 1198.5 | 0.00 | 1207.2 | 1208.2 | 0.000 | 6.2 | 9.8 | |
| 47 | b2u | 1280.9 | 0.27 | 1239.4 | 0.19 | 1210.4 | 1211.1 | 0.000 | 7.2 | −28.3 | |
| 48 | ag | 1285.2 | 0.00 | 1248.2 | 0.00 | 1255.5 | 1256.9 | 0.038 | 6.7 | 8.7 | |
| 49 | b1u | 1316.9 | 0.48 | 1283.9 | 0.50 | 1282.4 | 1282.5 | 0.000 | 7.1 | −1.3 | |
| 50 | ag | 1392.2 | 0.00 | 1357.9 | 0.00 | 1344.5 | 1345.5 | 0.581 | 9.0 | −12.4 | |
| 51 | b1u | 1475.3 | 0.04 | 1432.6 | 0.09 | 1437.8 | 1435.8 | 0.000 | 8.2 | 3.1 | |
| 52 | ag | 1492.6 | 0.00 | 1429.0 | 0.00 | 1403.6 | 1404.8 | 0.133 | 13.7 | −24.1 | |
| 53 | b3g | 1498.6 | 0.00 | 1462.5 | 0.00 | 1419.5 | 1419.8 | 0.000 | 7.5 | −42.7 | |
| 54 | b2u | 1527.5 | 0.00 | 1392.7 | 0.01 | 1429.2 | 1430.4 | 0.000 | 12.6 | 37.7 | |
| 55 | b2u | 1559.9 | 0.01 | 1519.5 | 0.02 | 1509.1 | 1509.8 | 0.000 | 9.7 | −9.7 | |
| 56 | b1u | 1614.0 | 0.04 | 1575.8 | 0.07 | 1493.1 | 1493.6 | 0.000 | 12.5 | −82.2 | |
| 57 | ag | 1628.6 | 0.00 | 1594.0 | 0.00 | 1564.7 | 1565.6 | 1.000 | 7.8 | −28.3 | |
| 58 | b3g | 1669.3 | 0.00 | 1617.8 | 0.00 | 1542.3 | 1541.2 | 0.000 | 12.5 | −76.6 | |
| 59 | b2u | 1788.6 | 1.00 | 1733.1 | 1.00 | 1579.3 | 1580.9 | 0.000 | 21.6 | −152.2 | CO/CO–Ag |
| 60 | b3g | 1791.7 | 0.00 | 1734.0 | 0.00 | 1591.4 | 1593.0 | 0.000 | 29.2 | −141.0 | CO/CO–Ag |
| 61 | ag | 1819.9 | 0.00 | 1770.6 | 0.25 | 1625.3 | 1625.7 | 0.264 | 22.1 | −144.9 | CO/CO–Ag |
| 62 | b1u | 1824.1 | 0.73 | 1802.5 | 0.00 | 1655.7 | 1628.9 | 0.024 | 17.0 | −173.8 | CO/CO–Ag |
| 63 | b1u | 3230.5 | 0.00 | 3114.3 | 0.00 | 3108.7 | 3112.2 | 0.000 | 5.1 | −2.1 | C–H stretch |
| 64 | b3g | 3230.7 | 0.00 | 3114.0 | 0.00 | 3109.1 | 3113.8 | 0.000 | 6.0 | −0.2 | C–H stretch |
| 65 | b2u | 3242.4 | 0.01 | 3125.2 | 0.01 | 3120.9 | 3122.9 | 0.000 | 3.8 | −2.3 | C–H stretch |
| 66 | ag | 3242.5 | 0.00 | 3125.1 | 0.00 | 3121.0 | 3126.5 | 0.000 | 6.5 | 1.5 | C–H stretch |
In Table 2 the individual vibrational modes of free and adsorbed NTCDA (bridge1) are listed. Also included are the irreducible representations of the various modes referring to free NTCDA (D2h, see Scheme 1 for choice of coordinate system). We note that for the adsorbed molecule the symmetry can be C2v at most, i.e. for NTCDA occupying a high symmetry site. Various influences (effect of subsurface Ag-layer; lateral translations/rotations) may further reduce the symmetry to CS, C2, or even C1. According to Fig. 2, the deviations from C2v symmetry are minor.
In Table 2 the ordering and labelling of the individual modes has been taken from the free molecule. As interaction with the Ag(111) substrate affects the various modes differently, mode-crossings occur in a few cases which have been taken into account; from the inspection of individual displacement patterns of the molecular vibrations a direct correlation of modes for free and adsorbed NTCDA is easily obtained, though. All vibrational frequencies relevant to our experiment (600–3200 cm−1) are displayed – the full list of modes is available in Table S3 in the ESI† (Table S4 for all adsorption geometries investigated). Some of the vibrational modes are mainly located at specific functional groups. Due to their distinct displacement patterns the four C–H stretch modes, four CO stretch and two C–Oanh stretch modes, and four C–H bending modes can be readily assigned. For the most part, however, a clear assignment to a localized bond, or molecular sub-unit is not possible and the oscillation comprises characteristic motions (e.g. ring-breathing, ring-puckering) of the entire molecule. Detailed inspection identifies various deformation modes with specific polarizations, i.e. motion along the long or short axis of NTCDA, or perpendicular to the molecular plane. The strongest shift in vibrational frequencies in going from the free to the adsorbed molecule (Δν) can be found for the CO stretch modes due to the interaction with the Ag atoms at the surface. This shift in the range of 150 cm−1 is a strong indication for a directional interaction of the acyl oxygen atoms with Ag-atoms at the surface and in line with the conclusions drawn from the structural and charge-transfer data.
Another point to consider in the computation of the spectra is the possibility of the NTCDA molecule to occupy different binding sites on the Ag(111) surface as shown in Fig. 1. The simulation of infrared spectra for all binding geometries considered here leads to a range of frequencies for every normal mode given in Table 2 (νmin − νmax). While the low frequency and the C–H stretch modes display only small variations in vibrational frequencies, especially the modes connected to C–Oanh and CO stretching vibrations exhibit a spread of up to 30 cm−1. This is a clear indication that the directional interaction to the surface is somewhat dependent on the adsorption site occupied by NTCDA while the overall spectrum is only mildly influenced by the particular bonding configuration.
Comparison of calculated molecular vibrations with experimental IRAS data has to consider dipole selection rules. For molecules adsorbed on a flat metal substrate electric field components parallel to the surface plane are negligible and only vibrations with dynamic dipole moments perpendicular to the surface can be excited. For flat-lying, planar molecules (such as NTCDA on Ag(111)) the surface plane is not a symmetry plane anymore and D2h symmetry reduces to C2v as outlined above. This means that, in addition to the b3u modes, all ag modes become dipole allowed as well. Further lowering of the adsorption site symmetry renders additional modes dipole active so that from an analysis of the IR spectra conclusions as to the local adsorption geometry can be drawn.
The computations of IR intensities for surface–adsorbed NTCDA were based upon a dynamical dipole approach considering the change of the dipole moment in z-direction only (see Fig. S1 in the ESI†). Attempts to derive these intensities via the DFPT approach were not successful (results were strongly dependent on very minor changes in the adsorption geometry). As can be seen from Table 2, the vibrational frequencies derived with both approaches (denoted νb and νc) are very similar. With exception of a few modes the differences are below 5 cm−1 (RMS = 1.5 cm−1).
Experimental spectra
In this section, the mode energies and IR intensities given in Table 2 are compared with the experimental spectrum. We note beforehand that NTCDA frequencies for the various adsorption configurations (Table S4 in the ESI†) differ only slightly so that it is difficult to discriminate between different NTCDA sites.In Fig. 6 the vibrational spectrum of a dilute layer of NTCDA/Ag(111) is displayed. Specifically, 0.15 ML NTCDA has been deposited at 28 K and infrared absorption spectra taken right after transfer to our IR measurement cell. We note that thermal annealing (Fig. 6a) lead to slight but clearly discernible spectral changes which we attribute to lateral interactions among neighboring NTCDA. Initially, isolated NTCDA most likely occupying different sites should prevail. Upon successive annealing (T → 50 K → 80 K), NTCDA is expected to first transform into islands without long range order; eventually (T → 350 K) islands exhibiting a distinct long range order (relaxed monolayer phase, see also Fig. S2 in the ESI†) will form. These changes, however, will not be discussed in-depth here. The purpose to show these data is to prove that configurational alterations within the layer are in fact reflected in the observed vibrational spectra and can be traced sensitively. Most relevant for our comparison to the calculated spectra is that the low NTCDA coverage (0.15 ML) ensures that isolated NTCDA are present and intermolecular interactions are negligible. This assumption is corroborated by similar data sets obtained at 0.1 and 0.3 ML (not shown). Specifically, virtually identical modes are observed at 0.1 ML, while at coverages of 0.3 ML intermolecular interactions start becoming relevant. We note that the spectrum displayed in Fig. 6b represents the sum of several consecutively taken spectra and within this series no alterations in vibrational peak positions and intensities have been found.
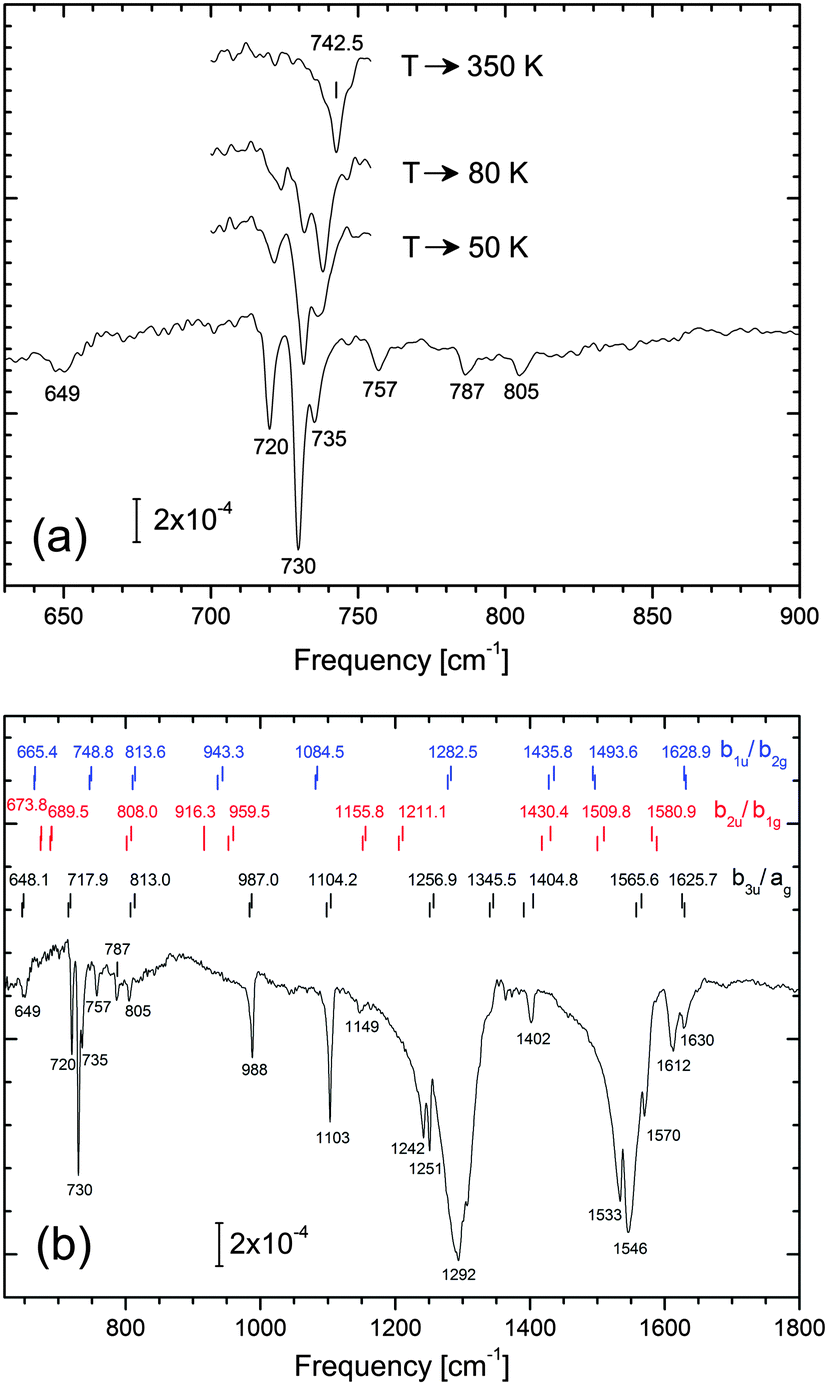 | ||
| Fig. 6 IRAS spectra of 0.15 ML NTCDA adsorbed on Ag(111) at 28 K. (a) Frequency range 630–900 cm−1, emphasizing the prominent out-of-plane mode at about 730 cm−1. In panel (a) the thermal evolution of this mode is displayed; the spectra refer to the layer after annealing to the indicated temperatures. (b) Frequency range 620–1800 cm−1, featuring predominantly in-plane (ip) modes of NTCDA at > 900 cm−1. The calculated line positions (PBE-D3PBC, dynamic dipole approach) are indicated by vertical lines and labelled according to their vibrational frequencies. Modes of different symmetry properties are grouped in separate rows: b3u and ag (black); b2u and b1g (red); b1u and b2g (blue). The two bars for each set of modes refer to values of NTCDA occupying bridge1 and top1 sites. All spectra were obtained at 28 K and 2 cm−1 spectral resolution. | ||
In Fig. 6b we have included the calculated PBE-D3PBC line positions of the various modes (dynamical dipole approach) and sorted them according to their symmetry. In order to avoid ambiguities, we kept the original nomenclature of the D2h symmetry group. The bottom row (black) contains modes which should be dipole active even if a high symmetry site (C2v symmetry) is occupied, e.g. modes belonging to the b3u and ag irreducible representations of the D2h symmetry group. In case that the molecule is laterally displaced in the O–O direction b1u and b2g type of modes become dipole active as well (symmetry reduces to CS); similarly, the inequality of fcc and hcp hollow sites (or some other symmetry-breaking element in the y-direction) would lead to CS symmetry at most so that b2u as well as b1g type of modes should display some intensity in IR spectra. The additional modes expected in the IR spectra are listed in the top and middle rows of Fig. 6b, respectively. Yet another type of displacement from a high symmetry site would be an azimuthal rotation or warping of the molecular plane (rendering b3g and au type of modes dipole active), but based on the computed adsorption energies, these displacements are energetically unfavourable.
We will now turn to the 700–1200 cm−1 region and analyse whether the observed spectral features are in line with a symmetry-reduced adsorption geometry. From a brief inspection of the spectrum in Fig. 6b the b3u and ag modes are readily identified. As the observed spectrum contains no significant additional modes we conclude that deviations from the local C2v symmetry are only weak. In particular, the absence of modes at 915, 960 and 1085 cm−1 lead us to conclude that such a symmetry-breaking element is missing (or its effect is negligible). On the other hand, we clearly observe a band at 1149 cm−1 which cannot be associated with ag, b3u, b1u, or b2g modes.
According to the fine structure of modes at 720–735, 1103, 1242/1251, 1533–1546, 1612–1630 cm−1 we invoke that more than just a single adsorption site is occupied. Moreover, structural disorder resulting from the low NTCDA deposition temperature may contribute to the heterogeneous line shapes or the presence of weak extra bands. The spectral regions around 1290 cm−1 and 1550 cm−1 are particularly crowded and, even though tiny details of the respective broad absorption bands are highly reproducible, their detailed assignment remains vague at present; we will merely list some ideas as to their origin: (i) thermally excited low frequency modes (e.g. translations/rotations parallel to the surface) lead to broadening of vibrational modes by means of anharmonic coupling. (ii) In addition to existing fundamental modes of adsorbed NTCDA, combination bands additionally contribute; by means of Fermi resonance coupling to spectrally close fundamental modes,30,79 these weak bands could gain substantial in intensity. (iii) Breaking of the local adsorption site symmetry adds new modes. (iv) Finally, a factor contributing to heterogeneity in vibrational spectra refers to slight line shifts due to naturally abundant 13C (1.1%) located at random positions within the carbon skeleton of NTCDA.
According to Fig. 6, vibrational bands which appear well suited for a detailed analysis are the C–O stretch modes of the acyl group at 1600–1800 cm−1, besides the spectral region at 700–1200 cm−1. The C–H stretching modes at 3000–3200 cm−1, on the other hand, are too weak to be detected and are therefore omitted in Fig. 6. In addition to their generally small dynamic dipole moments, the parallel orientation of adsorbed NTCDA further aggravates their detection. At 1612 and 1630 cm−1 we observe two distinct acyl C–O stretch modes. Due to their high frequencies and the low density of modes in this spectral region there is little doubt regarding their assignment. At 1600–1650 cm−1 the acyl group modes appear at substantially lower frequencies as compared to gas phase or bulk NTCDA for which 150–200 cm−1 higher frequencies are found (Table 2). We conclude that the oxygen atoms interact strongly with underlying Ag substrate atoms. As a consequence of this chemical interaction, a weakening of the C–O bond as well as a bending of the CO unit towards the surface occurs. This is in line with the outcome of our theoretical analysis and NIXSW findings.9,10
For NTCDA adsorbed on a high symmetry site (C2v symmetry) only one CO stretch mode is expected which can be ascribed to the symmetric stretching of the C–O bonds (ag) of isolated NTCDA on Ag(111). The question therefore arises as to the origin of the second mode. Three explanations appear reasonable: (i) two different high symmetry sites are occupied and the low sample temperature prevents migration from the less strongly bound to the energetically preferred site. (ii) NTCDA occupies a single site only which, however, is not a high symmetry site, e.g. the molecule is laterally displaced or rotated. (iii) the 1630 cm−1 band may indicate the formation of NTCDA dimers or small aggregates; in this respect we mention that for a dense layer the acyl band displays a notable blue shift leading to a broad band at 1625–1675 cm−1 (see Fig. S2, ESI†).
Conclusions
By combining ab initio computations with high-resolution IRAS measurements an in-depth understanding of molecular layers on metal surfaces has been attained for the model system NTCDA on Ag(111). From the excellent agreement between calculated and experimentally found molecular structure data, as well as molecular vibrations, we conclude that DFT including dispersion forces is ideally suited to characterize organic (mono)layer films involving large molecules. For these systems van der Waals interactions and chemical bonding are equally important and omitting either one leads to erroneous results. Common flaws, such as much too weak bonding or an incorrect molecular structure are effectively precluded. In general, the reproduction of structural parameters as derived from NIXSW experiments is very good, especially regarding the overall bonding distance and a downward bending of the acyl groups. Slight deviations between calculated and experimental structural data are attributed to the effect of lateral interactions among neighbouring NTCDA molecules.We find a directional interaction between the acyl oxygen atoms of NTCDA and specific Ag atoms of the Ag(111) surface. This is supported by a notable corrugation of the Ag surface, the dependence of adsorption energies on the local adsorption configurations (e.g. with and without short Ag–Oacyl distances), specific frequency shifts upon adsorption and structural changes in the NTCDA molecule. As to the origin of these latter modifications we confirm a downshift and partial filling of the formerly unoccupied NTCDA LUMO. While similar structural and electronic changes upon adsorption have very recently been reported for PTCDA/Ag(111),3 quantitative comparison of computed and experimental vibrational spectra is provided for the first time for such a large organic molecule adsorbed on a metal surface. The high accuracy of the calculation in reproducing the experimental frequency values across the full IR frequency range, leads us to conclude that errors should be only minor, at least in spectral regions with low or only moderately high mode densities.
Acknowledgements
RT thanks Jonas Möllmann and Stefan Grimme (Bonn) for providing their development version of the DFT-D3 code, Peter Schwerdtfeger (Auckland) for helpful discussions and HLR Stuttgart, CSC Frankfurt (LOEWE), HRZ Marburg and HLR Stuttgart for providing computational resources. We thank Carolin R. Braatz and Gregor Öhl for technical assistance during experiments. Financial support is provided by the DFG via the SFB 1083 “Structure and Dynamics of Internal Interfaces” and GRK 1782 “Functionalization of Semiconductors”.Notes and references
- J. V. Barth, Annu. Rev. Phys. Chem., 2007, 58, 375 CrossRef CAS PubMed.
- N. Ueno and S. Kera, Prog. Surf. Sci., 2008, 83, 490 CrossRef CAS.
- O. Bauer, G. Mercurio, M. Willenbockel, W. Reckien, C. H. Schmitz, B. Fiedler, S. Soubatch, T. Bredow, F. S. Tautz and M. Sokolowski, Phys. Rev. B: Condens. Matter Mater. Phys., 2012, 86, 235431 CrossRef.
- U. Stahl, D. Gador, A. Soukopp, R. Fink and E. Umbach, Surf. Sci., 1998, 414, 423 CrossRef CAS.
- L. Kilian, U. Stahl, I. Kossev, M. Sokolowski, R. Fink and E. Umbach, Surf. Sci., 2008, 602, 2427 CrossRef CAS.
- D. Gador, C. Buchberger, R. Fink and E. Umbach, Europhys. Lett., 1998, 41, 231 CrossRef CAS.
- A. Bendounan, F. Forster, A. Schöll, D. Batchelor, J. Ziroff, E. Umbach and F. Reinert, Surf. Sci., 2007, 601, 4013 CrossRef CAS.
- A. Schöll, Y. Zou, L. Kilian, D. Hübner, D. Gador, C. Jung, S. G. Urquhart, T. Schmidt, R. Fink and E. Umbach, Phys. Rev. Lett., 2004, 93, 146406 CrossRef PubMed.
- J. Stanzel, W. Weigand, L. Kilian, H. L. Meyerheim, C. Kumpf and E. Umbach, Surf. Sci., 2004, 571, L311 CrossRef CAS.
- C. Stadler, S. Hansen, A. Schöll, T.-L. Lee, J. Zegenhagen, C. Kumpf and E. Umbach, New J. Phys., 2007, 9, 50 CrossRef.
- J. Hafner, J. Comput. Chem., 2008, 29, 2044 CrossRef CAS PubMed.
- P. J. Hasnip, K. Refson, M. I. J. Probert, J. R. Yates, S. J. Clark and C. J. Pickard, Philos. Trans. R. Soc., A, 2014, 372, 26 CrossRef PubMed.
- W. Liu, A. Tkatchenko and M. Scheffler, Acc. Chem. Res., 2014, 47, 3369 CrossRef CAS PubMed.
- K. Burke, J. Chem. Phys., 2012, 136, 150901 CrossRef PubMed.
- S. Grimme, Wiley Interdiscip. Rev.: Comput. Mol. Sci., 2011, 1, 211 CrossRef CAS.
- A. Tkatchenko, L. Romaner, O. T. Hofmann, E. Zojer, C. Ambrosch-Draxl and M. Scheffler, MRS Bull., 2010, 35, 435 CrossRef CAS.
- J. Grafenstein and D. Cremer, J. Chem. Phys., 2009, 130, 124105 CrossRef PubMed.
- E. R. Johnson, I. D. Mackie and G. A. DiLabio, J. Phys. Org. Chem., 2009, 22, 1127 CrossRef CAS.
- T. Sato and H. Nakai, J. Chem. Phys., 2009, 131, 224104 CrossRef PubMed.
- S. Grimme, D. Heitmann, T. Pape, A. Hepp, C. Mück-Lichtenfeld and F. E. Hahn, J. Am. Chem. Soc., 2011, 133, 11118 CrossRef PubMed.
- L. Goerigk, H. Kruse and S. Grimme, ChemPhysChem, 2011, 12, 3421 CrossRef CAS PubMed.
- W. Reckien and T. Bredow, Chem. Phys. Lett., 2011, 508, 54 CrossRef CAS.
- J. Moellmann and S. Grimme, Phys. Chem. Chem. Phys., 2010, 12, 8500 RSC.
- T. Bučko, J. Hafner, S. Lebegue and J. G. Angyán, J. Phys. Chem. A, 2010, 114, 11814 CrossRef PubMed.
- L. Maschio, B. Civalleri, P. Ugliengo and A. Gavezzotti, J. Phys. Chem. A, 2011, 115, 11179 CrossRef CAS PubMed.
- J. Moellmann, S. Ehrlich, R. Tonner and S. Grimme, J. Phys.: Condens. Matter, 2012, 24, 424206 CrossRef PubMed.
- V. G. Ruiz, W. Liu, E. Zojer, M. Scheffler and A. Tkatchenko, Phys. Rev. Lett., 2012, 108, 146103 CrossRef PubMed.
- M. Eremtchenko, D. Bauer, J. A. Schaefer and F. S. Tautz, New J. Phys., 2004, 6, 4 CrossRef.
- F. S. Tautz, S. Sloboshanin, J. A. Schaefer, R. Scholz, V. Shklover, M. Sokolowski and E. Umbach, Phys. Rev. B: Condens. Matter Mater. Phys., 2000, 61, 16933 CrossRef CAS.
- T. Breuer, M. A. Celik, P. Jakob, R. Tonner and G. Witte, J. Phys. Chem. C, 2012, 116, 14491 CAS.
- C. R. Braatz, G. Öhl and P. Jakob, J. Chem. Phys., 2012, 136, 134706 CrossRef PubMed.
- C. R. Braatz, T. Esat, C. Wagner, R. Temirov, F. S. Tautz and P. Jakob, Surf. Sci., 2016, 643, 98 CrossRef CAS.
- F. S. Tautz, Prog. Surf. Sci., 2007, 82, 479 CrossRef CAS.
- R. Temirov, S. Soubatch, A. Lassise and F. S. Tautz, J. Phys.: Condens. Matter, 2008, 20, 224010 CrossRef.
- F. S. Tautz, M. Eremtchenko, J. A. Schaefer, M. Sokolowski, V. Shklover and E. Umbach, Phys. Rev. B: Condens. Matter Mater. Phys., 2002, 65, 125405 CrossRef.
- P. Rosenow, P. Jakob, R. Tonner, submitted.
- M. J. Frisch, G. W. Trucks, H. B. Schlegel, G. E. Scuseria, M. A. Robb, J. R. Cheeseman, G. Scalmani, V. Barone, B. Mennucci, G. A. Petersson, H. Nakatsuji, M. Caricato, X. Li, H. P. Hratchian, A. F. Izmaylov, J. Bloino, G. Zheng and J. L. H. Sonnenberg, M. Ehara, K. Toyota, R. Fukuda, J. Hasegawa, M. Ishida, T. Nakajima, Y. Honda, O. Kitao, H. Nakai, T. Vreven, J. A. Montgomery, Jr., J. E. Peralta, F. Ogliaro, M. Bearpark, J. J. Heyd, E. Brothers, K. N. Kudin, V. N. Staroverov, R. Kobayashi, J. Normand, K. Raghavachari, A. Rendell, J. C. Burant, S. S. Iyengar, J. Tomasi, M. Cossi, N. Rega, N. J. Millam, M. Klene, J. E. Knox, J. B. Cross, V. Bakken, C. Adamo, J. Jaramillo, R. Gomperts, R. E. Stratmann, O. Yazyev, A. J. Austin, R. Cammi, C. Pomelli, J. W. Ochterski, R. L. Martin, K. Morokuma, V. G. Zakrzewski, G. A. Voth, P. Salvador, J. J. Dannenberg, S. Dapprich, A. D. Daniels, Ö. Farkas, J. B. Foresman, J. V. Ortiz, J. Cioslowski and D. J. Fox, Gaussian, Inc., Wallingford CT, 2009.
- R. Ahlrichs, M. Bär, M. Häser, H. Horn and C. Kölmel, Chem. Phys. Lett., 1989, 162, 165 CrossRef CAS.
- J. P. Perdew, K. Burke and M. Ernzerhof, Phys. Rev. Lett., 1996, 77, 3865 CrossRef CAS PubMed.
- F. Weigend, Phys. Chem. Chem. Phys., 2006, 8, 1057 RSC.
- S. Grimme, J. Antony, S. Ehrlich and H. Krieg, J. Chem. Phys., 2010, 132, 154104 CrossRef PubMed.
- S. Grimme, S. Ehrlich and L. Goerigk, J. Comput. Chem., 2011, 32, 1456 CrossRef CAS PubMed.
- P. Deglmann, F. Furche and R. Ahlrichs, Chem. Phys. Lett., 2002, 362, 511 CrossRef CAS.
- K. Eichkorn, O. Treutler, H. Ohm, M. Häser and R. Ahlrichs, Chem. Phys. Lett., 1995, 240, 283 CrossRef CAS.
- G. Kresse and J. Furthmüller, Phys. Rev. B: Condens. Matter Mater. Phys., 1996, 54, 11169 CrossRef CAS.
- P. E. Blöchl, Phys. Rev. B: Condens. Matter Mater. Phys., 1994, 50, 17953 CrossRef.
- G. Kresse and D. Joubert, Phys. Rev. B: Condens. Matter Mater. Phys., 1999, 59, 1758 CrossRef CAS.
- L. Romaner, D. Nabok, P. Puschnig, E. Zojer and C. Ambrosch-Draxl, New J. Phys., 2009, 11, 053010 CrossRef.
- M. C. E. Galbraith, M. Marks, R. Tonner and U. Höfer, J. Phys. Chem. Lett., 2014, 5, 50 CrossRef CAS PubMed.
- S. S. Tsirkin, N. L. Zaitsev, I. A. Nechaev, R. Tonner, U. Höfer and E. V. Chulkov, Phys. Rev. B: Condens. Matter Mater. Phys., 2015, 92, 235434 CrossRef.
- H. J. Monkhorst and J. D. Pack, Phys. Rev. B: Solid State, 1976, 13, 5188 CrossRef.
- P. Giannozzi and S. Baroni, J. Chem. Phys., 1994, 100, 8537 CrossRef CAS.
- S. Baroni, S. de Gironcoli, A. Dal Corso and P. Giannozzi, Rev. Mod. Phys., 2001, 73, 515 CrossRef CAS.
- M. Gajdoš, K. Hummer, G. Kresse, J. Furthmüller and F. Bechstedt, Phys. Rev. B: Condens. Matter Mater. Phys., 2006, 73, 045112 CrossRef.
- S. Grimme, J. Comput. Chem., 2006, 27, 1787 CrossRef CAS PubMed.
- E. Sanville, S. D. Kenny, R. Smith and G. Henkelman, J. Comput. Chem., 2007, 28, 899 CrossRef PubMed.
- R. Dronskowski and P. E. Blöchl, J. Phys. Chem., 1993, 97, 8617 CrossRef CAS.
- V. L. Deringer, A. L. Tchougréeff and R. Dronskowski, J. Phys. Chem. A, 2011, 115, 5461 CrossRef CAS PubMed.
- S. Maintz, V. L. Deringer, A. L. Tchougréeff and R. Dronskowski, J. Comput. Chem., 2013, 34, 2557 CrossRef CAS PubMed.
- C. Bunge, J. Barrientos and A. Bunge, At. Data Nucl. Data Tables, 1993, 53, 113 CrossRef CAS.
- A. Tkatchenko, R. A. DiStasio, R. Car and M. Scheffler, Phys. Rev. Lett., 2012, 108, 236402 CrossRef PubMed.
- E. A. Soares, G. S. Leatherman, R. D. Diehl and M. A. Van Hove, Surf. Sci., 2000, 468, 129 CrossRef CAS.
- C. E. Botez, W. C. Elliott, P. F. Miceli and P. W. Stephens, Phys. Rev. B: Condens. Matter Mater. Phys., 2001, 63, 113404 CrossRef.
- J. J. Xie, S. de Gironcoli, S. Baroni and M. Scheffler, Phys. Rev. B: Condens. Matter Mater. Phys., 1999, 59, 970 CrossRef CAS.
- A. Hauschild, K. Karki, B. C. C. Cowie, M. Rohlfing, F. S. Tautz and M. Sokolowski, Phys. Rev. Lett., 2005, 94, 036106 CrossRef CAS PubMed.
- A. Hauschild, R. Temirov, S. Soubatch, O. Bauer, A. Schöll, B. C. C. Cowie, T.-L. Lee, F. S. Tautz and M. Sokolowski, Phys. Rev. B: Condens. Matter Mater. Phys., 2010, 81, 125432 CrossRef.
- C. Kumpf, private communication.
- A. Alkauskas, A. Baratoff and C. Bruder, Phys. Rev. B: Condens. Matter Mater. Phys., 2006, 73, 165408 CrossRef.
- L. Born and G. Heywang, Z. Kristallogr., 1990, 190, 147 CrossRef CAS.
- J. Ziroff, F. Forster, A. Schöll, P. Puschnig and F. Reinert, Phys. Rev. Lett., 2010, 104, 233004 CrossRef CAS PubMed.
- L. Kilian, A. Hauschild, R. Temirov, S. Soubatch, A. Schöll, A. Bendounan, F. Reinert, T.-L. Lee, F. S. Tautz, M. Sokolowski and E. Umbach, Phys. Rev. Lett., 2008, 100, 136103 CrossRef CAS PubMed.
- E. R. McNellis, J. Meyer and K. Reuter, Phys. Rev. B: Condens. Matter Mater. Phys., 2009, 80, 205414 CrossRef.
- F. H. Allen, Acta Crystallogr., 2002, B58, 380 CAS.
- A. Hauschild, K. Karki, B. C. C. Cowie, M. Rohlfing, F. S. Tautz and M. Sokolowski, Phys. Rev. Lett., 2005, 95, 209602 CrossRef.
- K. A. Fichthorn and R. A. Miron, Phys. Rev. Lett., 2002, 89, 196103 CrossRef PubMed.
- R. Zacharia, H. Ulbricht and T. Hertel, Phys. Rev. B: Condens. Matter Mater. Phys., 2004, 69, 155406 CrossRef.
- D. Käfer, C. Wöll and G. Witte, Appl. Phys. A: Mater. Sci. Process., 2009, 95, 273 CrossRef.
- M. Rohlfing, R. Temirov and F. S. Tautz, Phys. Rev. B: Condens. Matter Mater. Phys., 2007, 76, 115421 CrossRef.
- P. Jakob, J. Chem. Phys., 1998, 108, 5035 CrossRef CAS.
Footnote |
| † Electronic supplementary information (ESI) available: Table on calculated structural data of adsorbed NTCDA; tables on vibrational frequencies of free and adsorbed NTCDA on Ag(111) (various adsorption sites); computed IR spectra of adsorbed NTCDA on Ag(111) for various adsorption sites; thermal evolution of low coverage NTCDA/Ag(111) IR spectra. See DOI: 10.1039/c5cp06619k |
| This journal is © the Owner Societies 2016 |