Micromechanical measurements of the effect of surfactants on cyclopentane hydrate shell properties
Erika P.
Brown
and
Carolyn A.
Koh
*
Center for Hydrate Research, Chemical & Biological Engineering Department, Colorado School of Mines, Golden, CO 80401, USA. E-mail: ckoh@mines.edu
First published on 20th November 2015
Abstract
Investigating the effect of surfactants on clathrate hydrate growth and morphology, especially particle shell strength and cohesion force, is critical to advancing new strategies to mitigate hydrate plug formation. In this study, dodecylbenzenesulfonic acid and polysorbate 80 surfactants were included during the growth of cyclopentane hydrates at several concentrations above and below the critical micelle concentration. A novel micromechanical method was applied to determine the force required to puncture the hydrate shell using a glass cantilever (with and without surfactants), with annealing times ranging from immediately after the hydrate nucleated to 90 minutes after formation. It was shown that the puncture force was decreased by the addition of both surfactants up to a maximum of 79%. Over the entire range of annealing times (0–90 minutes), the thickness of the hydrate shell was also measured. However, there was no clear change in shell thickness with the addition of surfactants. The growth rate of the hydrate shell was found to vary less than 15% with the addition of surfactants. The cohesive force between two hydrate particles was measured for each surfactant and found to be reduced by 28% to 78%. Interfacial tension measurements were also performed. Based on these results, microscopic changes to the hydrate shell morphology (due to the presence of surfactants) were proposed to cause the decrease in the force required to break the hydrate shell, since no macroscopic morphology changes were observed. Understanding the hydrate shell strength can be critical to reducing the capillary bridge interaction between hydrate particles or controlling the release of unconverted water from the interior of the hydrate particle, which can cause rapid hydrate conversion.
Introduction
Clathrate hydrates are compounds which are gaining increasing attention, both as a potential energy resource as well as a flow assurance hazard in oil and gas production. In the latter case, flow of hydrocarbons in flowlines can be impeded due to solid hydrate plug formation.1 Hydrates are typically stabilized at high pressure and low temperature conditions, though certain guest molecules (such as cyclopentane, often considered a model former) can stabilize hydrates at atmospheric pressure. This work focuses on the clathrate hydrate structure type that forms most frequently in flowlines (i.e. Structure II). These hydrates pose a significant risk both to safety and production because as they grow and agglomerate, bedding and jamming events can occur that increase the viscosity and pressure drop along the flowline, and may stop flow altogether. Fig. 1 shows a conceptual picture where hydrates form on the surface of water droplets that become entrained in the oil phase. These particles can agglomerate, leading to larger aggregates that may cause a complete blockage. | ||
| Fig. 1 Conceptual picture of the hydrate plugging mechanism in oil-dominated systems. Adapted from Turner2 and J. Abrahamson. | ||
Taylor3 proposed a model for the hydrate growth on water droplets which are entrained in the oil phase. Hydrate nucleation can occur at the water–oil or water–gas interface, followed by rapid growth of a thin hydrate shell that covers the droplet (Fig. 2). The shell then thickens as the hydrate particle anneals. Emulsified water droplets in a pipeline can vary in size from a few microns to several hundred microns, depending on the oil properties and the shear in the mixture;4 the particle size distribution also depends on the surfactants present.5,6 The smaller of these particles will fully convert to hydrates quickly, while the larger particles will retain an unconverted liquid interior for a longer period of time.
 | ||
| Fig. 2 Conceptual picture showing the formation of a hydrate shell on a water droplet emulsified in oil and the subsequent conversion to hydrate (adapted from Taylor3). | ||
The properties of the hydrate shell are important for determining the extent of agglomeration, as well as events such as deposition and sloughing. Because the particles contain unconverted water, a breakage of the shell caused by compression or shear could release this water, leading to extremely high cohesion forces7 and/or rapid conversion to further hydrate (due to the presence of additional nucleation sites generated from shell breakage). Therefore, further insight is needed into the properties of the hydrate shell and how they are affected by factors such as chemical additives.
The strength of hydrate particles/shells has been considered mostly in the context of natural hydrates cementing mineral deposits in deep ocean sediment conditions.8 Little to no work has been performed in terms of the shell strength of hydrates in a production scenario. Previous reports of the thickness of the hydrate shell have been mainly inferred from lateral film growth measurements and found to be highly variable depending on the system conditions. Previous results of the hydrate film/shell thickness varied from tens of microns to several millimetres.9,10 The hydrate former (guest molecules), temperature and pressure conditions, and experimental procedures varied significantly in these previous experiments; therefore there was little agreement among the measurements. Surfactants may also affect the growth of the hydrate shell; Karanjkar et al.11 observed that the addition of Sorbitane monooleate to cyclopentane hydrates (Structure II) changed the growth geometry of the shell, from a faceted shell when no surfactant was present to a hollow cone when 0.01 wt% of Sorbitane monooleate was present.
Agglomeration has been identified as a key parameter in facilitating flowline blockage due to hydrates.1 The strength with which the hydrates agglomerate is directly related to the cohesive forces between the particles. Cohesive forces can be related to the thermodynamic conditions in the flowline,12–14 as well as the presence of any surfactants in the water or oil phases.15–17 A micromechanical force apparatus (MMF) can be used to directly measure these cohesive forces using cyclopentane hydrate particles. Hydrates may be created as a pure phase or in the presence of surfactants in order to study the effect of different chemistries on the cohesion force. It has been suggested that the asphaltene and acid fractions in oil may strongly affect the plugging or non-plugging characteristics during production;18–21 these and other chemicals found in production scenarios have been previously investigated using MMF measurements. The proposed mechanism for hydrate cohesion is described by the capillary bridge theory (eqn (1)).22
 | (1) |
For this study, the MMF apparatus was used to measure the force that is required to puncture/disrupt the hydrate shell to determine the shell strength and hence potential for water leakage of the shell to enable further nucleation/growth of hydrates, as well as the cohesion force between hydrate particles both with and without the presence of surfactants. Interfacial tension measurements were also performed. A variety of parameters including annealing time, subcooling (the difference between the equilibrium temperature and experimental temperature), and the addition of surfactants were examined to determine which parameters had the strongest effect on hydrate shell growth, strength and cohesion.
Apparatus and procedure
Shell strength
The MMF apparatus consists of an inverted light microscope (Zeiss Axiovert S100) paired with digital recording equipment to visualize the particle interactions. A jacketed cooling cell connected to a chiller was used to maintain the temperature in an aluminium cell that was filled with cyclopentane. Two micromanipulators held glass cantilevers: a hand-operated manipulator and an Eppendorf Patchman, which is remotely operated. The glass cantilevers were calibrated through an indirect calibration procedure3 in order to determine the spring constants.The cyclopentane bath in the temperature-controlled aluminium cell was maintained at the desired experimental temperature, above the ice point and below the equilibrium temperature of cyclopentane hydrate (7.7 °C) using a cooling jacket with circulating glycol. Hydrate particles were created by depositing a water droplet onto the 35 μm glass cantilevers, then quenching the droplet in liquid nitrogen. The ice particle was then transferred quickly to the cyclopentane bath, where the ice served as a template for hydrate formation. In chemical additive experiments, the surfactants were added to the cyclopentane prior to the particle transfer into the bath. The particles were allowed to anneal for a predetermined amount of time (0–90 min) before experiments were performed. For shell strength experiments, a single particle was created, leaving the right-hand cantilever empty as shown in Fig. 3. Experiments were performed with 5+ repeats.
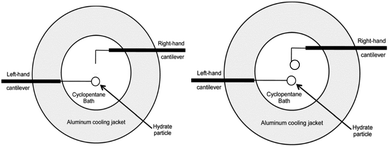 | ||
| Fig. 3 Aluminium cooling cell configuration for hydrate shell strength experiments (left), and cohesion force experiments (right). Modified from Aman et al.12 | ||
After the annealing time, the top cantilever was pressed into the particle until the shell failed and the particle was punctured by the cantilever. The maximum displacement of the shell from its resting position is used with eqn (2) to determine the force required to break the shell.
| FA = k × ΔD | (2) |
Shell thickness
The shell thickness can be also measured in these experiments. Once the shell was punctured, the cantilever was moved downward until it came into contact with the bottom of the hydrate particle. The distance between the bottom of the particle and the bottom of the cantilever was measured as illustrated in Fig. 4. Shell thickness measurements can be subject to error due to the uncertainty in the Z-direction; because the cantilever may not be placed exactly at the bottom of the spherical particle, it may rest a short distance up the sides of the particle, increasing the observed thickness. However, despite these shortcomings, these measurements provide an important estimate of a parameter that is otherwise very difficult to measure.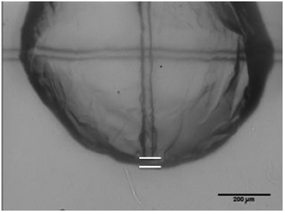 | ||
| Fig. 4 Visualization of the shell thickness measurement: top line denotes the bottom of the cantilever; bottom line denotes the bottom of the hydrate particle. | ||
Growth rate
The growth rate of the hydrate was determined by measuring the advancement of the hydrate shell along the water–cyclopentane interface. Fig. 5 shows the progression of the growth of the hydrate shell. Nucleation typically occurred near the glass cantilever on either side of the particle. The hydrate shell then grew along the cyclopentane–water interface from both directions until the entire shell was formed.Cohesion force
For a hydrate cohesion force experiment, particles were created on both cantilevers (Fig. 3). The particles were annealed for 30 minutes before the pull-off measurements were performed. In order to perform a cohesion force pull-off measurement, the top particle was brought into contact with the bottom particle at a known preload force (∼2.5 mN m−1), where it was held for a ten-second contact time. The top particle was then pulled away at constant velocity until the particles broke apart. Because the spring constant (k) of the cantilever is known, Hooke's law (eqn (2)) can be used with the displacement of the particles (ΔD) at their separation point to calculate the cohesive force (FA) between the particles. See Aman12 for more details on this measurement method.Interfacial tension
Interfacial tension measurements were performed using a CAM 200 apparatus by KSV Instruments using a pendent droplet method. Measurements were performed using Mineral Oil 70T as the light phase and deionized water as the heavy phase. Mineral Oil 70T (composition in Appendix A) was chosen as the light phase in place of cyclopentane due to its low volatility, which allows long-term measurements using surfactants (without concentration changes due to evaporation). Measurements were performed at ambient temperature and pressure. Surfactant additives were added to the oil phase prior to the start of the experiment. Experiments were performed by adding a droplet of deionized water into the mineral oil using a syringe. The curvature of the droplet at its maximum size that is stable on the needle is regressed to determine the interfacial tension between the two fluids. Each measurement was allowed to continue until it was certain that steady state had been reached (typically 60 minutes). Values reported are the averages of at least 5 repeat measurements of systems under identical conditions.Materials
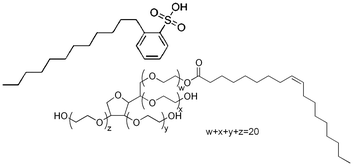
Cyclopentane (Sigma Aldrich >99% purity) was chosen as the hydrate former for this study. Cyclopentane is able to stabilize structure II hydrates (the same hydrate structure as that formed in flowlines) at atmospheric pressure. In addition, cyclopentane is non-miscible with water, and forms a stable hydrate phase below 7.7 °C, such that experiments can be performed above the ice point to avoid ice contamination in the experimental results. Two surfactants were chosen for this study: dodecylbenzenesulfonic acid (DDBSA; 98% purity, Pilot Chemical Company) and Tween 80 (Spectrum Chemical Manufacturing). The structures of these surfactants are shown in Fig. 6. Mineral Oil 70T (STE Oil Company, ρ = 0.8558 g cm−3) was used as described above to test the relative changes in interfacial tension without the high volatility of cyclopentane making long measurements impractical.DBBSA is frequently used as an industrial dispersant, while Tween 80 has been studied as a model surfactant. Two concentrations of each surfactant were selected: 10−8 M was used for each surfactant as a value below the Critical Micelle Concentration (CMC). For Tween 80, a secondary concentration of 10−4 M was used to be above CMC, which for Tween 80 is approximately 10−5 M when measured in a water bulk phase.26 Concentrations of DDBSA above the 10−5 M cause extreme, rapid morphological changes which are not the focus of this work,27 so 10−6 M was selected, which is still below CMC of approximately 1 M in a bulk phase of Mineral Oil 70T.27
Results and discussion
The force necessary to puncture a hydrate shell may be an important parameter in high shear conditions. If a particle's shell is weakened by the presence of surfactants, shear and collisions with other particles may be enough to break open the hydrate shell, releasing the unconverted water inside. This water would be able to convert rapidly as it builds upon the existing hydrate and encounters multiple nucleation sites. Fig. 7 shows a hydrate particle that was punctured using a glass cantilever. Upon breaking the hydrate shell, the water rapidly moved up the cantilever and converted into hydrate. The interior of the hydrate particle filled with cyclopentane as the water was displaced. While this phenomenon was not seen in all puncture force experiments, possibly because hydrates quickly grow to cover small cracks, it illustrates a possible effect of compromised hydrate shell integrity.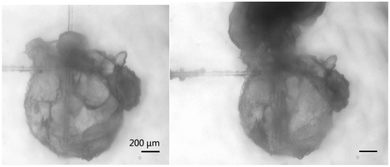 | ||
| Fig. 7 Hydrate particle before (left) and after puncturing (right). This illustrates an extreme example of the possible effects of lowering shell strength. | ||
Fig. 8 shows the force required to puncture the hydrate shell as a function of annealing time at three different subcoolings (ΔTsub = Teqm − Texpt). The force required to puncture the hydrate shell was shown to increase with annealing time, but it was only a weak function of subcooling. The growth rate of the hydrate shell is dependent on the subcooling.26 However, the similar force/strength of the hydrate shell at various subcoolings indicates that the annealing period of the hydrate shell is more dominant than the subcooling. The increase in shell strength as a function of annealing time indicated that this is a mass transfer limited process (Fig. 8).
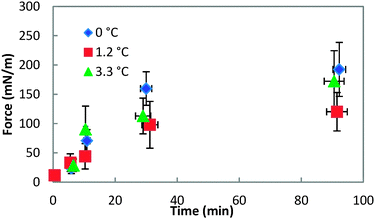 | ||
| Fig. 8 Force required to puncture the hydrate shell at three different temperatures for annealing times up to 90 minutes. Error bars represent the standard deviation of 4+ repeat measurements. | ||
In contrast to the minimal dependence of puncture force on subcooling, the puncture force showed a significant decrease when surfactants were added to the system (Fig. 9). All of the surfactants, regardless of concentration, had a similar effect on the puncture strength, reducing it by 60% to 79% depending on the surfactant/concentration. This change in shell strength in the presence of surfactants indicates that the hydrate shell properties may be altered in some way; possibilities include slower growth leading to a thinner shell, or increased porosity compromising the integrity of the shell.
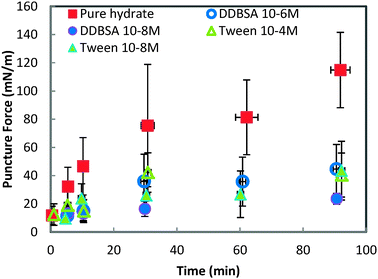 | ||
| Fig. 9 Force required to puncture the hydrate shell with and without surfactants. All experiments are performed at 0.3 °C. Error bars are one standard deviation of 4+ repeat experiments. | ||
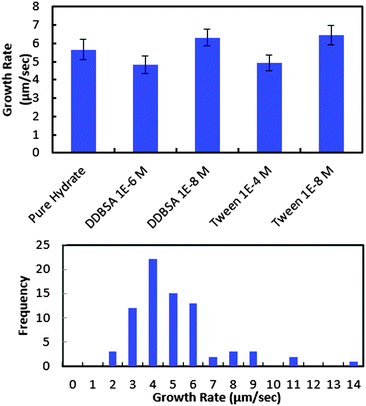
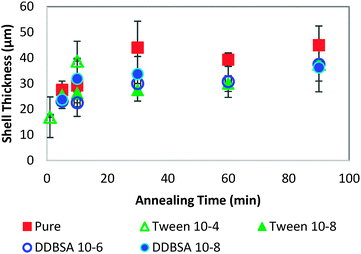
In order to investigate further the decrease in shell strength with the addition of surfactants, the growth rate of the hydrate shell along the water droplet surface was measured for each surfactant system (Fig. 10). The average values reported represent 8–10 separate experiments and a total of 70–100 measurements. A typical distribution of values is shown in the bottom of Fig. 10. Variations of less than ±15% were observed for the surfactant concentrations studied and compared to the system without surfactant. These results indicate that the shell growth rate was not reduced significantly enough by surfactants to explain the decrease in puncture force. The thickness of the hydrate shell was therefore measured and compared for experiments with and without surfactants (Fig. 11). The presence of surfactants was found to slightly reduce the average hydrate shell thickness. However, this reduction is not statistically significant considering the scatter in the data. This scatter in the shell thickness values may be caused by variations in the Z-direction positioning, as mentioned in the Methods and materials section. The small change in shell thickness indicated in Fig. 11 also does not appear to be significant enough to explain the large drop in shell puncture strength seen in Fig. 9.
Because the mass transfer of guest and water molecules across the hydrate shell is very slow,28,29 with estimates ranging from 10−8 to 10−13 m2 s−1, much of the initial shell growth would occur as a function of the concentrations of guest and water molecules at the interface. These experiments cover only short annealing times (up to 90 minutes), so very little shell thickening due to diffusion across the shell may occur. It is important to note that this effect can be dependent on the surfactant added. Other chemical additives may significantly affect the growth rate and shell thickness, such as Kinetic Hydrate Inhibitors, which slow the growth rate, or chemicals such as DDBSA (at higher concentrations), which accelerate growth.27
However, the presence of surfactants may cause a more porous hydrate shell, while simultaneously altering the interfacial tension and the wettability of the hydrate shell. A higher porosity could increase cohesion by supplementing the water layer (increasing H in eqn (1)), while the surface property changes would likely decrease cohesion (decreasing γ and increasing θP). It is difficult to decouple the effect on the cohesion force from these competing factors, though changes in interfacial properties may dominate, since the cohesion force is reduced by all the surfactants tested. Fig. 12 shows the cohesion force for hydrate particles with surfactants, compared to the baseline value of 4.2 mN m−1 without surfactant.
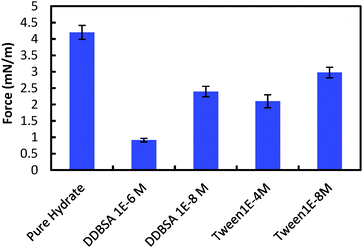 | ||
| Fig. 12 Cohesive forces between two hydrate particles. Error bars are 95% confidence intervals based on 160+ measurements using more than 4 separate particle pairs. | ||
The addition of surfactants had the most significant effect on the cohesion force, compared to other parameters measured (i.e. shell thickness, growth rate), with cohesion forces being reduced by 29% to 78%.
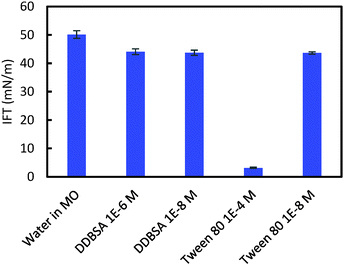
Interfacial tension (IFT) measurements were performed for each hydrate/surfactant system to investigate a possible correlation between the cohesion force, the shell puncture force and the interfacial tension. Fig. 13 shows the IFT results for these systems. DDBSA likely shows no dependence on concentration because both values chosen are below the CMC.30 The IFT results do not correlate with the cohesion force results; this difference may be due to changes in wettability that alter the θP term from eqn (1), or by the presence of hydrates. Aman et al. showed that the apparent CMC for systems with hydrate may occur at lower concentrations than for systems not containing hydrate.30 Tween 80 showed a significant decrease in IFT at the higher concentration, which is above the CMC.31
When examining the changes in shell strength, growth rate, shell thickness, cohesion and IFT, these data suggest the possibility of microscopic changes to the hydrate shell. It is possible that this change is caused by an increase in the porosity of the hydrate shell; though one might expect an increase in the cohesion force as a result of the increased water being transported from the unconverted centre of the hydrate with increasing porosity. Changes in wettability caused by the surfactants could counteract this effect. Therefore, it seems that the most likely change is an alteration of the shell's microscopic structure itself, as observed in Karanjkar et al.'s study.11 Although no significant differences in the macroscopic hydrate structure/morphology were observed, the microscopic structure may have been altered by the presence of surfactants in a way that compromised the strength of the hydrate shell. Fig. 14 shows there is no significant difference in the macroscopic morphology of the hydrate crystals both without and with the surfactants added.
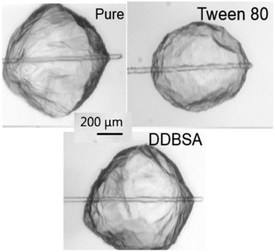 | ||
| Fig. 14 Visual comparison of macroscopic hydrate morphology without and with surfactants present during growth. | ||
A hypothesis for the mechanism of this surfactant interaction with the hydrate shell is shown in Fig. 15. Because these surfactants do not cause significant macroscopic morphological changes, it may be that rather than interact with the hydrate cages themselves, the surfactant molecules instead adsorb at the crystal interface as the hydrates are forming. These molecules can thereby provide steric hindrance for the growing hydrate shell, rather than form in the neatly ordered structure depicted on the left side of Fig. 15. The hydrate shell may have microscopic irregularities associated with the hydrate crystallites growing around the surfactant molecules. This could account for a decrease in mechanical strength without the alteration of the thickness of the hydrate shell, and lead to a simultaneous reduction in the cohesion force due to the hydrate surface becoming oil wet rather than water wet due to the presence of surfactant molecules.
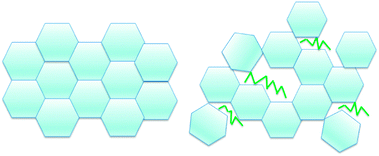 | ||
| Fig. 15 Conceptual picture showing how surfactants may cause steric hindrance and hence shell weakening during hydrate shell formation. | ||
Conclusions
Surfactants can have a wide range of effects on hydrate particle structure and interactions, and these phenomena are just beginning to be investigated. The addition of DDBSA and Tween 80 to cyclopentane before hydrates are formed causes the hydrate shells to puncture with significantly less force than is required for pure hydrates. This indicates the hydrate shell strength, in the presence of these surfactants, is reduced compared to pure hydrates. However, this change is caused neither by a change in the hydrate growth rate, nor by a difference in the thickness of the hydrate. The addition of surfactants was found from micromechanical measurements to reduce the hydrate particle cohesion force. Changes in the shell structure or porosity of the hydrate shell could explain the changes in the shell strength. These insights allow a better understanding of the effect that chemicals can have when hydrates are formed during production. Advancing the understanding of the mechanics of the alterations in the hydrate shell with the addition of surfactants may allow development of more effective chemicals to prevent hydrate agglomeration and plugging.Appendix A
| Component | Mass fraction [%] |
|---|---|
| Oil sample analysis was performed by a third party. | |
| C16 | 0.09 |
| C17 | 1.23 |
| C18 | 5.22 |
| C19 | 11.75 |
| C20 | 16.04 |
| C21 | 17.04 |
| C22 | 12.20 |
| C23 | 6.34 |
| C24 | 4.23 |
| C25 | 3.76 |
| C26 | 3.29 |
| C27 | 2.66 |
| C28 | 2.27 |
| C29 | 1.56 |
| C30+ | 12.34 |
Acknowledgements
We would like to thank the current and past CSM Hydrate Consortium members for their support (current and past members): BP, Chevron, ConocoPhillips, ENI, ExxonMobil, Halliburton, IMP, MultiChem, Nalco Champion, One Subsea, Petrobras, Schlumberger, Shell, Statoil and Total.References
- E. Sloan and C. Koh, Clathrate Hydrates of Natural Gases, CRC Press, Taylor & Francis Group, Boca Raton, FL, 2007 Search PubMed.
- D. Turner, K. Miller and E. Sloan, Chem. Eng. Sci., 2009, 64, 3996–4004 CrossRef CAS.
- C. Taylor, MS thesis, Colorado School of Mines, 2006.
- J. Boxall, C. Koh, E. Sloan, A. Sum and D. Wu, Langmuir, 2012, 28, 104–110 CrossRef CAS PubMed.
- S. Tcholakova, N. Denkov and T. Danner, Langmuir, 2004, 20, 7444–7458 CrossRef CAS PubMed.
- J. Delgado-Linares, A. Majid, E. Sloan, C. Koh and A. Sum, Energy Fuels, 2013, 27, 4564–4573 CrossRef CAS.
- C. Liu, M. Li, G. Zhang and C. A. Koh, Phys. Chem. Chem. Phys., 2015, 17(30), 20021–20029 RSC.
- J. Jung and J. Santamarina, Geochem., Geophys., Geosyst., 2011, 12, 1–9 CrossRef.
- Y. Abe, Y. Abe, I. Aya and K. Yamane, J. Therm. Sci. Technol., 2007, 2, 13–18 CrossRef CAS.
- R. Ohmura, S. Kashiwazaki and Y. Mori, J. Cryst. Growth, 2000, 218, 372–380 CrossRef CAS.
- P. Karanjkar, J. Lee and J. Morris, Cryst. Growth Des., 2012, 12, 3817–3824 CAS.
- Z. Aman, E. Brown, E. Sloan, A. Sum and C. Koh, Phys. Chem. Chem. Phys., 2011, 13, 19796–19806 RSC.
- C. Taylor, L. Dieker, K. Miller, C. Koh and E. Sloan, Proceedings of the 6th International conference on Gas Hydrates, 2008.
- S. Yang, D. Kleehammer, Z. Huo, E. Sloan and K. Miller, J. Colloid Interface Sci., 2004, 277, 335–341 CrossRef CAS PubMed.
- L. Dieker, Z. Aman, N. George, A. Sum, E. Sloan and C. Koh, Energy Fuels, 2009, 23, 5966–5971 CrossRef CAS.
- Z. Huo, E. Freer, M. Lamar, B. Sannigrahi, D. Knauss and E. Sloan, Chem. Eng. Sci., 2001, 56, 4979–4991 CrossRef CAS.
- M. Anklam, J. York and L. Helmerich, AIChE J., 2008, 54, 565–574 CrossRef CAS.
- G. Aspenes, S. Høiland, A. Borgund and T. Barth, Energy Fuels, 2010, 24, 483–491 CrossRef CAS.
- K. Erstad, I. Hvidsten, K. Askvik and T. Barth, Energy Fuels, 2009, 23, 4068–4076 CrossRef CAS.
- J. Sjöblom, B. Øvrevoll, G. Jentoft, C. Lesaint, T. Palermo, A. Sinquin, P. Gateau, L. Barre, S. Subramanian, J. Boxall, S. Davies, L. Dieker, D. Greaves, J. Lachance, P. Rensing, K. Miller, E. Sloan and C. Koh, J. Dispersion Sci. Technol., 2010, 31, 1100–1119 CrossRef.
- Z. Aman, E. Sloan, A. Sum and C. Koh, Energy Fuels, 2012, 26, 5102–5108 CrossRef CAS.
- Y. Rabinovich, M. Esayanur and B. Moudgil, Langmuir, 2005, 21, 10992–10997 CrossRef CAS PubMed.
- D. Nenow and A. Trayanov, J. Cryst. Growth, 1986, 79, 801–805 CrossRef.
- M. Bienfait, Surf. Sci., 1992, 272, 1–9 CrossRef CAS.
- A. Döppenschmidt and H. Butt, Langmuir, 2000, 16, 6709–6714 CrossRef.
- R. M. C. Dawson, Data for Biochemical Research, Oxford University Press, New York, NY, 3rd edn, 1986 Search PubMed.
- Z. Aman, PhD thesis, Colorado School of Mines, 2012.
- S. Davies, E. Sloan, A. Sum and C. Koh, J. Chem. Phys., 2010, 114, 1173–1180 CAS.
- S. Alavi and J. A. Ripmeester, Angew. Chem., 2007, 46, 6102–6105 CrossRef CAS PubMed.
- Z. Aman, K. Olcott, K. Pfeiffer, E. Sloan, A. Sum and C. Koh, Langmuir, 2013, 29, 2676–2682 CrossRef CAS PubMed.
- A. Patist, S. Bhagwat, K. Penfield, P. Aikens and D. Shah, J. Surfactants Deterg., 2000, 3, 53–58 CrossRef CAS.
| This journal is © the Owner Societies 2016 |


