
 Open Access Article
 This Open Access Article is licensed under a Creative Commons Attribution-Non Commercial 3.0 Unported Licence
Fractal growth of ZrO2 nanoparticles induced by synthesis conditions†
P.
Stolzenburg
a,
A.
Freytag
bc,
N. C.
Bigall
bc and
G.
Garnweitner
 *ac
*ac
aInstitute for Particle Technology and Laboratory for Emerging Nanometrology, Technische Universität Braunschweig, Volkmaroder Str. 5, D-38104 Braunschweig, Germany. E-mail: g.garnweitner@tu-braunschweig.de
bInstitute of Physical Chemistry and Electrochemistry, Leibniz Universität Hannover, Callinstr. 3A, D-30167 Hannover, Germany
cLaboratory for Nano and Quantum Engineering, Schneiderberg 39, D-30167 Hannover, Germany
First published on 10th October 2016
Abstract
Strong changes in morphology and phase composition of zirconia nanoparticles can be induced by altering the growth conditions during nanoparticle synthesis. Here, we demonstrate that fractal ZrO2 nanocrystals showing high specific surface area can be obtained in the nonaqueous synthesis by variation of temperature and precursor concentration. The growth process was studied in detail revealing a size increase from 2.7 to 7 nm as well as a change in the polymorphic composition from tetragonal to monoclinic zirconia. TEM measurements of samples withdrawn over the course of the synthesis showed that particles grow from roundish to dendritic shapes during the phase transformation. In contrast to the common assumption that the phase transition is controlled by thermodynamics, our data shows that the transition is rather governed by kinetics.
1. Introduction
Zirconium oxide is a highly attractive ceramic material with excellent mechanical and catalytic properties, good ionic conductivity and high temperature resistance.1,2 Its industrial applications range from technical ceramics with high durability and good mechanically stability,3 gas sensors,4 biomedical devices5 to catalysts for a broad range of significant industrial syntheses.6–9 The use of nanoparticular zirconia can lead to advantageous effects, such as transparency, higher toughening or better catalytic activity. However, the material performance is highly dependent on properties such as size, morphology and crystallinity of the nanoparticles. Morphology may influence the post processing of the obtained nanoparticles, e.g. redispersing in polymers for preparation of nanocomposites10 or surface modification steps11 in which organic ligands are bound to the available surface of the used nanoparticles. Moreover, morphological characteristics and morphology control are highly interesting for catalyst design as the available surface and therefore catalytic activity directly depend on the morphology of the used nanoparticles.12,13 Nano-crystalline zirconia is a widely applied and promising catalyst14–16 and is able to significantly enhance reaction rates due to structural and textural properties.17 These properties go hand in hand with the size and morphology of the primary nanoparticles which have been observed before in spherical, rod or rice grain shapes.17,18 Whilst rough dendritic or multipod-like structures would be highly desired for many applications due to the high specific surface area, they have not been reported to date.The nonaqueous sol–gel method is able to yield well-defined and highly crystalline metal oxide nanoparticles with monodisperse size distributions and is feasible to be used in a larger scale. In contrast to fast particle formation reactions that are challenging to control, the nonaqueous approach allows good control over the particle formation process at comparably mild conditions.19 Our previous works have shown that the solvent20 as well as the synthesis conditions exert strong influence on particle growth and crystallization kinetics for various nanoparticle systems.21,22 In this work, we show that the morphology of ZrO2 can be altered by growth conditions and hence tailored for various purposes. To this end, deep understanding of the particle formation is required and necessitates a detailed study of the influence of synthesis parameters on the particle properties. We focus on the impact of temperature, precursor concentration and initial seeding and show how altering these conditions influences particle growth and eventually, size and shape of the final nanocrystals. The growth kinetics were investigated by withdrawing samples from the reactor system over the entire course of the synthesis.
2. Experimental
2.1 Synthesis
The synthesis was conducted under solvothermal conditions in a 1.5 L pressure vessel (Poly-clave type 3/1, Büchi Glas Uster) as illustrated in Fig. 1. Pressure and temperature were constantly monitored and the solution was agitated by a propeller-baffle system. The reactor was heated through an external thermostat (Huber Tango HT) which allowed the system to reach the set synthesis temperature within 30 minutes. Zirconium n-propoxide (70 wt% in 1-propanol, Sigma Aldrich) and benzyl alcohol (97 wt%, Merck) were poured directly into the reactor in mixtures corresponding to initial precursor concentrations [Zr]0 of 180, 240 and 360 mmol L−1. Afterwards, the system was heated to a constant synthesis temperature which was varied in a range of 220 to 270 °C from 6 hours to 6 days. A standard synthesis was defined and performed at 250 °C with an initial precursor concentration [Zr]0 of 180 mmol L−1.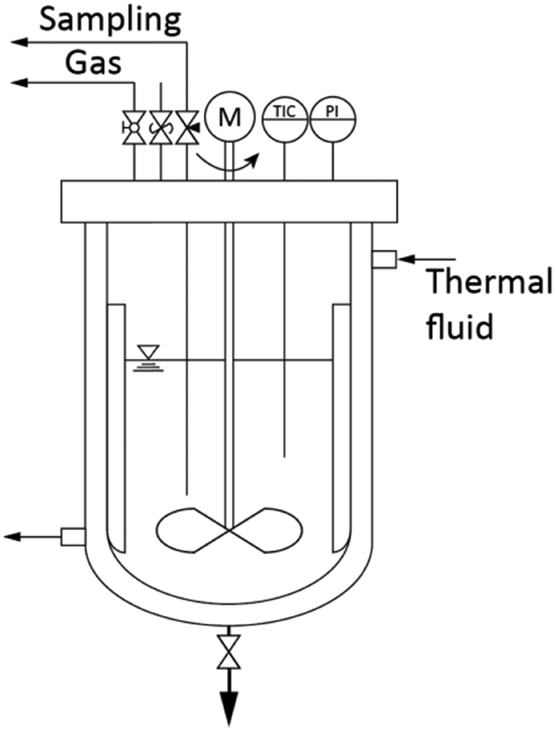 | ||
| Fig. 1 1.5 L reactor system allowing temperatures up to 300 °C and pressures up to 60 bar. | ||
2.2 Characterization
The kinetics of the system were followed by taking samples of the reaction mixture (15 mL each) via a needle valve located at the top of the 1.5 L reactor. The samples were quenched in a cooled water bath, centrifuged and phase separated by decanting the supernatant (liquid phase). The zirconium concentration in solution [Zr]i was determined by slowly heating 5 mL supernatant up to 1000 °C and subsequent gravimetric analysis of the resulting ZrO2. The reaction mixtures, as well as the quenched gas phase above the reaction mixture were analyzed by 1H-NMR spectroscopy using a Bruker DRX-400 device at 400 MHz and the solvent d6-DMSO. 1H-NMR and Karl Fischer titration (Aqua 40.00, Analytik Jena) were used to follow the water content during the synthesis.The solid fractions were washed multiple times with ethanol and dried under vacuum at room temperature. Crystallite sizes and phase compositions were determined by powder X-ray diffraction (Cu Kα radiation; Empyrean Cu LEF HR goniometer; Empyrean series 2, PANalytical, PIXcel-3D detector; Si wafer; 20–90°, step size 0.05°) and Rietveld refinement using the reference patterns of the tetragonal (ICSD code: 98-006-6789) and monoclinic (ICSD code: 98-008-0045) zirconia phases. Crystallite sizes were then obtained from the (001) reflection of the tetragonal and the (11![[1 with combining macron]](https://www.rsc.org/images/entities/char_0031_0304.gif) ) reflection of the monoclinic phase. Thermogravimetric analysis (TGA/SDTA851, Mettler Toledo) was used to determine the inorganic content of the solids. High resolution transmission electron microscopy (HRTEM) was performed using a JEOL JEM-2100F-UHR to observe the growth of the nanoparticles and to characterize their final properties. For better investigation of the morphology, the particles were dispersed and stabilized in chloroform as described earlier.23 The BET surface area was determined by the nitrogen adsorption method with a Nova 2000e (Quantachrome) device. Solid samples were degassed for 4 h at 200 °C.
) reflection of the monoclinic phase. Thermogravimetric analysis (TGA/SDTA851, Mettler Toledo) was used to determine the inorganic content of the solids. High resolution transmission electron microscopy (HRTEM) was performed using a JEOL JEM-2100F-UHR to observe the growth of the nanoparticles and to characterize their final properties. For better investigation of the morphology, the particles were dispersed and stabilized in chloroform as described earlier.23 The BET surface area was determined by the nitrogen adsorption method with a Nova 2000e (Quantachrome) device. Solid samples were degassed for 4 h at 200 °C.
3. Results and discussion
3.1 Reactor synthesis
The syntheses were performed in a 1.5 L batch reactor system under constant agitation. Temperature and pressure were monitored over the course of the synthesis which was investigated in a temperature scope from 220 to 270 °C with initial precursor concentrations of 180, 240 and 360 mmol L−1.To elucidate the molecular reaction mechanisms, NMR spectroscopy was performed on samples before and after the formation of nanoparticles, i.e. before and after the chemical reaction (Fig. 2). The signals were assigned to the major organic components in the solution, with the characteristic peaks A for n-propanol, B for benzyl alcohol, C for dibenzyl ether and D for benzyl n-propyl ether, showing that the synthesis in principle proceeds via an ether elimination mechanism.19
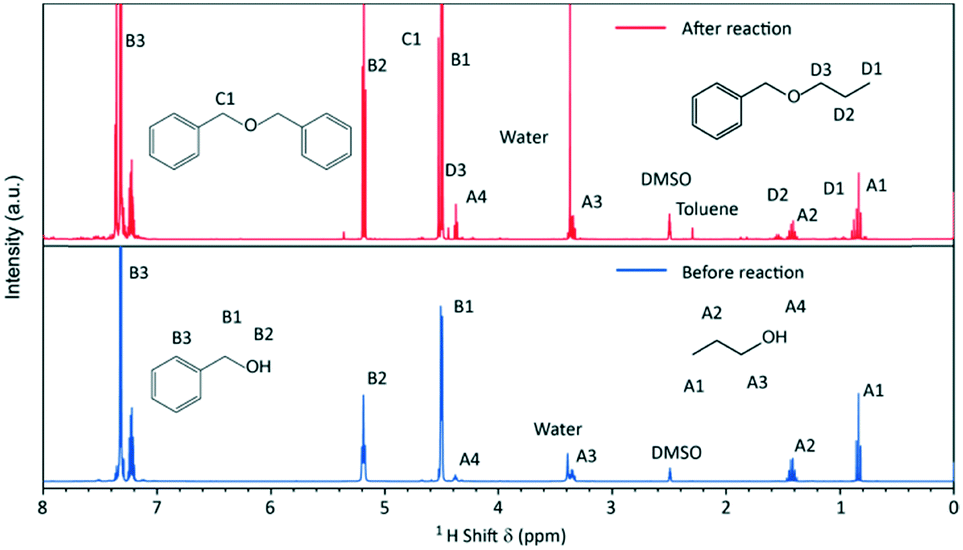 | ||
| Fig. 2 1H-NMR spectra of the initial reaction mixture (before reaction) and of the reaction mixture after 26 h of a standard synthesis (after reaction). | ||
The characteristic peaks for dibenzyl and benzyl n-propyl ether are not present in the spectrum of the initial reaction mixture. The evolving ether is mostly dibenzyl ether (BnOBn) accompanied by a low quantity of benzyl n-propyl ether (BnOnPr). Further by-products of the synthesis are toluene and water, which have been reported in previous works for the nonaqueous sol–gel synthesis of titania nanoparticles.24
Since the synthesis temperatures were above the boiling points of the solvent and by-products, we additionally took a sample from the gas phase at 250 °C (after 26 h of reaction) and performed NMR spectroscopy to derive information about the gaseous products. The sampling procedure comprised a quenching step where the gaseous phase was condensed by cooling the pipe behind the gas valve (Fig. 1). The recovered gas sample consisted of two separate liquid phases at room temperature which were identified by 1H-NMR spectroscopy (Fig. 3) to an aqueous and an organic phase, whereas the latter contained mostly benzyl alcohol, n-propanol and benzyl n-propyl ether that resulted from the ligand exchange and condensation reactions. In contrast to the liquid phase, dibenzyl ether was not identified and might only be present in minor concentrations, as the reaction temperature was below the boiling point of 298 °C.
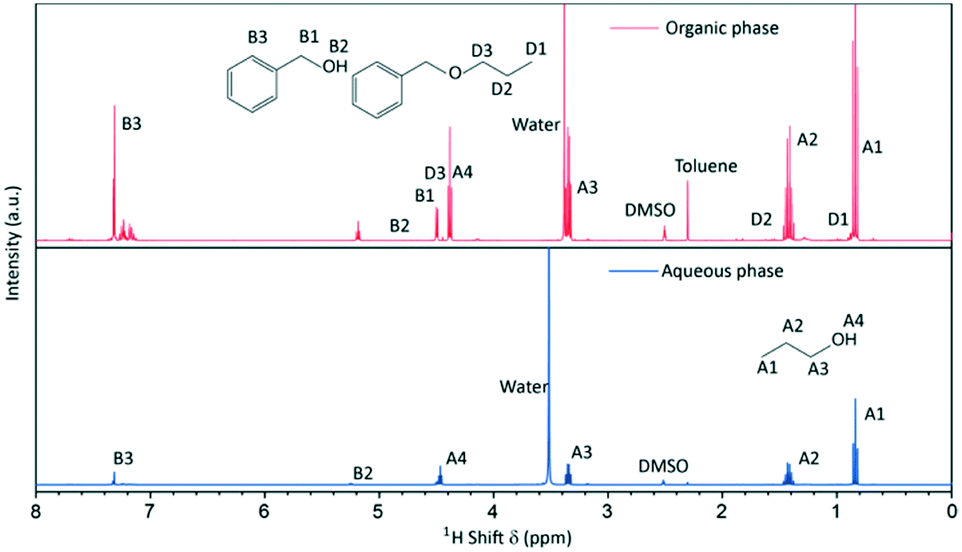 | ||
| Fig. 3 1H-NMR spectra of the quenched gas phase sample taken during a standard synthesis consisting of an aqueous and an organic phase. | ||
It is known that the organic condensation reactions that promote the formation of nanoparticles result partially in the release of water.19 For the nonaqueous TiO2 synthesis in particular, water was shown to play a crucial role in an auto-catalyzing process which induced a rapid pressure increase, accompanied by a nucleation burst, that resulted in a full yield of nanoparticles.24 For the zirconia system, we observe no such phenomena (see below) which leads to the assumption that water solely stems from an ether condensation process of the organic solvent catalyzed by the ZrO2 nanoparticles. Thus, the zirconia synthesis is comprised of a two-step reaction where the precursor zirconium(IV) propoxide (Zr(OnPr)4) first reacts with the solvent benzyl alcohol (BnOH) via a ligand exchange to an intermediate product (Fig. 4, I), which then reacts in a subsequent ether condensation reaction to ZrO2 nanoparticles (Fig. 4, II).
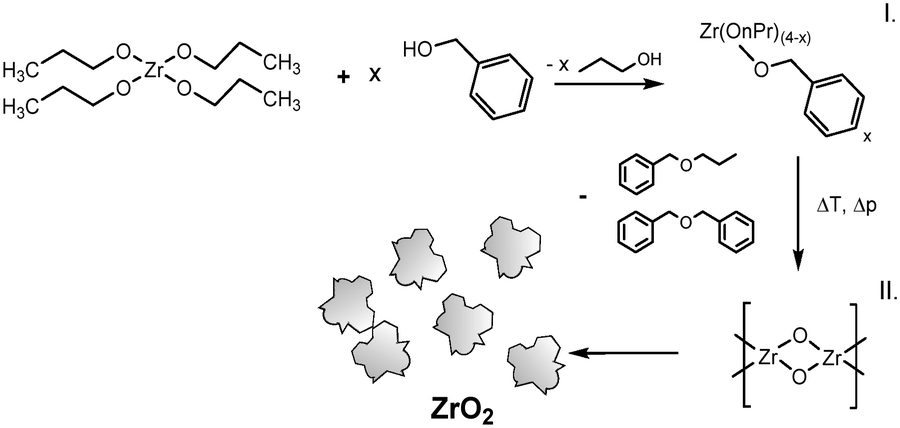 | ||
| Fig. 4 Reaction mechanism of the nonaqueous synthesis of ZrO2 nanoparticles. | ||
Fig. 5 shows a diffractogram of the final product synthesized at standard conditions and the reference patterns of the tetragonal phase (ICSD code: 98-006-6789) and the monoclinic phase (ICSD code: 98-008-0045). One can observe the two characteristic reflections that correspond to the (001) lattice plane of the tetragonal and to the (11) lattice plane of the monoclinic phase. The phase composition of the obtained nanopowders was determined by Rietveld refinement from XRD analysis of the solid samples, whereby the volume fractions corresponded well to values calculated by the Toraya method,25 which uses an integrated intensity ratio of the corresponding reflections from the tetragonal and monoclinic patterns. According to XRD analyses, the product consists of 56 vol% of the monoclinic phase with a size of 5.5 nm for the tetragonal and 4.9 nm for the monoclinic phase. Transmission electron microscopy (Fig. 6) revealed that the obtained nanoparticles possess a dendritic shape with an average size of 6.7 nm (longest particle axis) in a narrow size distribution. The observed deviation of the determined crystallite sizes between XRD and TEM analysis can thus be related to the nonspherical morphology. High resolution TEM analysis, shown in the inset in Fig. 6, suggests that the particle has one consistent lattice structure, thus being one single crystal and not an assembly of multiple particles. The lattice spacing was measured to 3.2 Å which most likely corresponds to the value of 3.16 Å of the monoclinic (11) plane.26 Nevertheless, the spacing of the tetragonal (001) plane amounts to 2.95 Å and thus is difficult to differentiate from the monoclinic lattice plane for single crystallites during HRTEM analysis.
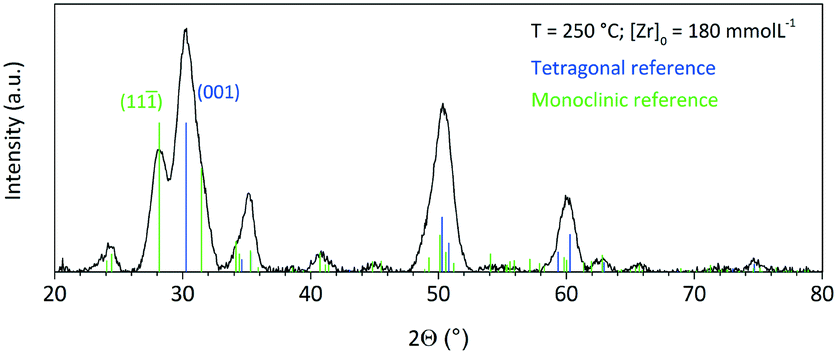 | ||
| Fig. 5 Powder XRD pattern of the final product synthesized at standard conditions; reference patterns of the tetragonal (ICSD code: 98-006-6789) and monoclinic phase (ICSD code: 98-008-0045). | ||
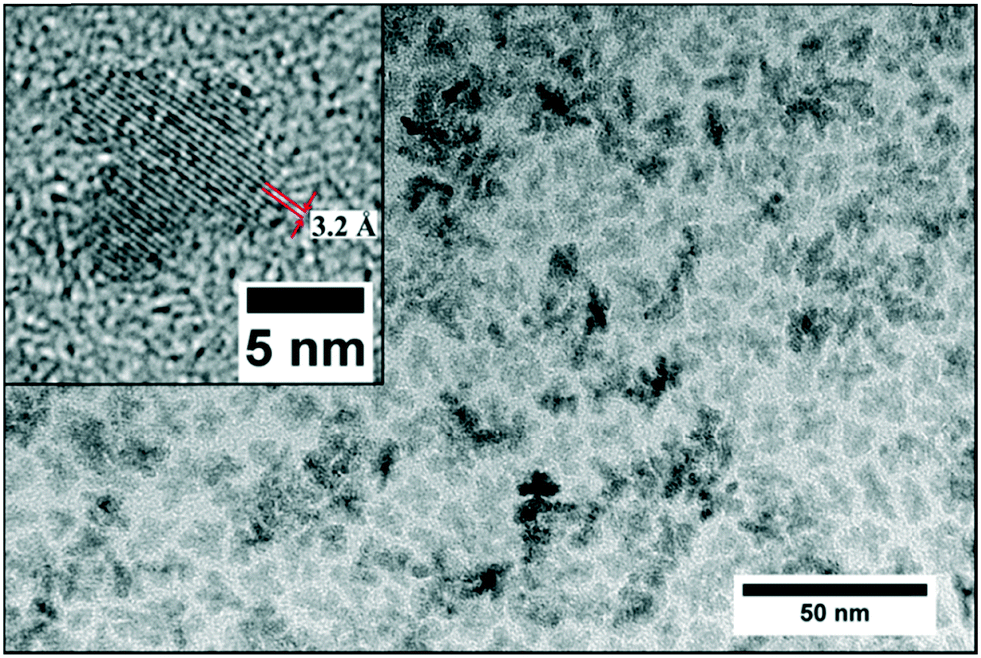 | ||
| Fig. 6 Transmission electron micrograph of a post-stabilized final product from a standard synthesis conducted at 250 °C ([Zr]0 = 180 mmol L−1); the inset shows a dendritic single crystallite. | ||
Consequently, single particles may as well consist of both the tetragonal and monoclinic phase as we have already postulated before.27 In addition, our group has shown for different systems that the particle morphology is influenced by temperature, solvent or precursor concentration. For the TiO2 system, increasing the synthesis temperature promotes elongated particle growth,28 whereas the morphology of aluminium zinc oxide nanocrystals can be adjusted from spherical to elongated shapes through different solvent ratios of benzyl alcohol and benzylamine.20 The morphology of ZrO2 particles is dependent on the synthesis temperature, whereby lower temperatures yield edgy particles and high temperatures yield spherical particles.27 Still, single crystallites with such fractal structures as shown in Fig. 6 have not been observed. A detailed discussion about the dendritic growth phenomena can be found in section 3.2 where we followed the development of the dendritic structures during the synthesis via TEM analysis.
In order to elucidate the driving force of this peculiar particle formation, we traced the solid and liquid phases over the course of the synthesis by sampling and subsequent phase separation through centrifugation. In a first step, we investigated the molecular reaction kinetics through analysis of the liquid phase. For the reaction progress, a concentration of solubilized zirconium [Zr]i is defined as the sum concentration of the precursor as well as all solubilized intermediates prior to nanoparticle formation and was determined by gravimetric analysis of the reaction mixture after removal of the formed nanoparticles by centrifugation.
The zirconia concentration was normalized by the initial precursor concentration to [Zr]i/[Zr]0 and the yield of the reaction is then defined as (1 − [Zr]i/[Zr]0). Fig. 7 shows the development of yield, pressure and water content over the course of a standard synthesis. For better illustration, the course of the synthesis is subdivided into 3 stages which are discussed separately as each stage comprises a characteristic step of this synthesis. The pressure development is a representative indicator for the phenomena during the synthesis, as the vapor–liquid equilibrium (VLE) that is present in the system at high temperatures is very sensitive to temperature changes under the investigated conditions. A synthesis is started by mixing the precursor Zr(OnPr)4 with the solvent and initiating the heating procedure, which required 28 min (Fig. 7) until the reaction temperature of 250 °C was reached. The first pressure increase is mainly due to the VLE and additional 1-propanol that is released by a ligand exchange. Several authors have shown that the ligand exchange reaction of transition metal alkoxides in organic solvents commences already at ambient temperatures29–31 and can be assumed to be completed before the reaction mixture reaches the final temperature.32 Moreover, one can observe a slight but immediate pressure decrease after the heating period (Fig. 7) which is caused by miniature gas leaks. An ongoing ligand exchange after the heating period would release more of the volatile 1-propanol into the system and would compensate the loss or raise the pressure.
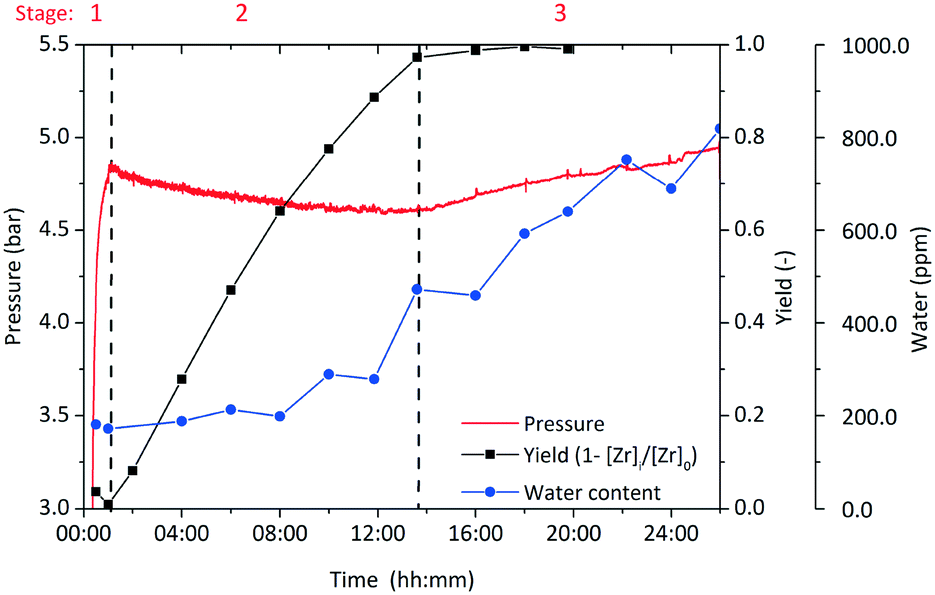 | ||
| Fig. 7 Development of yield, overpressure and water content within the solution during a standard synthesis; stage 1 heating period; stage 2 particle formation; stage 3 catalytic condensation of BnOH on ZrO2 surface. | ||
The loss in pressure amounts to around 200 mbar within 12 hours before the pressure reaches a minimum and starts to ascend again. We assume that the ascending pressure is caused by release of water due to the catalytic condensation reaction of BnOH (and n-PrOH) on the surface of the zirconia nanoparticles. Therefore, we investigated the water content over the course of the synthesis by Karl Fischer titration (Fig. 7) and found that it only starts to rise when a significant amount of particles is present in the system (half-way through the increase of the yield in stage 2). After completion of the particle formation, the water concentration follows a linear trend which shows the zero-order kinetics of the catalytic reaction. Thus, we conclude that no excess of water is developed through the chemical reactions that lead to ZrO2 nanoparticles but water is solely produced from the subsequent catalytic reaction.
Zirconia is the only solid product and hence the progress of particle formation corresponds to the amount of zirconium that transforms from its initial dissolved molecular form into the solid state. In stage 2 (Fig. 7), the particle formation starts once the system reaches its final temperature which was expected since the nonaqueous sol–gel-method demands elevated temperatures.33 On the other hand, a sample taken right after reaching the reaction temperature showed no sign of particle formation as the solution was clear and the determined zirconium concentration [Zr]i was equal to [Zr]0. This discrepancy is explained by a time lag between reaching the synthesis temperature and the onset of the particle formation, i.e. the time to overcome the kinetic barrier for nucleation, the so called induction time tind. Induction times have been observed previously for the titania system24 and were detected from the onset of a spontaneous pressure increase that is due to a release of water concurrent to the particle formation process. As for the zirconia system no significant amount of water is released, no pressure increase that can be used to indicate the induction time was found. Hence, we proved the appearance of an induction time through analyzing the samples, which did not allow a precise determination due to insufficient time resolution. The samples withdrawn after the induction time possessed increased turbidity and contained an increasing amount of solid material.
Gravimetric analysis revealed that the yield follows a linear trend up to 100%. Such high yields are known for the sol–gel synthesis and have been reported before for other nonaqueous nanoparticle systems.28,34–36 We found that the observed linear trend best fits zero-order kinetics. For the very similar titania system, we have observed pseudo-first-order kinetics,24 whereby a second-order reaction had been expected when considering that the solvent BnOH is also a reactant. Due to the great excess of BnOH, the impact of the BnOH concentration on the reaction is minor which leads to the observation of pseudo-first-order kinetics. Based on experimental data, Hu et al. describe a hydrothermal synthesis of ZrO2 nanoparticles with a first-order kinetic model37 and show that the reaction rate is independent of the initial precursor concentration.
Particle formation along the evolution of the yield was followed by X-ray diffraction analysis which showed that particles directly form as crystalline zirconia in the tetragonal and monoclinic polymorphs. Fig. 8 shows the evolution of the crystallite sizes determined from the (001) reflection for the tetragonal phase and the (11) reflection for the monoclinic phase with crystallites growing from 3.6 and 3.9 nm to sizes of 5.5 and 4.6 nm, respectively. In addition, we followed the evolution of the (112) reflection for the tetragonal phase and the evolution of the (111) reflection of the monoclinic phase (Fig. S1†) and found that the evolution does not only follow the same trend, but that the crystallite sizes are in good accordance with the respective crystallite sizes determined from the (111) and the (11) reflections. Thus, primary particle growth is from now on described by the crystallite sizes calculated from the (111) and (11) lattice planes. In addition, the growth seems to follow the same trend as the yield and overall kinetics, which is conclusive with the assumption that particle formation is mainly controlled by the kinetics of the chemical reactions that lead to particle formation. Thereby, crystallite growth ends when approaching a complete yield (end of stage 2) and further particle growth only occurs due to secondary growth mechanisms such as agglomeration and coarsening. According to our experimental data, the monoclinic crystallites grow slightly further in stage 3 (Fig. 8) which might be due to Ostwald ripening or a tetragonal-to-monoclinic phase transformation.38 Other experiments proved the growth of both crystallite fractions (illustrated in the ESI† section Fig. S2) when the suspension was left in the reactor under equal conditions for longer periods (4–5 days after the particle formation) which supports the assumption of an occurring Ostwald ripening process. The coarsening of metal oxide nanoparticles has been studied in detail by Oskam et al.39 who state that this process follows the Lifshitz–Slyozov–Wagner theory40 and is dependent on solvent, precursor and temperature.
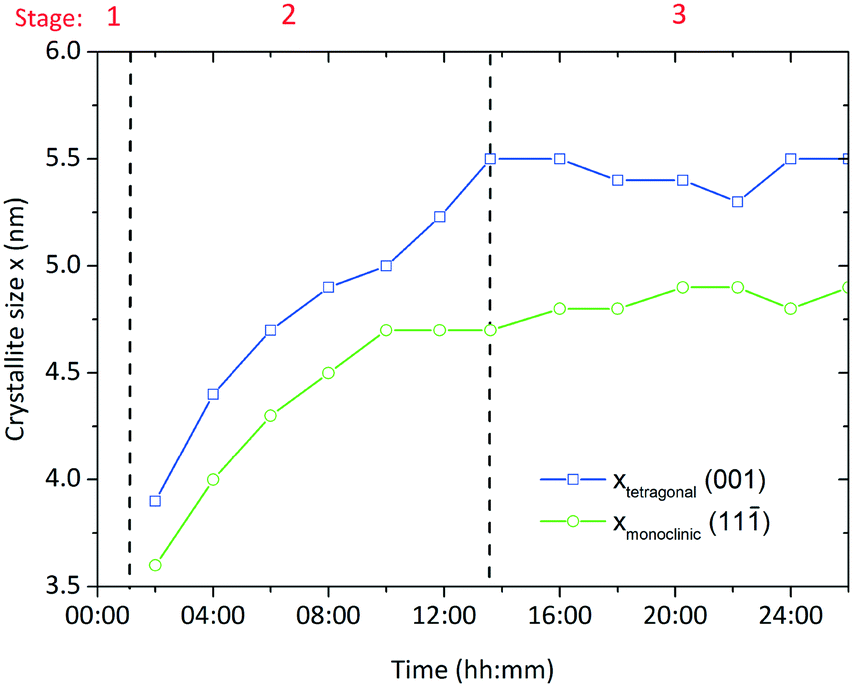 | ||
| Fig. 8 Development of the crystallite size during a standard synthesis; stage 1 heating period; stage 2 particle formation; stage 3 catalytic condensation reaction. | ||
3.2 Particle growth and polymorphic transformation
We observed that particle properties change drastically when the nanoparticles are synthesized at 270 °C, i.e. from larger sizes and dendritic morphologies to smaller sizes and spherical morphologies (Fig. 9). Interestingly, these products possessed the highest tetragonal phase content, whereas particles synthesized 240 °C yielded the highest monoclinic phase content. To investigate the mechanisms of dendritic growth and the phase transition in further detail, we performed TEM (Fig. 10a–c) and X-ray diffraction analyses (Fig. 11) on samples withdrawn during the syntheses carried out at 270 °C and 240 °C with an initial precursor concentration [Zr]0 of 180 mmol L−1.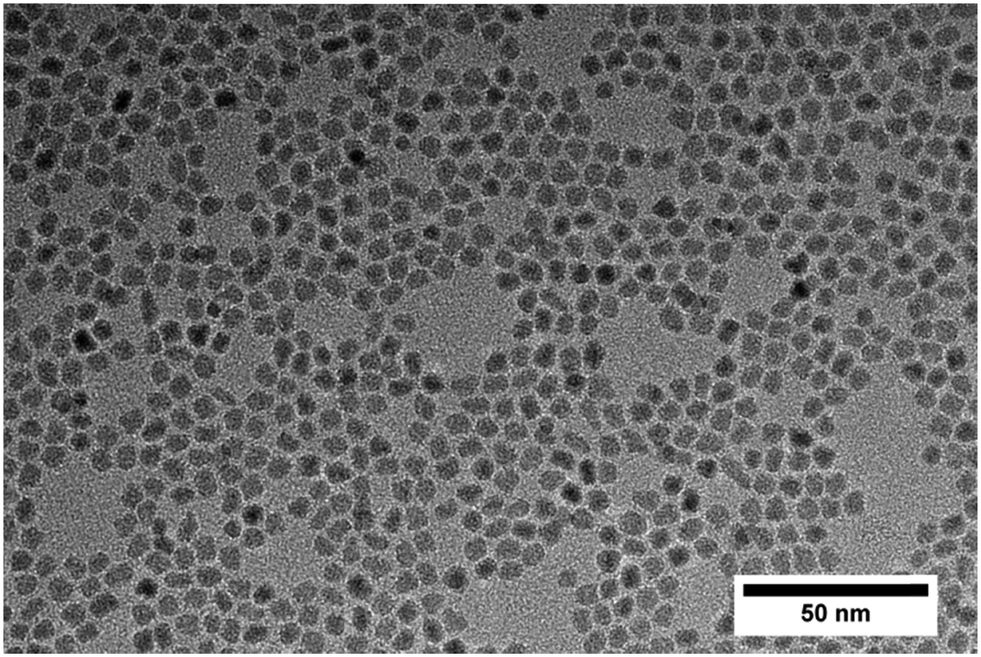 | ||
| Fig. 9 TEM image of a final product of a synthesis conducted at 270 °C ([Zr]0 = 180 mmol L−1). | ||
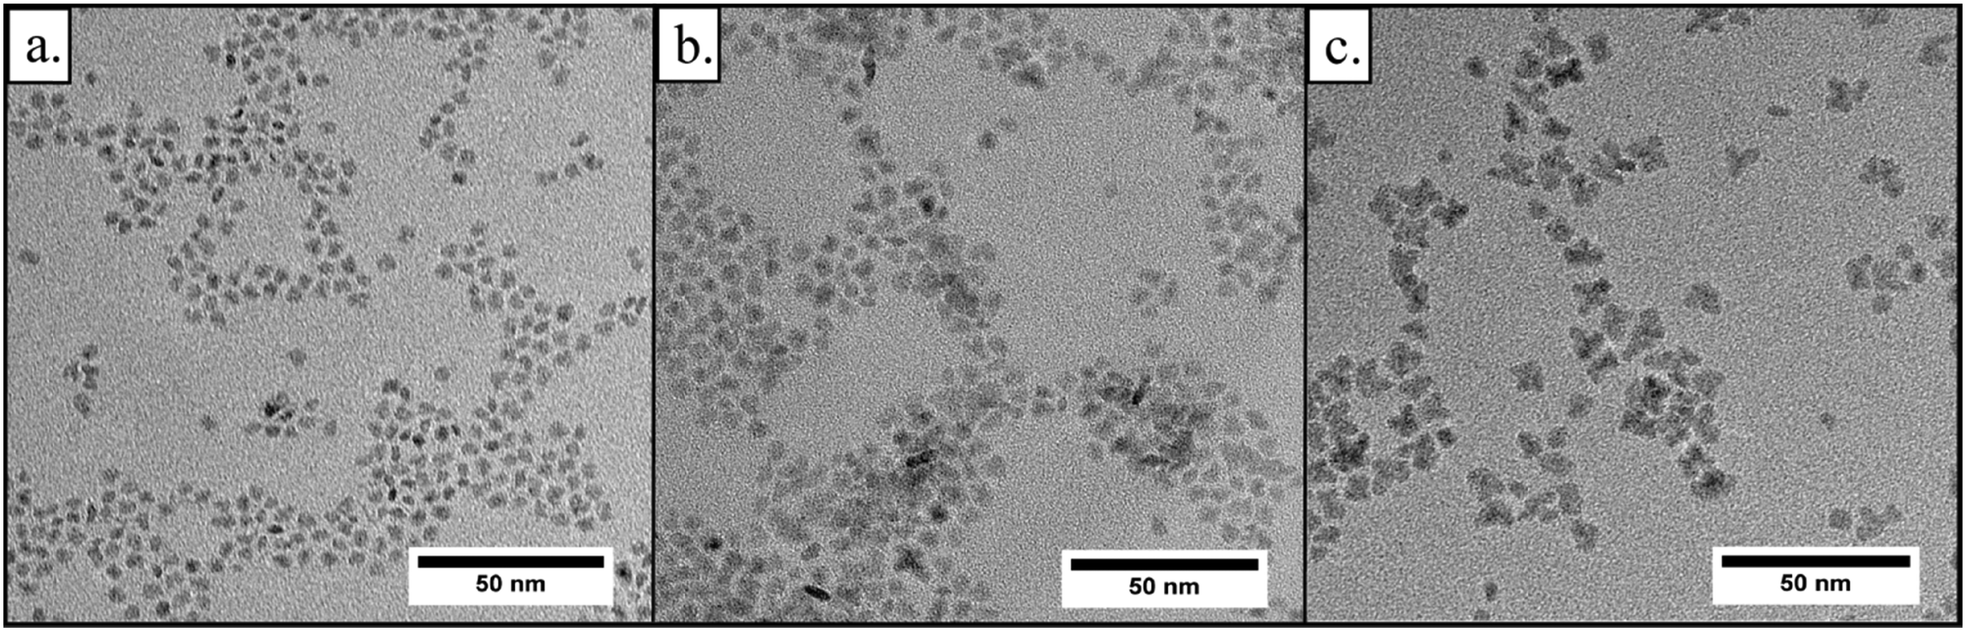 | ||
| Fig. 10 a.–c. Transmission electron micrographs taken after 2 hours, 9.5 hours, and 29 hours from a synthesis carried out at 240 °C ([Zr]0 = 180 mmol L−1). | ||
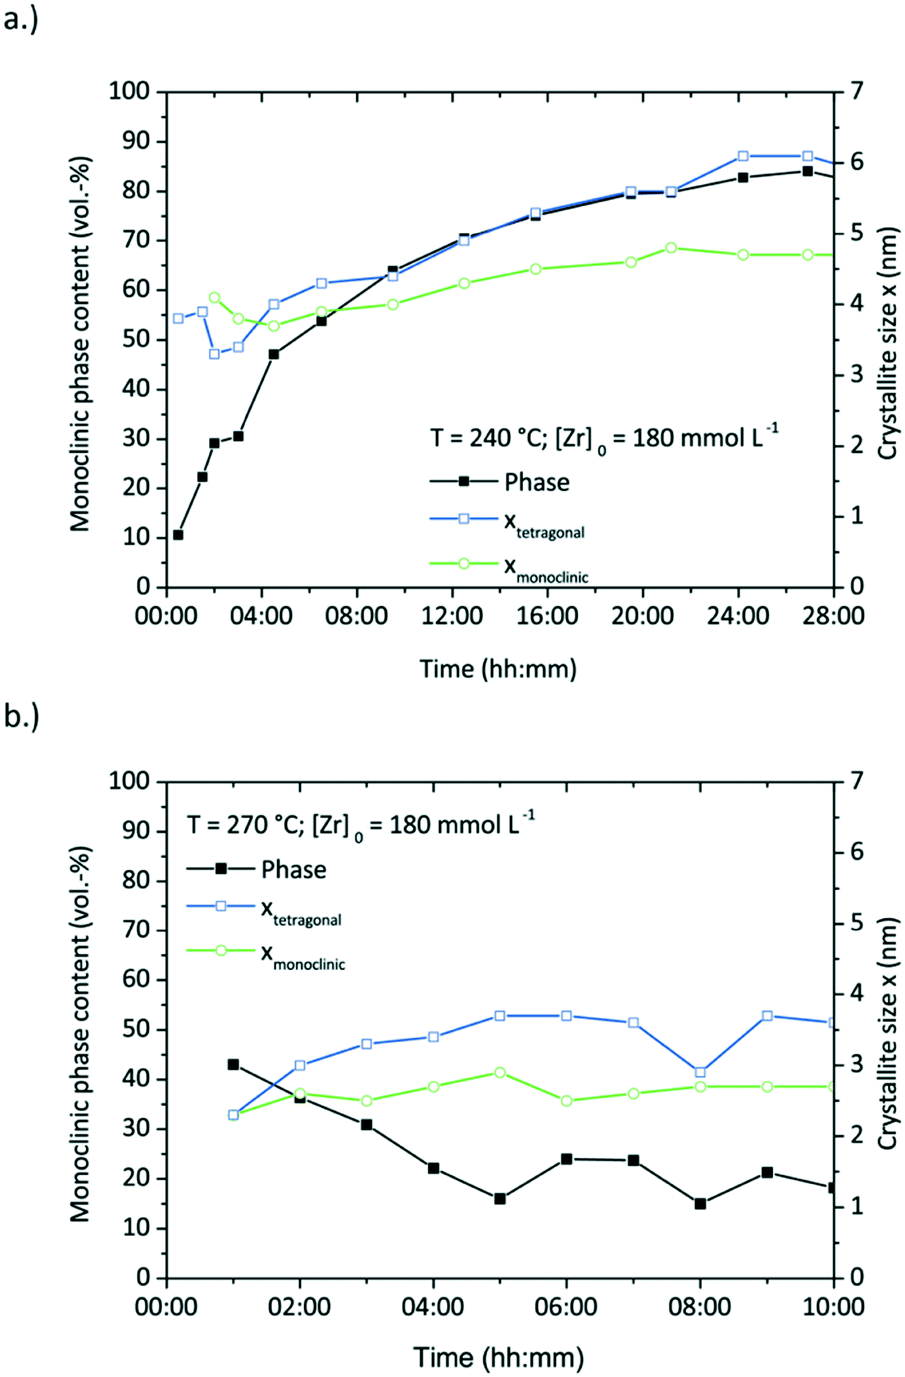 | ||
| Fig. 11 Monoclinic phase content (vol%) showing the tetragonal to monoclinic phase transition and the corresponding crystallite sizes during two syntheses at 240 (a.) and 270 °C (b.) | ||
Fig. 11 shows the development of the phase composition and the corresponding crystallite sizes with a drastic phase transition in the course of the reaction at 240 °C, but hardly any phase transition at 270 °C. The synthesis at 270 °C shows no or just minor particle growth after nucleation with a size around 3.6 nm for tetragonal and 2.7 nm for monoclinic particles. Remarkably, the phase composition remains rather constant with a tetragonal phase content of around 80 vol%. The experiment conducted at 240 °C shows a relatively long reaction time and therefore a low reaction rate, yet exhibits the highest phase transition within 24 hours of reaction from 90 vol% tetragonal to 82 vol% monoclinic. Again, the phase transition follows the trend of the particle growth.
Fig. 10a–c shows TEM pictures of samples taken over the course of the synthesis and during the phase transition (ESI† Fig. S6 shows the corresponding diffractograms). One can observe that particles nucleate with a quasispherical morphology (sample taken after 2 hours). Afterwards, the particles grow bigger and become angularly shaped (9 hours) before they eventually turn into dendrites (29 hours) with a final size of 6.1 nm.
Assuming that the particles of both polymorphs are uniform, we calculated the number concentration of particles from the determined crystallite sizes, volume ratio and yield, over the course of the experiment (Fig. 12) and observed that the number of monoclinic particles increases, whereby the number of tetragonal particles first increases and then slowly decreases due to the phase change. However, the total number of particles is constantly rising which supports the assumption of a dendritic growth phenomenon by an epitaxial growth process into random directions from the particle surface. In contrast, an oriented attachment mechanism, which has been observed to occur during particle formation in other systems in the nonaqueous sol–gel synthesis,41 would lead to a significant decrease of the total number of particles over time.
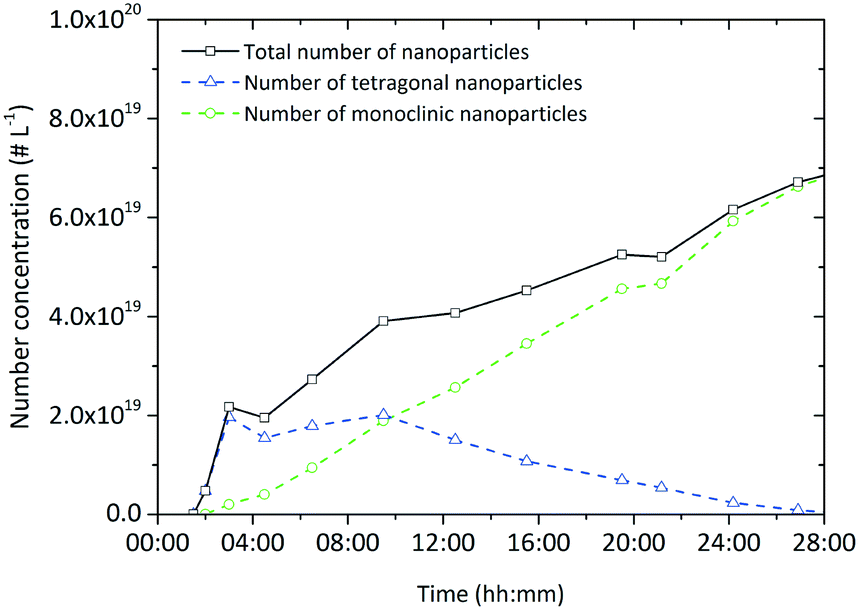 | ||
| Fig. 12 Evolution of the particle number concentration during a standard synthesis conducted at 250 °C ([Zr]0 = 180 mmol L−1). | ||
Belous et al. have shown that zirconium oxide nanoparticles can assemble spontaneously into fractal structures during an aqueous synthesis and form, depending on the pH, surface- or mass fractal aggregates of a few hundred nanometres.42 In comparison, the fractal structures observed in this study are in the size range of 2 to 8 nm and are unlikely to yield from such an ordering process.
Moreover, the TEM analysis shows a growth path from roundish to dendritic particle morphologies with an intermediate angularly shaped particle stage that could not have resulted from the assembly of the previously formed nanoparticles. Furthermore, the growth process leads to the tetragonal-to-monoclinic phase transition, which is accompanied by a change of morphology as our observations indicate. This change of morphology might be driven by the decrease of the number of bound surface ligands during the synthesis (as evidenced in ESI† Fig. S3–S5), which has a destabilizing effect on the solid–liquid interface and changes the surface energy of the particles. This might trigger dendritic growth as unsaturated surface sites can induce epitaxial growth. On the contrary, nanoparticles resulting from syntheses with short reaction times and high reaction rates, as performed at 270 °C (reaction time around 6 hours, Fig. 13) consist mostly of the tetragonal phase and do not grow extensively which explains the resulting roundish shape.
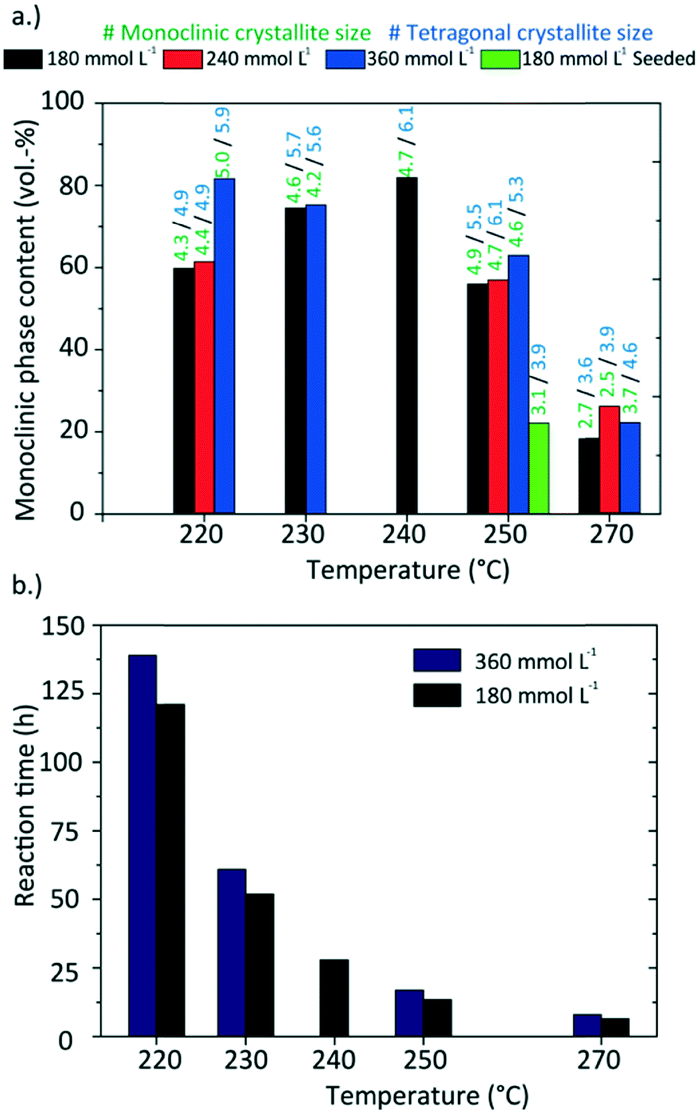 | ||
| Fig. 13 (a.) Phase composition and crystallite sizes for the products obtained at different synthesis conditions; (b.) reactions times of the synthesis carried out different temperatures and precursor concentrations. | ||
The thermodynamically stable form of zirconia at room temperature is the monoclinic phase, whilst the tetragonal polymorph is stable above 878 °C and the cubic polymorph above 2406 °C. Strictly, this however only applies to bulk zirconia, and a size-dependent phase composition has been observed and deeply investigated by Garvie who related this phenomenon to the crystal size effect.43 Various authors report that tetragonal zirconia has a smaller surface free energy value which favors the stability of tetragonal crystallites in a size regime below 10 nm.44–47 However, we recently reported that the crystal phase is not only dependent on size but also on growth conditions and that the formation of monoclinic nanocrystals is also possible for nanocrystals smaller than 10 nm.27 In particular, the phase composition of ZrO2 nanoparticles can be adjusted by the synthesis temperature, with low tetragonal phase contents at low temperatures and high tetragonal phase contents at high temperatures, as well as the material of the reactor lining.27 Here, the experiments were solely performed in a reactor with steel walls. The time-resolved analyses of the zirconia synthesis (Fig. 11a) indicate that the phase content changes with the primary particle size as the monoclinic phase content strongly increases with respect to the tetragonal phase with bigger crystallites. Hence, we assume that the reaction temperature directly influences the particle size which determines the phase content. A study of Garvie showed that a phase sequence from amorphous to tetragonal and monoclinic to solely monoclinic zirconia occurs during an aqueous zirconia synthesis.47 This is in good accordance with our findings – besides the fact that a phase change occurs already for smaller crystallites at a critical diameter of 4 nm. Other studies dedicated to the tetragonal-to-monoclinic transformation report that the critical diameter decreases when higher temperatures are involved47 or mechanical and chemomechanical stress is applied.48 Several authors report an effect of surface bound OH groups on the phase transition when the synthesis was water-assisted.46,49 With regard to the nonaqueous sol–gel method, one can suggest that the organic reactions drive the particle formation, but also influence the surface energy and might have an impact on the phase transition. Another approach to the crystallite size effect was given by Ward et al.50 who suggested that the transition is promoted by defects formed during the synthesis that serve as nucleation sites for the monoclinic phase. These nucleation sites, or so-called embryos, start to grow and transform the crystallites. Despite our TEM analysis in combination with selective area diffraction, we observed no sign of such nucleation sites within the primary particles, but one has to consider the similar lattice structure of the monoclinic and tetragonal phase making it difficult to differentiate.
Chraska et al.51 investigated the tetragonal-to-monoclinic phase transition of plasma-synthesized zirconia nanoparticles and showed by selective area electron diffraction that smaller spherical particles of the tetragonal phase turn into bigger oblong particles of the monoclinic phase. Our results show that zirconia nanoparticles first form in the tetragonal phase and as they grow larger than a critical size of approximately 4 nm, they start to undergo the tetragonal-to-monoclinic phase change. The remaining tetragonal particles seem to grow further, but determining the crystallite size via XRD and Rietveld refinement can cause high uncertainties at very low tetragonal phase contents. These results agree with Ostwald's rule of stages52 which states that an unstable system does not necessarily transform directly into the most stable form, but to the one with the smallest loss of free energy. As the free surface energy of the metastable tetragonal form is closer to amorphous zirconia, it is conclusive that the tetragonal polymorph always appears first.
3.3 Influence on nanoparticle properties
Several experiments were performed in a temperature range from 220 to 270 °C and three [Zr]0 concentrations of 180, 240, and 360 mmol L−1 as well as initial seeding were utilized to determine the impact of these parameters. Fig. 13 shows a summary of the resulting particle properties with respect to the crystallite size and phase composition (a tabulated summary can be found in the ESI,† Table 1). The crystallite size determined from the monoclinic phase is about 0.5 nm smaller and follows the same trend as the crystallite size for the tetragonal phase. As previously discussed, the temperature impact on the primary particles becomes significant at 270 °C. In contrast to the experiments at lower temperatures, the nanoparticles are not only smaller, but also consist mainly of the tetragonal phase. Considering the reaction times (Fig. 13b), the experiments with the shortest reaction times, i.e. at 270 °C or with initially added seeds, yield the smallest particles. The chemical reactions are accelerated by higher temperatures and more available surface sites (seeds), which in consequence leads to higher nucleation rates and smaller particles. Surprisingly, the reaction times of experiments carried out at higher initial precursor concentrations are only marginally longer compared to experiments conducted with lower initial precursor concentrations which shows that chemical reactions are accelerated for higher precursor concentrations. This agrees with the results of the time resolved analyses conducted in this study which show an impact of the chemical reaction kinetics on the particle formation process and thus on crystallite growth and phase composition. Our data shows that one needs to study the kinetics in detail to explain these phenomena, which will be subject to our ongoing work.The specific surface area of the resulting nanoparticles was determined via BET analysis to investigate the influence of the synthesis temperature (Fig. 14). We found that the surface area strongly decreases with higher synthesis temperatures from 116.05 m2 g−1 at 220 °C to 13.41 m2 g−1 at 270 °C. This trend is in good accordance with the change in particle morphology observed during TEM analysis. Furthermore, the values are also in good agreement with other specific surface area values reported for ZrO2 nanoparticles in the literature.53,54 Verma et al. synthesized ZrO2 nanoparticles using a reactive magnetron sputtering technique and were able to adjust the specific surface area from 119.81 to 48.89 m2 g−1 by a subsequent annealing treatment at different temperatures. Here, adjusting the specific surface area of the nanoparticles can be achieved directly through controlling the growth conditions by temperature.
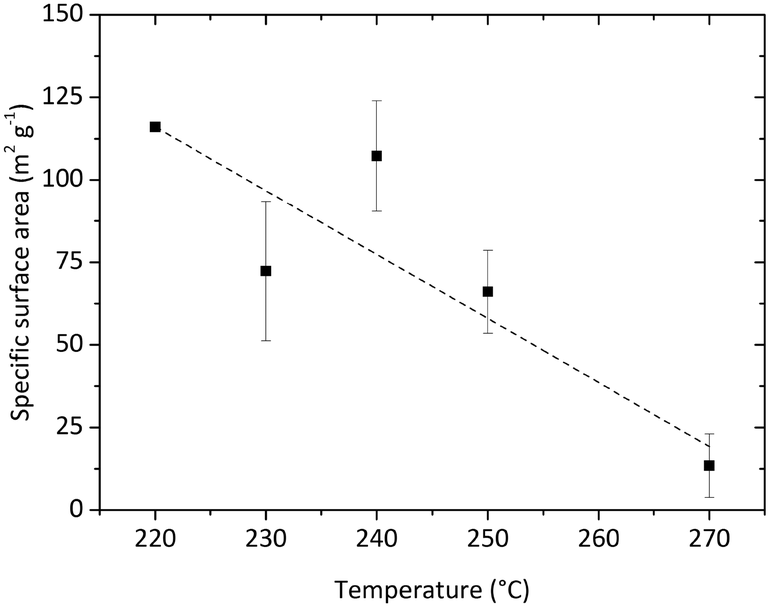 | ||
| Fig. 14 BET analysis of the obtained nanopowders synthesized at different temperatures. | ||
The synthesis results show that one is able to tune final nanoparticle properties through altering temperature, initial precursor concentration and seeding. The resulting particles are smaller with a spherical shape and consist of the tetragonal polymorph when reaction rates were high, i.e. when conducted at elevated temperatures or with previous seeding. In contrary, slower reaction rates through lower temperatures induce fractal growth and lead to bigger and monoclinic particles.
4. Conclusions
Depending on the synthesis conditions, we found that zirconia nanoparticles grow either into spherical or fractal morphologies. Particle growth during the nonaqueous synthesis is highly controlled by the chemical reactions that lead to the particle formation and thus, one has to understand how the underlying mechanisms of the chemical reactions determine size and shape of the nanoparticles. TEM and XRD measurements showed that particles first nucleate in the tetragonal form with roundish shapes and then develop their characteristic properties along the crystallite growth process. We propose that this growth process to fractal morphologies is driven by a surface growth mechanism on the particle surface which is assumed to be influenced by bound ligands.Moreover, size, morphology and phase composition of the nanoparticles can be adjusted by controlling the crystallite growth conditions through the chemical reaction kinetics by varying temperature, initial precursor concentration and the use of seeding. Furthermore, the tetragonal-to-monoclinic phase transition occurs when the crystallites grow above a critical diameter of 4 nm and is suggested to be governed by kinetics rather than by thermodynamics.
All in all, this study presents a thorough understanding of zirconia nanoparticle growth and brings us one step closer towards comprehending the nonaqueous sol–gel method as a rational synthesis that tailors particle properties to be exploited for various applications.
Acknowledgements
This study was financed by the Deutsche Forschungsgemeinschaft (grant GA 1492/3-3). Dr. N. C. Bigall and A. Freytag are grateful for financial support from the German Federal Ministry of Education and Research (BMBF) within the framework of the program NanoMatFutur, support code 03X5525. Furthermore, the authors would like thank Dr. K. Ibrom, Institute of Organic Chemistry, TU Braunschweig, for the NMR spectroscopy and fruitful discussions.Notes and references
- H.-J. Noh, D.-S. Seo, H. Kim and J.-K. Lee, Mater. Lett., 2003, 57, 2425–2431 CrossRef CAS.
- J. Chevalier, L. Gremillard, A. V. Virkar and D. R. Clarke, J. Am. Ceram. Soc., 2009, 92, 1901–1920 CrossRef CAS.
- A. Krell, J. Klimke and T. Hutzler, Opt. Mater., 2009, 31, 1144–1150 CrossRef CAS.
- G. Fadeyev, A. Kalyakin, E. Gorbova, A. Brouzgou, A. Demin, A. Volkov and P. Tsiakaras, Sens. Actuators, B, 2015, 221, 879–883 CrossRef CAS.
- H. Cheng, L. Mao, X. Xu, Y. Zeng, D. Lan, H. Hu, X. Wu, H. You, X. Yang, R. Li and Z. Zhu, Biomater. Sci., 2015, 3, 665–680 RSC.
- K. C. Soni, S. Chandra Shekar, B. Singh and T. Gopi, J. Colloid Interface Sci., 2015, 446, 226–236 CrossRef CAS PubMed.
- L. Nakka, J. E. Molinari and I. E. Wachs, J. Am. Chem. Soc., 2009, 131, 15544–15554 CrossRef CAS PubMed.
- J. P. Breen and J. R. H. Ross, Catal. Today, 1999, 51, 521–533 CrossRef CAS.
- M. E. Sad, H. A. Duarte, C. Vignatti, C. L. Padró and C. R. Apesteguía, Int. J. Hydrogen Energy, 2015, 40, 6097–6106 CrossRef CAS.
- M. Bayani, M. Ehsani, H. A. Khonakdar, J. Seyfi and M. H. HosseinAbadi-Ghaeni, J. Vinyl Addit. Technol., 2016 DOI:10.1002/vnl.21558.
- A. Kockmann, J. Hesselbach, S. Zellmer, A. Kwade and G. Garnweitner, RSC Adv., 2015, 5, 60993–60999 RSC.
- G. A. Somorjai and J. Y. Park, Top. Catal., 2008, 49, 126–135 CrossRef CAS.
- M. G. Taylor, N. Austin, C. E. Gounaris and G. Mpourmpakis, ACS Catal., 2015, 5, 6296–6301 CrossRef CAS.
- H. Ghafuri, A. Rashidizadeh and H. R. Esmaili Zand, RSC Adv., 2016, 6, 16046–16054 RSC.
- M. Jafarpour, E. Rezapour, M. Ghahramaninezhad and A. Rezaeifard, New J. Chem., 2014, 38, 676–682 RSC.
- K. Saravanan, B. Tyagi and H. C. Bajaj, J. Sol-Gel Sci. Technol., 2012, 61, 275–280 CrossRef CAS.
- K. Saravanan, B. Tyagi and H. C. Bajaj, Appl. Catal., B, 2016, 192, 161–170 CrossRef CAS.
- N. Zhao, D. Pan, W. Nie and X. Ji, J. Am. Chem. Soc., 2006, 128, 10118–10124 CrossRef CAS PubMed.
- M. Niederberger and G. Garnweitner, Chem. – Eur. J., 2006, 12, 7282–7302 CrossRef CAS PubMed.
- S. Zellmer, A. Kockmann, I. Dosch, B. Temel and G. Garnweitner, CrystEngComm, 2015, 17, 6878–6883 RSC.
- I. C. Masthoff, M. Kraken, D. Mauch, D. Menzel, J. A. Munevar, E. Baggio Saitovitch, F. J. Litterst and G. Garnweitner, J. Mater. Sci., 2014, 49, 4705–4714 CrossRef CAS.
- I.-M. Grabs, C. Bradtmöller, D. Menzel and G. Garnweitner, Cryst. Growth Des., 2012, 12, 1469–1475 CAS.
- C. Grote, T. A. Cheema and G. Garnweitner, Langmuir, 2012, 28, 14395–14404 CrossRef CAS PubMed.
- M. Zimmermann and G. Garnweitner, CrystEngComm, 2012, 14, 8562–8568 RSC.
- H. Toraya, M. Yoshimura and S. Somiya, J. Am. Ceram. Soc., 1984, 67, C-119–C-121 CAS.
- B. Bondars, G. Heidemane, J. Grabis, K. Laschke, H. Boysen, J. Schneider and F. Frey, J. Mater. Sci., 1995, 30, 1621–1625 CrossRef CAS.
- T. A. Cheema and G. Garnweitner, CrystEngComm, 2014, 16, 3366–3375 RSC.
- M. Zimmermann, B. Temel and G. Garnweitner, Chem. Eng. Process.: Process Intesif., 2013, 74, 83–89 CrossRef CAS.
- D. C. Bradley, D. C. Hancock and W. Wardlaw, J. Chem. Soc., 1952, 2773–2778, 10.1039/jr9520002773.
- M. Andrianainarivelo, R. Corriu, D. Leclercq, P. H. Mutin and A. Vioux, J. Mater. Chem., 1996, 6, 1665–1671 RSC.
- G. Garnweitner and M. Niederberger, J. Mater. Chem., 2008, 18, 1171–1182 RSC.
- M. Zimmermann, Dissertation, TU Braunschweig, 2014 Search PubMed.
- M. Niederberger, Acc. Chem. Res., 2007, 40, 793–800 CrossRef CAS PubMed.
- M. Mizuno, Y. Sasaki, S. Lee and H. Katakura, Langmuir, 2006, 22, 7137–7140 CrossRef CAS PubMed.
- T. Sugimoto, X. Zhou and A. Muramatsu, J. Colloid Interface Sci., 2003, 259, 43–52 CrossRef CAS PubMed.
- B. Ludi, M. J. Suess, I. A. Werner and M. Niederberger, Nanoscale, 2012, 4, 1982–1995 RSC.
- M. Z. C. Hu, M. T. Harris and C. H. Byers, J. Colloid Interface Sci., 1998, 198, 87–99 CrossRef CAS.
- R. C. Garvie and M. V. Swain, J. Mater. Sci., 1985, 20, 1193–1200 CrossRef CAS.
- G. Oskam, Z. Hu, R. L. Penn, N. Pesika and P. C. Searson, Phys. Rev. E: Stat., Nonlinear, Soft Matter Phys., 2002, 66, 011403 CrossRef PubMed.
- I. M. Lifshitz and V. V. Slyozov, J. Phys. Chem. Solids, 1961, 19, 35–50 CrossRef.
- I. C. Masthoff, A. Gutsche, H. Nirschl and G. Garnweitner, CrystEngComm, 2015, 17, 2464–2470 RSC.
- A. G. Belous, K. V. Kravchyk, O. V. Pashkova, Y. P. Gomza and S. D. Nesin, J. Eur. Ceram. Soc., 2010, 30, 141–145 CrossRef CAS.
- R. C. Garvie, J. Phys. Chem., 1965, 69, 1238–1243 CrossRef CAS.
- H. Kim, M. Kim, C. Bae, E. Kim, S. Lee, J. M. Montero-Moreno, H. S. Jung and H. Shin, RSC Adv., 2015, 5, 80472–80479 RSC.
- S. Shukla and S. Seal, Int. Mater. Rev., 2005, 50, 45–64 CrossRef CAS.
- S. Xie, E. Iglesia and A. T. Bell, Chem. Mater., 2000, 12, 2442–2447 CrossRef CAS.
- R. C. Garvie and M. F. Goss, J. Mater. Sci., 1986, 21, 1253–1257 CrossRef CAS.
- M. Mamivand, M. Asle Zaeem, H. El Kadiri and L.-Q. Chen, Acta Mater., 2013, 61, 5223–5235 CrossRef CAS.
- E. Djurado, L. Dessemond and C. Roux, Solid State Ionics, 2000, 136–137, 1249–1254 CrossRef CAS.
- D. A. Ward and E. I. Ko, Chem. Mater., 1993, 5, 956–969 CrossRef CAS.
- T. Chraska, A. H. King and C. C. Berndt, Mater. Sci. Eng., A, 2000, 286, 169–178 CrossRef.
- J. W. Mullin, Crystallization, Elsevier Science, 2001 Search PubMed.
- Q. Wang, C. Li, M. Guo, C. Hu and Y. Xie, J. Mater. Chem. A, 2014, 2, 1346–1352 CAS.
- D. S. S. Padovini, D. S. L. Pontes, C. J. Dalmaschio, F. M. Pontes and E. Longo, RSC Adv., 2014, 4, 38484–38490 RSC.
Footnote |
| † Electronic supplementary information (ESI) available: Evolution of different lattice planes during growth of tetragonal and monoclinic nanoparticles; Ostwald ripening after a standard synthesis; Discussion about surface bound organics supported by thermogravimetric analysis; Further time resolved XRD analysis. See DOI: 10.1039/c6ce01916a |
| This journal is © The Royal Society of Chemistry 2016 |