 Open Access Article
Creative Commons Attribution 3.0 Unported Licence
Structural distortions in the high-pressure polar phases of ammonium metal formates†
Ines E.
Collings
*a,
Maxim
Bykov
b,
Elena
Bykova
b,
Matthew G.
Tucker
c,
Sylvain
Petitgirard
b,
Michael
Hanfland
d,
Konstantin
Glazyrin
 e,
Sander
van Smaalen
a,
Andrew L.
Goodwin
f,
Leonid
Dubrovinsky
b and
Natalia
Dubrovinskaia
a
aLaboratory of Crystallography, University of Bayreuth, D-95440 Bayreuth, Germany. E-mail: ines.collings@uni-bayreuth.de
bBayerisches Geoinstitut, University of Bayreuth, D-95440 Bayreuth, Germany
cOak Ridge National Laboratory, Tennessee, USA
dEuropean Synchrotron Radiation Facility, BP 220, 38043 Grenoble, Cedex 9, France
eDeutsches Elektronen-Synchrotron DESY, Notkestrasse 85, D-22603 Hamburg, Germany
fInorganic Chemistry Laboratory, Department of Chemistry, University of Oxford, South Parks Road, Oxford OX1 3QR, UK
First published on 19th October 2016
Abstract
The high-pressure behaviour of ammonium metal formates has been investigated using high-pressure single-crystal X-ray diffraction on ammonium iron and nickel formates, and neutron powder diffraction on ammonium zinc formate in the pressure range of 0–2.3 GPa. A structural phase transition in the pressure range of 0.4–1.4 GPa, depending on the metal cation, is observed for all three ammonium metal formates. The hexagonal-to-monoclinic high-pressure transition gives rise to characteristic sixfold twinning based on the single-crystal diffraction data. Structure solution of the single-crystal data and refinement of the neutron powder diffraction characterise the pressure-induced distortions of the metal formate frameworks. The pressure dependence of the principal axes shows significantly larger anisotropic compressibilities in the high-pressure monoclinic phase (K1 = 48 TPa−1, K3 = −7 TPa−1) compared to the ambient hexagonal phase (K1 = 16 TPa−1, K3 = −2 TPa−1), and can be related to the symmetry-breaking distortions that cause deformation of the honeycomb motifs in the metal formate framework. While high-pressure Raman spectroscopy suggests that the ammonium cations remain dynamically disordered upon the phase transition, the pressure-induced distortions in the metal formate framework cause polar displacements in the ammonium cations. The magnitude of polarisation in the high-pressure phase of ammonium zinc formate was calculated based upon the offset of the ammonium cation relative to the anionic zinc formate framework, showing an enhanced polarisation of Ps ∼ 4 μC cm−2 at the transition, which then decreases with increasing pressure.
1 Introduction
Ammonium metal formates, as well as related cation-templated metal formates, exhibit a range of interesting physical properties upon cooling, such as ferroelectric behaviour,1–3 magnetic ordering,2–11 and with certain compositions, multiferroic properties.9–13 In the family of ammonium metal formates, [NH4][MII(HCOO)3] (M = Mn, Fe, Co, Zn, Mg), a paraelectric-to-ferroelectric phase transition occurs between 191 K and 255 K upon cooling, which originates from a change in dynamics of the ammonium cation.1,2,14–16 This order–disorder transition of NH4+ causes a structural phase transition in [NH4][M(HCOO)3] compounds, due to the changes in hydrogen bonding between N–H and oxygen of the formate linker.1,2 In contrast, ammonium nickel formate does not exhibit polarity at low temperatures; instead, the ammonium cations become statically disordered over two sites and the structure remains in its non-polar space-group symmetry.6 The comparable variable-temperature vibrational spectroscopy measurements of [NH4][Ni(HCOO)3] with those of other [NH4][M(HCOO)3] compounds15 suggest that [NH4][Ni(HCOO)3] exhibits a dynamic-to-static disorder transition of the NH4+ groups. Across the [A][MII(HCOO)3] compounds, where A is a monovalent cation and M = Mn, Fe, Co, Ni or Cu, magnetic ordering can be observed upon cooling to below ∼40 K. Their magnetic properties arise from superexchange interactions within the M–formate–M linkages, yielding antiferromagnetically ordered spins with small canting (when M = Mn, Fe, Co, Ni), as found in e.g. [NH4][M(HCOO)3] and [(CH3)2NH2][M(HCOO)3].2,4,6,17–22 The hydrogen-bonding interaction between the N–H of the A-site cation and the oxygen of the formate linker has been shown to modify the magnetic superexchange pathway in [(CH3)2NH2][Fe(HCOO)3] and may be important for exhibiting magnetoelectric coupling.9,23Tuning of these physical properties in [A][M(HCOO)3] compounds has been achieved by variation of the chemical compositions of the A- and M-site cations, as well as doping upon these sites, and finally through application of mechanical strain. In particular, the variation of the divalent metal cation has allowed the ferroelectric transition temperature (TC) to be modified in [(CH3)2NH2][M(HCOO)3] (ref. 8 and 24) and [NH4][M(HCOO)3].2,16,25 The trend in TC is thought to arise from the variation in the hydrogen bonding strength that is linked to the degree of covalency in the M–O bonding,15,24,26 as well as the mass and size of the M2+ cation.16 However, the observed spontaneous polarisation (Ps) values for [NH4][MII(HCOO)3] (M = Mn, Fe, Co, Zn) measured between 0.97–2.2 μC cm−2 could not be correlated with the M2+ cation used (estimates of Ps based upon the crystal structure resulted in a much narrower range of values: 0.94–1.03 μC cm−2).2 Computational studies have shown that changes in the electronegativity of the A-site cation can offer a route for tuning the magnitude of electric polarisation.27 Doping upon the A-site or M-site cations can give rise to a reduction in the TC values for the solid solutions [(NH3NH2)1−x(NH3OH)x][Zn(HCOO)3],28 [(NH2NH3)x(CH3NH3)1−x][Mn(HCOO)3],29 and [(CH3)2NH2][MII(HCOO)3] doped with trivalent metal cations,30 which could arise due to the changes in the degree of distortion present in the metal formate framework. Finally, application of mechanical strain has been shown, by density functional theory calculations, to allow ferroelectric polarisation values to be increased substantially.31
In order to find other ways in which the transition temperature and polarisation magnitudes can be varied in these [A][M(HCOO)3] compounds, we investigate the high-pressure structural behaviour of [NH4][M(HCOO)3]. Previous high-pressure studies on [NH4][Zn(HCOO)3] have shown the anisotropic nature of its compressibility in the ambient hexagonal phase and the occurrence of a phase transition at ∼1.1 GPa to a P21 monoclinic phase.32,33 Vibrational studies suggest that the high-pressure phase consists of a distorted [Zn(HCOO)3]− framework with disordered ammonium cations, although the crystal structure is not known.33 Compressional studies on a different polar [NH4][Cd(HCOO)3] compound (Pna21 symmetry) revealed that application of pressure led to an increase in the second-harmonic generation intensity that can be related to an increase in the polarity of the structure.34 In order to further investigate the high-pressure behaviour of such [A][M(HCOO)3] compounds and determine the mechanism and evolution of possible pressure-induced polarisation, we measured both high-pressure neutron powder diffraction on [ND4][Zn(DCOO)3] and high-pressure single-crystal X-ray diffraction on [NH4][Ni(HCOO)3] and [NH4][Fe(HCOO)3] in the pressure range 0–2.3 GPa.
2 Experimental details
In this study on the high-pressure behaviour of ammonium metal formates, two types of experiments were conducted. The first involved high-pressure neutron powder diffraction measurements of [ND4][Zn(DCOO)3] using a V4 Paris-Edinburgh press, and the second employed high-pressure single-crystal X-ray diffraction of [NH4][Ni(HCOO)3] and [NH4][Fe(HCOO)3] within diamond-anvil cells (DACs).2.1 Synthesis of ammonium zinc formate
A deuterated polycrystalline sample of ammonium zinc formate was synthesised by mixing ZnCl2 (3.548 g, 26.03 mmol; Aldrich, 99.999%) and DCOOND4 (7.085 g, 104.112 mmol; QMx, 98% D) with DCOOD (2.5 g, 52.06 mmol; QMx, 95% w/w in D2O) in 520 mL of CH3OD (Sigma-Aldrich, 98% D). The synthesis was performed under an inert atmosphere, and was kept undisturbed for a week to allow polycrystals to form. The microcrystalline powder formed was filtered and washed with deuterated methanol. Initially, the product had a considerable amount of zinc formate dihydrate impurity; a pure sample of ammonium zinc formate was obtained by mixing the as-synthesised powder with 1 g of DCOOND4 in methanol. It is thought that the deuterated methanol was not completely anhydrous and contaminated the deuterated sample with water and hydrogen. [ND4][Zn(DCOO)3] was dried in vacuo at 60 °C for 24 h prior to the neutron diffraction experiment. Rietveld refinement of high-resolution neutron powder diffraction on GEM at ISIS indicated that the deuterium on the ammonium cations had exchanged with hydrogen, giving the formula [ND1.5H2.5][Zn(DCOO)3] [Fig. S4†]. Due to the different scattering lengths of H (−3.739 fm) and D (6.671 fm), the overall scattering of these sites becomes near zero. Thus, for the Rietveld refinements of the high-pressure neutron diffraction, the H and D positions on the ammonium cation were removed from the structural model.2.2 Synthesis of ammonium iron and nickel formate
For the synthesis of [NH4][Fe(HCOO)3] and [NH4][Ni(HCOO)3] single crystals, slow diffusion of the metal salt and ammonium formate was performed within a Schlenk tube. Dried methanolic solutions of formic acid (3.2 mmol) and ammonium formate (6.4 mmol) were placed at the bottom of the Schlenk tube. To this solution, a dried methanolic solution of iron or nickel chloride (0.1 mmol) was carefully pipetted. The mixture was left undisturbed for approximately one week under an inert argon atmosphere for the formation of single crystals. After crystallisation, the sample was filtered, washed with dried methanol, dried in air and stored in a Schlenk tube under an argon atmosphere. The [NH4][Fe(HCOO)3] compound would oxidise if left in air, and by keeping both compounds under argon, the reaction pathway to metal formate dihydrates over time is prevented.2.3 Variable-pressure neutron powder diffraction
The neutron diffraction measurements were carried out using the PEARL instrument at the ISIS neutron spallation source.35 A powdered sample of [N(D/H)4][Zn(DCOO)3], prepared as described above, was loaded into a TiZr gasket together with a Pb pellet and Fluorinert (1![[thin space (1/6-em)]](https://www.rsc.org/images/entities/char_2009.gif) :
:![[thin space (1/6-em)]](https://www.rsc.org/images/entities/char_2009.gif) 1 mixture of FC84/FC87)36 as the pressure-transmitting medium. The gasket was positioned within a zirconia-toughened alumina anvil. The sample was compressed in 0.2–0.3 GPa steps up to the maximum pressure of 2.3 GPa, and then decompressed in ∼0.3 GPa steps back to ambient conditions. Pressures were calculated using the third-order Birch–Murnaghan equation of state for Pb (V0 = 121.27 Å3, B0 = 42.05 GPa, B′ = 5.71).37,38 Neutron scattering data were collected over the d-spacing range 0.9 < d < 4.1 Å. Rietveld refinements were performed using the Topas Academic v4.1 refinement package [Fig. S5–S7†],39 and distance and angle restraints on the formate ligand and distance restraints within the ZnO6 coordination polyhedra were applied. From these fits, the unit cell parameters and atomic positions were determined.
1 mixture of FC84/FC87)36 as the pressure-transmitting medium. The gasket was positioned within a zirconia-toughened alumina anvil. The sample was compressed in 0.2–0.3 GPa steps up to the maximum pressure of 2.3 GPa, and then decompressed in ∼0.3 GPa steps back to ambient conditions. Pressures were calculated using the third-order Birch–Murnaghan equation of state for Pb (V0 = 121.27 Å3, B0 = 42.05 GPa, B′ = 5.71).37,38 Neutron scattering data were collected over the d-spacing range 0.9 < d < 4.1 Å. Rietveld refinements were performed using the Topas Academic v4.1 refinement package [Fig. S5–S7†],39 and distance and angle restraints on the formate ligand and distance restraints within the ZnO6 coordination polyhedra were applied. From these fits, the unit cell parameters and atomic positions were determined.
2.4 Variable-pressure single-crystal X-ray diffraction
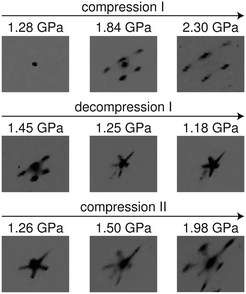
High-pressure single-crystal X-ray diffraction on [NH4][Ni(HCOO)3] was measured at the ID09A beamline of the European Synchrotron Radiation Facility, Grenoble up to 2.30 GPa using monochromatic X-ray radiation (λ = 0.41168 Å). Upon the first compression, single-crystal diffraction was measured at 0.93, 1.28, 1.84, and 2.30 GPa, after which diffraction was measured at 1.45, 1.25, and 1.18 GPa upon decompression. A second compression was performed at pressures of 1.26, 1.50, and 1.98 GPa. Diffraction patterns were collected with a Mar555 flat panel detector using steps of 0.5° oscillations over a total ω scan range of 80° around the vertical axis. The pressures were measured using the ruby fluorescence method before and after each diffraction measurement.40,41 The average of both pressure values was used and the variance was employed to calculate errors associated with the pressure measurement. High-pressure single-crystal X-ray diffraction on [NH4][Fe(HCOO)3] was measured at the beamline P02.2 of PETRAIII, DESY, Hamburg at 0.86 GPa using monochromatic X-ray radiation (λ = 0.2903 Å).42 Argon was used for both [NH4][Ni(HCOO)3] and [NH4][Fe(HCOO)3] as the pressure-transmitting medium (PTM) as it provides an inert atmosphere and does not penetrate into the cavities of the [NH4][M(HCOO)3] structures, unlike neon.43 Lattice parameter determination and integration of the reflection intensities were performed using the CrysAlisPro software.44The 2.30 GPa and 0.86 GPa pressure points of the high-pressure phases of [NH4][Ni(HCOO)3] and [NH4][Fe(HCOO)3], respectively, were solved using Superflip in JANA2006 and subsequent difference Fourier calculations.45 For these refinements, six data sets were used from each of the twin domains that were integrated using CrysAlisPro, and twinning matrices were given to relate all six domains (see the ESI†). The hydrogen atoms of the formate ligands were located by geometric calculations and refined using a riding model with isotropic displacement parameters constrained to be 1.2 times those of their adjacent carbon atoms. Isotropic thermal parameters were used for the C, O, and N atoms, while anisotropic thermal parameters were employed for the Ni or Fe atoms. The hydrogen atoms of the ammonium cation could not be located in the difference Fourier maps and so were not included in the refinements. The structure refinement details are given in Tables S3–S11.†
3 Results and discussion
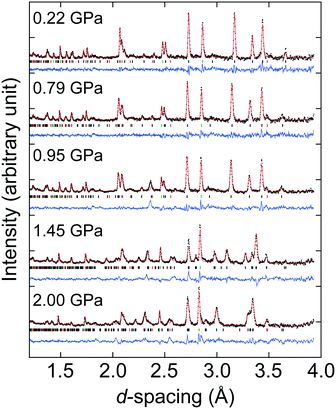
Ammonium metal formates, abbreviated here to AMF, are composed of octahedral M2+ cations that coordinate to formate linkers forming a three-dimensional anionic network. The [M(HCOO)3]− network is charge-balanced by ammonium cations that are located within the c-axis channels and interact with the host framework via weak hydrogen bonding.1,2 Ambient AMF compounds crystallise in the acs topology with the hexagonal space group P6322, while their low-temperature ferroelectric phases (when M = Mn, Fe, Co, Zn, Mg) adopt a threefold superstructure with the polar space group P63.‡1,2The variable-pressure diffraction measurements on AMF compounds show the occurrence of a phase transition at p ≤ 0.86(3) GPa for AFeF, 1.22(2) < p ≤ 1.44(2) GPa for AZnF, and 1.28(9) < p ≤ 1.45(3) GPa for ANiF that involves characteristic sixfold twinning based on the single-crystal data and the splitting of the powder diffraction peaks for AZnF that is consistent with a change of symmetry from hexagonal to either C-centred orthorhombic or monoclinic [Fig. 1 and 2]. The high-pressure phases, termed AMF-II, could be indexed to either an orthorhombic C2221 cell (a = 6.356(3) Å, b = 13.02(5) Å, c = 8.0668(16) Å for ANiF at 2.30 GPa) or a monoclinic P21 cell as shown in Table 1, consistent with ref. 32. Both the P21 and C2221 cells are subgroups of the ambient phase symmetry P6322, although due to the broad diffraction spots from the single crystals, it is not possible to distinguish whether the monoclinic or orthorhombic cells fit best. However, the reproducible sixfold twinning upon recompression of ANiF [Fig. 1] and from several tested crystals suggests that the monoclinic cell is formed upon the transition, as sixfold twinning from an orthorhombic cell could only occur from the crystal breaking into two domains. The relationship between the unit cell parameters of the ambient P6322 and high-pressure P21 phases is given by:
 | (1) |
| AMF-II | |||
|---|---|---|---|
| Fe | Zn | Ni | |
| P (GPa) | 0.86(3) | 1.45(2) | 2.30(3) |
| a (Å) | 6.668(6) | 6.6594(10) | 6.306(13) |
| b (Å) | 8.298(4) | 8.1702(12) | 8.0599(14) |
| c (Å) | 7.393(6) | 7.3118(11) | 7.250(13) |
| β (°) | 116.64(11) | 116.85(2) | 115.6(2) |
| V (Å3) | 365.6(5) | 354.94(11) | 332.3(8) |
We note that the symmetry-breaking lattice distortions and the formation of twin domains in the pressure-induced transition of AMF suggest that their high-pressure phases may be ferroelastic.46
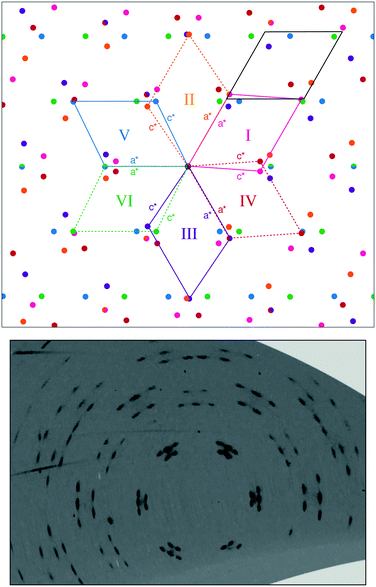
The formation of six twin domains can be observed from the splitting of the ambient phase peaks into five distinguishable peaks (six peaks are formed but due to the peak overlap, only five are clearly observed) [Fig. 1 and 3; see Fig. S2† for the diffraction pattern of AFeF-II]. The relationships between the twin domains follow the lost rotational symmetry upon the hexagonal-to-monoclinic transition.47 In particular, the first three of the six twin domains are related by successive 120° rotations in the ac-plane (corresponding to the ab-plane in the hexagonal setting), and each of these three domains then forms another twin domain by 180° rotation about the monoclinic a-axes (or c-axes) [Fig. 3].48 The matrices relating the six monoclinic twin domains are given in the ESI.†
High-pressure Raman spectroscopy measurements have also shown evidence of the phase transition in AFeF, AZnF (ref. 33), and ANiF through the splitting of vibrational modes associated with the formate groups.43 Based upon the onset of the Raman peak splitting upon compression, the transition pressures are observed at 0.38(3) < p ≤ 0.44(6) GPa for AFeF, 0.99(3) < p ≤ 1.19(3) GPa for AZnF,33 and 1.29(3) < p ≤ 1.37(3) GPa for ANiF [Fig. S11†]. While the AFeF and ANiF transitions determined from Raman spectroscopy and diffraction are in agreement, the p range determined for the transition point of AZnF is slightly higher in the high-pressure diffraction experiment compared to that in the Raman spectroscopy (the lower p bound is ∼0.23(3) GPa higher). We attribute this small difference to the use of a powder sample in the case of the diffraction experiment, while a single crystal was employed for the Raman measurement in ref. 33. Thus, based upon the high-pressure Raman spectroscopy performed on single crystals of AFeF, AZnF, and ANiF, the transition pressures (Fe < Zn < Ni) follow the inverse trend to the cation size, i.e. the larger metal cation exhibits the lowest transition pressure. The relationship of cation size and the degree of framework flexibility in similar [A][M(HCOO)3] compounds has also been shown to be directly correlated.49 We note that the deuteration of the AZnF compound is not likely to affect the transition pressure significantly given that a vibrational study on both [NH4][Zn(HCOO)3] and [ND4][Zn(DCOO)3] showed very similar values of calculated IR and Raman wavenumbers for the vibrational modes associated with the Zn–formate–Zn linkages, such as the stretching modes of the Zn–O bonds and the translational and librational modes of the formate ions.33
In the case of the variable-pressure diffraction behaviour of ANiF, the coexistence of the high-pressure monoclinic phase and the ambient hexagonal phase can be observed at the pressure points 1.45–1.98 GPa; at the highest pressure point measured (2.30 GPa), however, the diffraction pattern arises mainly from ANiF-II [Fig. 1]. This coexistence of ambient and high-pressure phases was not observed for AFeF-II, where the sample was maintained at 0.86 GPa for a week before the diffraction measurement (see the ESI†), nor in the high-pressure neutron powder diffraction measurements (∼1–2 h per pressure point). Thus, it suggests that a certain equilibration time is needed for the transition to be fully completed. Upon decompression of ANiF-II, the ambient phase diffraction spots return, indicating the reversibility of the transition, although diffuse scattering streaks remain along the previous positions of the ANiF-II diffraction [Fig. 1].
Considering next the neutron powder diffraction, the ambient P6322 model could be fitted to the diffraction pattern, although due to unsuccessful deuteration of the ammonium cation, the H or D positions of the ammonium cation were not included in our Rietveld refinements (see synthesis section and Fig. S4†). The P6322 model could be refined up to 1.22 GPa, however in the pressure range 0.95–1.22 GPa, a broadening of the peak at the d-spacing of ∼2.4 Å is observed [Fig. 2]. This broadened peak could only be partially fitted using the P6322 model, and could indicate the onset of the structural transition. At 1.44 GPa, there is a clear change in the diffraction pattern which can be refined using the P21 model. ISODISTORT was used to produce a starting model with the atomic positions of the previous pressure point transformed into P21 symmetry.50 The P21 structure could be used to refine the data up to 2.3 GPa, after which the sample was decompressed and the reversibility of the transition was confirmed (Fig. S7†).
The pressure-dependent evolution of the unit cell volumes for the ambient and high-pressure phases of ANiF and AZnF is shown in Fig. 4. PASCal was used to calculate the corresponding Birch–Murnaghan equations of state.51 The pressure-dependent volume evolution of the first compression and decompression runs of the ambient ANiF phase could be fitted with a second-order Birch–Murnaghan equation of state (B–M EOS) up to 1.5 GPa, giving a bulk modulus of B0 = 26.0(12) GPa. A third-order B–M EOS fit to the AZnF phase gave a bulk modulus of 39.2(15) GPa and its pressure derivative B′ = −5.1(16); a second-order B–M EOS fit resulted in B0 = 31.9(5) GPa as reported in ref. 32 [Fig. S8†]. The limited number of pressure points in the low-pressure region of ANiF prevents a discussion on differences between the bulk moduli of ANiF and AZnF. In general, the B0 values observed in AMF are similar to those obtained for guanidinium copper carbonate (B0 = 36.1(6) GPa),52 and the cubic zinc cyanide (B0 = 36.9(22) GPa),53 all of which are considered as non-porous framework structures (or with closed porosity in the case of AMF)43 with comparable bulk moduli to certain zeolites.54,55 The negative B′ for AZnF indicates that the material becomes softer upon further compression, which may be due to the approach of the phase transition.56 For the monoclinic AZnF-II phase, a third-order B–M EOS fit taking into account the existence of a nonzero critical pressure pc resulted in a much lower bulk modulus of B0 = 14.0(7) GPa, with its pressure derivative B′ = 19(3), indicating that the high-pressure phase is initially very soft but becomes harder with increasing pressure (B′ ≫ 4).57 For the pressure points at 1.45 and 1.8 GPa for ANiF, the reduction in volume upon the phase transition from the ambient to the high-pressure phases is ∼1.5%, suggesting that the phase transition is first order in nature. The small discontinuity in volume could explain the coexistence of the phases over several pressure points for ANiF. By using the B–M EOS fit for AZnF, the change in volume upon the transition at 1.44 GPa could be estimated to be 2.0%.
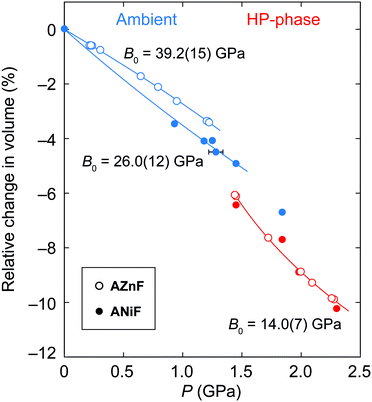 | ||
| Fig. 4 The relative changes in the unit-cell volume of the ambient (blue) and high-pressure phases (red) of ANiF (filled circles) and AZnF (empty circles). A second-order B–M EOS is fitted to ambient ANiF, a third-order B–M EOS is fitted to AZnF and a modified version of the third-order B–M EOS is fitted to the AZnF-II phase using PASCal.51 | ||
The relative pressure-dependent variations in the principal axes of the compressibility tensor of ANiF and AZnF are given in Fig. 5.51 Both structures exhibit a very similar pressure-dependent behaviour. The most striking feature is the increase in compressibility of the AMF-II phases compared to their ambient structures. The ambient phase compressibility and anisotropic variation in a- and c-axes have already been detailed in ref. 32 to arise from framework angle variation, known as a ‘hinging’ mechanism. Here, we obtain similar values of compressibility (K) for AZnF at Ka = 15.9(9) TPa−1 and Kc = −2.0(3) TPa−1 along the a- and c-axes, respectively. For the AMF-II phases, however, the anisotropy between the principal axes x1 and x3 which are mostly along the a- and c-axes, respectively, is much greater, while the compressibility along the b-axis is almost zero [Fig. 5]. In particular, the principal axis compressibilities for AZnF-II were calculated to be K1 = 47.9(17) TPa−1 (along the principal axis direction 0.9984a − 0.0559c), Kb = 0.0(9) TPa−1, K3 = −6.93(18) TPa−1 (along the principal axis direction 0.4048a + 0.9144c) using PASCal.51 We note that the enhancement of compressibility upon the symmetry-breaking transition of AMF resembles the increase in flexibility observed in the ferroelastic transitions of copper(I) tricyanomethanide and azetidinium manganese formate upon cooling.58,59
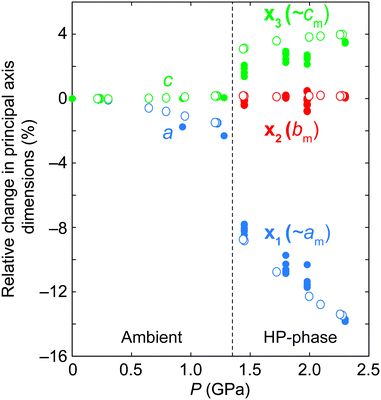 | ||
| Fig. 5 Relative changes in the principal axes of ANiF (filled circles) and AZnF (open circles) as a function of pressure, as calculated by PASCal.51 The principal axes are related to the monoclinic axes by x1 = 0.9992a − 0.0405c, x2 = −b, and x3 = −0.4732a − 0.8809c for ANiF-II, and x1 = 0.9984a − 0.0559c, x2 = b, and x3 = 0.4048a + 0.9144c for AZnF-II. | ||
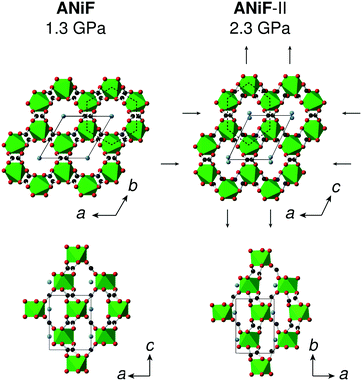
The compression of the principal axes in the AMF-II phases can be understood by the structural distortions that occur. While the ab-plane of the hexagonal AMF structures shows isotropic compression, the AMF-II phases exhibit distortions in the hexagonal motifs that give rise to the anisotropic compressibility observed in this same plane [Fig. 6]. Deformation of the hexagonal (or honeycomb) structure has already been identified as a geometric motif that can allow negative linear compressibility due to the changes in the angles forming the hexagon.56,60–62 Indeed, we observe large variation in the formate-connected M⋯M⋯M framework angles associated with this distortion [Fig. S3†]. The hinging mechanism in the hexagonal ac-plane that gave rise to negative linear compressibility along the c-axis is now cancelled out by bond compression in the monoclinic AMF-II phase, giving rise to the observed zero compressibility along the b-axis [Fig. 5].63
As the P21 symmetry of the high-pressure phase is polar, any polarisation that may arise due to the off-centre position of the ammonium cations relative to the anionic metal formate framework could be estimated based upon the crystal structure, as was performed for the low-temperature ferroelectric phases of [NH4][MII(HCOO)3] with M = Mn, Fe, Co, or Zn.2 Due to the high sensitivity of the N scattering with neutron diffraction, we used the Rietveld-refined structures from AZnF-II to determine any polar displacements in the ammonium cation. The ambient P6322 phase and the P21 high-pressure phases of AZnF were compared using the Bilbao Crystallographic Server using the structure relations application to minimise the differences between equivalent atoms (excluding D atoms).64,65 By comparing the N positions of the P6322 and P21 phases, taking into account the origin offset calculated by the Bilbao Crystallographic Server, the polar displacements along the monoclinic b-axis could be calculated. Using these displacements, the spontaneous polarisation could be determined using eqn (2):
| Ps = mΔyQe/V, | (2) |
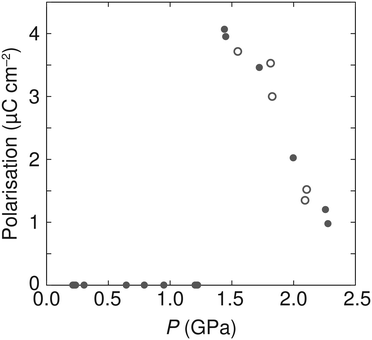 | ||
| Fig. 7 Pressure dependence of the calculated polarisation in AZnF using eqn (2). Solid circles indicate data acquired upon compression, and open circles represent data measured upon decompression. | ||
The mechanism of the ammonium cation polar displacements can be related to the anisotropic distortions of the cavity in which the ammonium cations are found and thus the distances in neighbouring oxygen atoms of the formate linkers. We observe that a polar arrangement in the ammonium cation allows for a greater number of shorter N⋯O distances compared to a non-polar arrangement (Fig. S9†). Thus, the polar displacements of the ammonium cations are due to a combination of the distortion in the metal formate framework, creating an anisotropic environment for the ammonium cation, and the weak host–guest interactions that favour a position within the cavity with a greater number of shorter N⋯O distances. Upon increasing pressure, however, the magnitude of polarisation in the AZnF-II phase decreases. This behaviour is related to the greater packing efficiency which can be achieved with a non-polar arrangement of the ammonium cations. In particular, the calculated void space of the zinc formate network without the presence of the ammonium cation was evaluated as a function of pressure, and shows a reduction and a shift towards a non-polar arrangement upon compression (Fig. S10†).
In the high-pressure phases of AMF-II, we could not locate the hydrogen positions of the ammonium cation, and consequently, it is not possible to distinguish whether they remain dynamically disordered after the transition. However, the high-pressure Raman spectra of both ANiF-II and AFeF-II do not show any evidence of NH4+ ordering (Fig. S11†), in agreement with a high-pressure IR and Raman study on [ND4][Zn(DCOO)3].33 This means that while the ordering of NH4+ upon cooling causes small structural distortions in the metal formate framework, the distortion of the framework itself at ambient temperature and high pressure is not sufficient to cease the dynamic disorder of the ammonium cations in the pressure range studied.
4 Conclusions
In summary, we have determined the high-pressure monoclinic phases of ANiF-II and AFeF-II by taking into account all the diffraction data arising from the six twin domains, and have refined the same structural model for the high-pressure neutron data of AZnF-II. These models show a distorted metal formate structure, particularly in the framework angles between formate-connected metal coordination. The transition pressures for the ammonium metal formates seem to follow the inverse trend to the cation size, highlighting that the degree of framework flexibility may be a factor for determining the onset of the metal formate distortion.The principal axis compressibilities of the ANiF-II and AZnF-II phases revealed much greater anisotropy than those of the ambient AMF phases, which arises in the plane of the hexagonal motifs. The distortion of these hexagons gives rise to negative linear compressibility (−7 TPa−1) along one direction and large compressibility along the perpendicular one (48 TPa−1). Finally, we show a different mechanism for achieving structural polarisation in the ammonium metal formate family that is dependent on distortions in the metal formate framework. Larger polarisation values could be expected by both (i) maintaining sufficient space to accommodate polar displacements of the A-site cations and (ii) increasing the interaction strength between the A-site cation and the metal formate, so that the distortion of the metal formate induces a greater A-site cation displacement. This mechanism of polarisation has also important implications for the magnetic ordering of these compounds because the M–formate–M linkages are much more readily affected upon the pressure-induced distortion. In order to achieve similar polar distortions under ambient conditions, synthesis strategies using mixed ligands with slightly different geometries such as HCOO− and CO32− may give rise to distorted framework structures that could host polar displacements in the A-site cation.
Acknowledgements
We thank the ESRF, ISIS neutron source, and DESY for beamtimes. I. E. C. thanks Somnath Dey for useful discussions, and Dr. Andreas Schönleber and Dr. Christian Hübschle for their assistance with the low-temperature ANiF data collection. I. E. C. would like to acknowledge the Alexander von Humboldt Foundation for funding. A. L. G. acknowledges the ERC (Grant 279705) and EPSRC (Grant EP/G004528/2) for financial support. N. D. thanks the DFG for financial support through the Heisenberg Program and Project No. DU 954-8/1. N. D. and L. D. gratefully acknowledge the Federal Ministry of Education and Research (BMBF, Germany) for funding.References
- G.-C. Xu, X.-M. Ma, L. Zhang, Z.-M. Wang and S. Gao, J. Am. Chem. Soc., 2010, 132, 9588–9590 CrossRef CAS PubMed.
- G.-C. Xu, W. Zhang, X.-M. Ma, Y.-H. Chen, L. Zhang, H.-L. Cai, Z.-M. Wang, R.-G. Xiong and S. Gao, J. Am. Chem. Soc., 2011, 133, 14948–14951 CrossRef CAS PubMed.
- R. Shang, S. Chen, K.-L. Hu, B.-W. Wang, Z.-M. Wang and S. Gao, Chem. – Eur. J., 2016, 22, 6199–6203 CrossRef CAS PubMed.
- Z. Wang, B. Zhang, K. Inoue, H. Fujiwara, T. Otsuka, H. Kobayashi and M. Kurmoo, Inorg. Chem., 2007, 46, 437–445 CrossRef CAS PubMed.
- Z. Wang, K. Hu, S. Gao and H. Kobayashi, Adv. Mater., 2010, 22, 1526–1533 CrossRef CAS PubMed.
- J. M. Lawler, P. Manuel, A. L. Thompson and P. J. Saines, Dalton Trans., 2015, 44, 11613–11620 RSC.
- K.-L. Hu, M. Kurmoo, Z. Wang and S. Gao, Chem. – Eur. J., 2009, 15, 12050–12064 CrossRef CAS PubMed.
- P. Jain, V. Ramachandran, R. J. Clark, H. D. Zhou, B. H. Toby, N. S. Dalal, H. W. Kroto and A. K. Cheetham, J. Am. Chem. Soc., 2009, 131, 13625–13627 CrossRef CAS PubMed.
- Y. Tian, A. Stroppa, Y. Chai, L. Yan, S. Wang, P. Barone, S. Picozzi and Y. Sun, Sci. Rep., 2014, 4, 6062 CrossRef CAS PubMed.
- Y. Tian, A. Stroppa, Y.-S. Chai, P. Barone, M. Perez-Mato, S. Picozzi and Y. Sun, Phys. Status Solidi RRL, 2015, 9, 62–67 CrossRef CAS.
- L. C. Gómez-Aguirre, B. Pato-Doldán, J. Mira, S. Castro-García, M. A. Señarís-Rodríguez, M. Sánchez-Andújar, J. Singleton and V. S. Zapf, J. Am. Chem. Soc., 2015, 138, 1122–1125 CrossRef PubMed.
- A. Stroppa, P. Barone, P. Jain, J. M. Perez-Mato and S. Picozzi, Adv. Mater., 2013, 25, 2284–2290 CrossRef CAS PubMed.
- A. Stroppa, P. Jain, P. Barone, M. Marsman, J. M. Perez-Mato, A. K. Cheetham, H. W. Kroto and S. Picozzi, Angew. Chem., Int. Ed., 2011, 50, 5847–5850 CrossRef CAS PubMed.
- Z. Zhang, W. Li, M. A. Carpenter, C. J. Howard and A. K. Cheetham, CrystEngComm, 2015, 17, 370–374 RSC.
- M. Mącka, K. Szymborska-Małek, A. Ciupa and J. Hanuza, Vib. Spectrosc., 2015, 77, 17–24 CrossRef.
- M. Mącka, A. Pietraszko, B. Macalik and K. Hermanowicz, Inorg. Chem., 2014, 53, 787–794 CrossRef PubMed.
- Z. Wang, B. Zhang, T. Otsuka, K. Inoue, H. Kobayashi and M. Kurmoo, Dalton Trans., 2004, 2209–2216 RSC.
- X.-Y. Wang, L. Gan, S.-W. Zhang and S. Gao, Inorg. Chem., 2004, 43, 4615–4625 CrossRef CAS PubMed.
- X.-Y. Wang, Z.-M. Wang and S. Gao, Chem. Commun., 2008, 281–294 RSC.
- P. Baker, T. Lancaster, I. Franke, W. Hayes, S. Blundell, F. Pratt, P. Jain, Z.-M. Wang and M. Kurmoo, Phys. Rev. B, 2010, 82, 012407 CrossRef.
- Z. Wang, P. Jain, K.-Y. Choi, J. van Tol, A. K. Cheetham, H. W. Kroto, H.-J. Koo, H. Zhou, J. Hwang, E. S. Choi, M.-H. Whangbo and N. S. Dalal, Phys. Rev. B, 2013, 87, 224406 CrossRef.
- R. Shang, S. Chen, Z.-M. Wang and S. Gao, Chem. – Eur. J., 2014, 20, 15872–15883 CrossRef CAS PubMed.
- Y. Tian, W. Wang, Y. Chai, J. Cong, S. Shen, L. Yan, S. Wang, X. Han and Y. Sun, Phys. Rev. Lett., 2014, 112, 017202 CrossRef PubMed.
- B. Pato-Doldán, M. Sánchez-Andújar, L. C. Gómez-Aguirre, S. Yáñez-Vilar, J. López-Beceiro, C. Gracia-Fernández, A. A. Haghighirad, F. Ritter, S. Castro-García and M. A. Señarís-Rodríguez, Phys. Chem. Chem. Phys., 2012, 14, 8498–8501 RSC.
- R. Shang, G.-C. Xu, Z.-M. Wang and S. Gao, Chem. – Eur. J., 2014, 20, 1146–1158 CrossRef CAS PubMed.
- J. Xu, B. E. Lucier, R. Sinelnikov, V. V. Terskikh, V. N. Staroverov and Y. Huang, Chem. – Eur. J., 2015, 21, 14348–14361 CrossRef CAS PubMed.
- D. Di Sante, A. Stroppa, P. Jain and S. Picozzi, J. Am. Chem. Soc., 2013, 135, 18126–18130 CrossRef CAS PubMed.
- G. Kieslich, S. Kumagai, A. C. Forse, S. Sun, S. Henke, M. Yamashita, C. P. Grey and A. K. Cheetham, Chem. Sci., 2016, 7, 5108–5112 RSC.
- S. Chen, R. Shang, B.-W. Wang, Z.-M. Wang and S. Gao, Angew. Chem., 2015, 127, 11245–11248 CrossRef.
- M. Mącka, A. Sieradzki, B. Bondzior, P. Dereń, J. Hanuza and K. Hermanowicz, J. Mater. Chem. C, 2015, 3, 9337–9345 RSC.
- S. Ghosh, D. Di Sante and A. Stroppa, J. Phys. Chem. Lett., 2015, 6, 4553–4559 CrossRef CAS PubMed.
- W. Li, M. R. Probert, M. Kosa, T. D. Bennett, A. Thirumurugan, R. P. Burwood, M. Parinello, J. A. K. Howard and A. K. Cheetham, J. Am. Chem. Soc., 2012, 134, 11940–11943 CrossRef CAS PubMed.
- M. Mącka, P. Kadłubański, P. T. C. Freire, B. Macalik, W. Paraguassu, K. Hermanowicz and J. Hanuza, Inorg. Chem., 2014, 53, 9615–9624 CrossRef PubMed.
- L. C. Gómez-Aguirre, B. Pato-Doldán, A. Stroppa, S. Yáñez-Vilar, L. Bayarjargal, B. Winkler, S. Castro-García, J. Mira, M. Sánchez-Andújar and M. A. Señarís-Rodríguez, Inorg. Chem., 2015, 54, 2109–2116 CrossRef PubMed.
- C. L. Bull, N. P. Funnell, M. G. Tucker, S. Hull, D. J. Francis and W. G. Marshall, High Pressure Res., 2016, 36, 493–511 CrossRef.
- V. A. Sidorov and R. A. Sadykov, J. Phys.: Condens. Matter, 2005, 17, S3005–S3008 CrossRef CAS.
- A. D. Fortes, I. G. Wood, M. Alfredsson, L. Vočadlo, K. S. Knight, W. G. Marshall, M. G. Tucker and F. Fernandez-Alonso, High Pressure Res., 2007, 27, 201–212 CrossRef CAS.
- A. D. Fortes, I. G. Wood, M. Alfredsson, L. Vočadlo, K. S. Knight, W. G. Marshall, M. G. Tucker and F. Fernandez-Alonso, High Pressure Res., 2012, 32, 337 Search PubMed , (corrigendum).
- A. A. Coelho, TOPAS-Academic, version 4.1 (computer software), Coelho Software, Brisbane Search PubMed.
- http://kantor.50webs.com/ruby.htm .
- A. Dewaele, M. Torrent, P. Loubeyre and M. Mezouar, Phys. Rev. B, 2008, 78, 104102 CrossRef.
- H.-P. Liermann, Z. Konôpková, W. Morgenroth, K. Glazyrin, J. Bednarčik, E. E. McBride, S. Petitgirard, J. T. Delitz, M. Wendt, Y. Bican, A. Ehnes, I. Schwark, A. Rothkirch, M. Tischer, J. Heuer, H. Schulte-Schrepping, T. Kracht and H. Franz, J. Synchrotron Radiat., 2015, 22, 908–924 CAS.
- I. E. Collings, E. Bykova, M. Bykov, S. Petitgirard, M. Hanfland, D. Paliwoda, L. Dubrovinsky and N. Dubrovinskaia, ChemPhysChem, 2016 DOI:10.1002/cphc.201600854.
- Agilent Technologies, CrysAlisPro Software system, 2013 Search PubMed.
- V. Petříček, M. Dušek and L. Palatinus, Z. Kristallogr., 2014, 229, 345–352 Search PubMed.
- E. K. H. Salje, Phase transitions in ferroelastic and co-elastic crystals, Cambridge University Press, 1990 Search PubMed.
- K. Friese and A. Grzechnik, Z. Kristallogr., 2014, 229, 158–168 CAS.
- S. Parsons, Acta Cryst. D, 2003, 59, 1995–2003 CrossRef.
- I. E. Collings, J. A. Hill, A. B. Cairns, R. I. Cooper, A. L. Thompson, J. E. Parker, C. C. Tang and A. L. Goodwin, Dalton Trans., 2016, 45, 4169–4178 RSC.
- ISOTROPY Software Suite, http://iso.byu.edu Search PubMed.
- M. J. Cliffe and A. L. Goodwin, J. Appl. Crystallogr., 2012, 45, 1321–1329 CrossRef CAS.
- E. C. Spencer, N. L. Ross and R. J. Angel, J. Mater. Chem., 2012, 22, 2074–2080 RSC.
- I. E. Collings, A. B. Cairns, A. L. Thompson, J. E. Parker, C. C. Tang, M. G. Tucker, J. Catafesta, C. Levelut, J. Haines, V. Dmitriev, P. Pattison and A. L. Goodwin, J. Am. Chem. Soc., 2013, 135, 7610–7620 CrossRef CAS PubMed.
- S. C. McKellar and S. A. Moggach, Acta Cryst. B, 2015, 71, 587–607 CrossRef CAS PubMed.
- J. C. Tan and A. K. Cheetham, Chem. Soc. Rev., 2011, 40, 1059–1080 RSC.
- A. B. Cairns, J. Catafesta, C. Levelut, J. Rouquette, A. Van Der Lee, L. Peters, A. L. Thompson, V. Dmitriev, J. Haines and A. L. Goodwin, Nat. Mater., 2013, 12, 212–216 CrossRef CAS PubMed.
- A. L. Goodwin, D. A. Keen and M. G. Tucker, Proc. Natl. Acad. Sci. U. S. A., 2008, 105, 18708–18713 CrossRef CAS PubMed.
- S. J. Hunt, M. J. Cliffe, J. A. Hill, A. B. Cairns, N. P. Funnell and A. L. Goodwin, CrystEngComm, 2015, 17, 361–369 RSC.
- W. Li, Z. Zhang, E. G. Bithell, A. S. Batsanov, P. T. Barton, P. J. Saines, P. Jain, C. J. Howard, M. A. Carpenter and A. K. Cheetham, Acta Mater., 2013, 61, 4928–4938 CrossRef CAS.
- J. N. Grima, D. Attard, R. Caruana-Gauci and R. Gatt, Scr. Mater., 2011, 65, 565–568 CrossRef CAS.
- A. B. Cairns and A. L. Goodwin, Phys. Chem. Chem. Phys., 2015, 17, 20449–20465 RSC.
- J. P. Formosa, R. Cauchi and J. N. Grima, Phys. Status Solidi B, 2015, 252, 1656–1663 CrossRef CAS.
- J. M. Ogborn, I. E. Collings, S. A. Moggach, A. L. Thompson and A. L. Goodwin, Chem. Sci., 2012, 3, 3011–3017 RSC.
- http://www.cryst.ehu.es/ .
- M. I. Aroyo, J. M. Perez-Mato, D. Orobengoa, E. Tasci, G. de la Flor and A. Kirov, Bulg. Chem. Commun., 2011, 43, 183–197 CAS.
Footnotes |
| † Electronic supplementary information (ESI) available: Low-temperature SCXRD, HP-SCXRD details, twin matrices, Rietveld fits, lattice parameters, atomic coordinates, N⋯O distances, void maps of zinc formate, and HP Raman spectroscopy. CCDC 1501449–1501454. For ESI and crystallographic data in CIF or other electronic format see DOI: 10.1039/c6ce01891b |
| ‡ Low-temperature single-crystal X-ray diffraction measurements were performed on ANiF (ESI,† Fig. S1). |
| This journal is © The Royal Society of Chemistry 2016 |

