 Open Access Article
Creative Commons Attribution 3.0 Unported Licence
Flexible chiral pyrazolate-based metal–organic framework containing saddle-type CuI4(pyrazolate)4 units†
Maciej
Grzywa
,
Dmytro
Denysenko
,
Andreas
Schaller
,
Andreas
Kalytta-Mewes
and
Dirk
Volkmer
*
Institute of Physics, Chair of Solid State and Materials Chemistry, Augsburg University, Universitaetsstrasse 1, 86159 Augsburg, Germany. E-mail: dirk.volkmer@physik.uni-augsburg.de
First published on 13th September 2016
Abstract
The syntheses and crystal structures of [CuI2(phbpz)]·MeOH (lp-CFA-9, lp = large-pore) and [CuI2(phbpz)] (np-CFA-9, np = narrow-pore; H2-phbpz = 3,3′,5,5′-tetraphenyl-1H,1′H-4,4′-bipyrazole) are described. The copper(I)-containing metal–organic framework (termed ![[C with combining low line]](https://www.rsc.org/images/entities/char_0043_0332.gif) oordination
oordination ![[F with combining low line]](https://www.rsc.org/images/entities/char_0046_0332.gif) ramework
ramework ![[A with combining low line]](https://www.rsc.org/images/entities/char_0041_0332.gif) ugsburg University-9, lp-CFA-9) crystallizes in the trigonal crystal system, within the chiral space group P3221 (no. 154) and with the following unit cell parameters: a =18.2348(6), c = 16.3950(4) Å, and V = 4721.1(2) Å3. Lp-CFA-9 features a 3-D microporous framework structure of Cu4pz4 (pz = pyrazolate) SBUs with the D2d (=
ugsburg University-9, lp-CFA-9) crystallizes in the trigonal crystal system, within the chiral space group P3221 (no. 154) and with the following unit cell parameters: a =18.2348(6), c = 16.3950(4) Å, and V = 4721.1(2) Å3. Lp-CFA-9 features a 3-D microporous framework structure of Cu4pz4 (pz = pyrazolate) SBUs with the D2d (= ![[4 with combining macron]](https://www.rsc.org/images/entities/char_0034_0304.gif) 2m) symmetry connected by single bonds creating one-dimensional channels expanding in the c-direction of the crystal lattice. The framework flexibility of CFA-9 has been demonstrated by single-crystal and powder X-ray analyses as well as by sorption measurements. CFA-9 exhibits weak binding of carbon monoxide on Cu(I) centers. The reactivity of CFA-9 towards oxidizing agents, such as H2O2, t-BuOOH and Br2 was also investigated. Additionally, CFA-9 shows luminescence upon exposure to UV radiation.
2m) symmetry connected by single bonds creating one-dimensional channels expanding in the c-direction of the crystal lattice. The framework flexibility of CFA-9 has been demonstrated by single-crystal and powder X-ray analyses as well as by sorption measurements. CFA-9 exhibits weak binding of carbon monoxide on Cu(I) centers. The reactivity of CFA-9 towards oxidizing agents, such as H2O2, t-BuOOH and Br2 was also investigated. Additionally, CFA-9 shows luminescence upon exposure to UV radiation.
Introduction
During the last two decades, major efforts have been devoted to potential applications of metal–organic frameworks in catalysis,1 gas storage and separation,1c,2 drug delivery and biomedical imaging3 and electrochemical energy storage.4 Among about 20![[thin space (1/6-em)]](https://www.rsc.org/images/entities/char_2009.gif) 000 MOF structures listed in the CSD, only about 100 compounds reveal substantial breathing transitions.5 Breathing MOFs, which constitute a class of soft porous crystals (SPCs), feature a drastic change in unit cell volume (pore volume) upon the action of external stimuli such as guest molecule adsorption/desorption, temperature, pressure, light, and electric and magnetic fields.6 Searching the literature by words using ‘breathing MOF’ in the databases SciFinder,7 PubMed8 and Web of Sciences9 yields 69, 37 and 72 references, respectively. Among these, only two references give examples of chiral flexible MOFs, e.g. [La(BTB)(H2O)·3DMF]n (H3-BTB = 1,3,5-tris(4-carboxyphenyl)benzene),10 and supramolecular MOFs (SMOFs) such as [Ca(Lala)2(H2O)]·H2O; [Ca(Lser)2]·2H2O; [Sr(Lala)2(H2O)]·3H2O; [Sr(Lala*)2(H2O)]·3H2O; and [Sr(Lser)2(H2O)] (Lala = (S)-2-(1,8-naphthalimido)propanoate, Lser = (S)-2-(1,8-naphthalimido)-3-hydroxypropanoate, and Lala* = (R)-2-(1,8-naphthalimido)propanoate).11 Chiral MOFs have attracted particular attention due to their potential applications in the fields of enantioselective catalysis,12 chiral separation,13 nonlinear optics,14 and magnetism.15
000 MOF structures listed in the CSD, only about 100 compounds reveal substantial breathing transitions.5 Breathing MOFs, which constitute a class of soft porous crystals (SPCs), feature a drastic change in unit cell volume (pore volume) upon the action of external stimuli such as guest molecule adsorption/desorption, temperature, pressure, light, and electric and magnetic fields.6 Searching the literature by words using ‘breathing MOF’ in the databases SciFinder,7 PubMed8 and Web of Sciences9 yields 69, 37 and 72 references, respectively. Among these, only two references give examples of chiral flexible MOFs, e.g. [La(BTB)(H2O)·3DMF]n (H3-BTB = 1,3,5-tris(4-carboxyphenyl)benzene),10 and supramolecular MOFs (SMOFs) such as [Ca(Lala)2(H2O)]·H2O; [Ca(Lser)2]·2H2O; [Sr(Lala)2(H2O)]·3H2O; [Sr(Lala*)2(H2O)]·3H2O; and [Sr(Lser)2(H2O)] (Lala = (S)-2-(1,8-naphthalimido)propanoate, Lser = (S)-2-(1,8-naphthalimido)-3-hydroxypropanoate, and Lala* = (R)-2-(1,8-naphthalimido)propanoate).11 Chiral MOFs have attracted particular attention due to their potential applications in the fields of enantioselective catalysis,12 chiral separation,13 nonlinear optics,14 and magnetism.15
On the other hand, copper-based MOFs have attracted particular interest, which relates to the role of copper centers in the active sites of metalloenzymes, such as oxidases or oxygenases.16 Biologically inspired MOF catalysts hold great promise for a wide range of synthetic applications in the oxidation of organic intermediates containing non-activated C–H bonds. Few reports on applications of Cu-MOFs as oxidation catalysts have appeared in the literature. In particular, Cu-catalyzed hydroxylation of phenol,17 oxidation of trimethylsilyl enolates to α-hydroxyketones,18 allylic oxidation of cyclohexene,19 cross-dehydrogenative coupling reactions of ethers with 2-carbonyl-substituted phenols,20 oxidation of benzene derivatives and benzylic compounds21 and arylation of heteroarenes22 have been described.
Moreover, poly(azolate)-based MOFs (pyrazolate, imidazolate, triazolate, and tetrazolate) are often characterized by superior chemical and thermal stability as compared to their widespread carboxylate-based counterparts, the latter often exhibiting low stability against acidic or basic media and moisture.23
As part of our long-term research on functional Cu-MOFs, we have previously described the catalytic activity of CFA-5 (a Cu(II)-containing MOF) in the aerobic oxidation of tetralin24 and the reactivity of CuI-MFU-4l towards C2H4 and CO.25CuI-MFU-4l contains highly reactive, coordinatively unsaturated (= “open”) Cu(I)-metal sites, showing fully reversible chemisorption of small molecules such as O2, N2 or H2 with high isosteric heats of adsorption. Our former studies on the reactivity of a Cu(I)-containing MOF CFA-2 toward molecular oxygen have shown that this compound is stable during the oxidation and reduction of the Cu ions, suggesting its potential usage in liquid-phase oxidation reactions.26
Here, we report on the synthesis and characterization of a new Cu(I)-MOF, termed CFA-9 (![[C with combining low line]](https://www.rsc.org/images/entities/char_0043_0332.gif) oordination
oordination ![[F with combining low line]](https://www.rsc.org/images/entities/char_0046_0332.gif) ramework
ramework ![[A with combining low line]](https://www.rsc.org/images/entities/char_0041_0332.gif) ugsburg University-9), featuring a flexible 3-D microporous framework structure of Cu4pz4 (pz = pyrazolate) SBUs connected to each other by single bonds (Scheme 1). The Cu4pz4 structure motif is rather uncommon and only a few examples of crystalline compounds containing a Cu4pz4 unit can be found in the literature, e.g. a discrete metal complex [Cu4(HL2)2] (H3L2 = 1,3,5-tris((3,5-diphenyl-1H-pyrazol-4-yl)methyl)benzene)27 and a metal–organic framework Cu2L (L = 3,3′,5,5′-tetraethyl-4,4′-bipyrazolate) including two types of SBUs, namely, triangular Cu3pz3 units and saddle-type Cu4pz4 units.28 The flexibility of the CFA-9 framework is demonstrated by single-crystal and powder X-ray analyses as well as by gas sorption measurements. CFA-9 is characterized by elemental and thermogravimetric analyses, variable temperature powder X-ray diffraction, and IR and luminescence spectroscopy. Additionally, the reactivity of CFA-9 towards oxidizing agents, such as H2O2, t-BuOOH and Br2 is reported.
ugsburg University-9), featuring a flexible 3-D microporous framework structure of Cu4pz4 (pz = pyrazolate) SBUs connected to each other by single bonds (Scheme 1). The Cu4pz4 structure motif is rather uncommon and only a few examples of crystalline compounds containing a Cu4pz4 unit can be found in the literature, e.g. a discrete metal complex [Cu4(HL2)2] (H3L2 = 1,3,5-tris((3,5-diphenyl-1H-pyrazol-4-yl)methyl)benzene)27 and a metal–organic framework Cu2L (L = 3,3′,5,5′-tetraethyl-4,4′-bipyrazolate) including two types of SBUs, namely, triangular Cu3pz3 units and saddle-type Cu4pz4 units.28 The flexibility of the CFA-9 framework is demonstrated by single-crystal and powder X-ray analyses as well as by gas sorption measurements. CFA-9 is characterized by elemental and thermogravimetric analyses, variable temperature powder X-ray diffraction, and IR and luminescence spectroscopy. Additionally, the reactivity of CFA-9 towards oxidizing agents, such as H2O2, t-BuOOH and Br2 is reported.
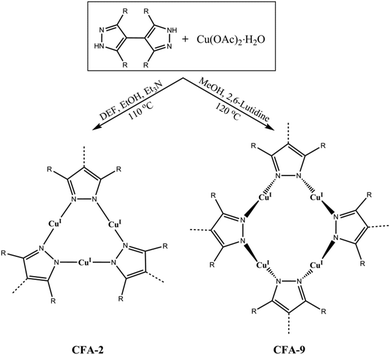 | ||
| Scheme 1 Syntheses of [CuI2(phbpz)]·2DEF·MeOH (CFA-2) and [CuI2(phbpz)]·MeOH (CFA-9) from the H2-phbpz ligand and copper(II) acetate (DEF = N,N-diethylformamide). | ||
Results and discussion
Syntheses and characterization
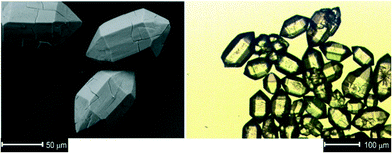
The 3,3′,5,5′-tetraphenyl-1H,1′H-4,4′-bipyrazole ligand (H2-phbpz) was synthesized according to a modified published procedure.26,29Lp-CFA-9 was synthesized by a solvothermal reaction starting from a Cu(II)-salt Cu(OAc)2·H2O and a 3,3′,5,5′-tetraphenyl-1H,1′H-4,4′-bipyrazole ligand in a MeOH/2,6-lutidine system, giving colourless hexagonal prismatic crystals (Fig. 1).Interestingly, slight changes of reaction conditions (a mixed-solvent system N,N-diethylformamide/EtOH/Et3N was used instead of the aforementioned solvent) results in the formation of the Cu(I)-MOF CFA-2 (Scheme 1). CFA-2, featuring a 3-D three-connected two-fold interpenetrated porous structure constructed of triangular Cu(I) subunits and 3,3′,5,5′-tetraphenyl-1H,1′H-4,4′-bipyrazolate (phbpz) ligands, exhibits a pronounced breathing effect upon exposure to different guest molecules.
Additionally, applying microwave irradiation in the synthesis of CFA-9, instead of conventional heating, allowed us to reduce the reaction time drastically, from 3 d to 25 min.
Single crystal structure analysis
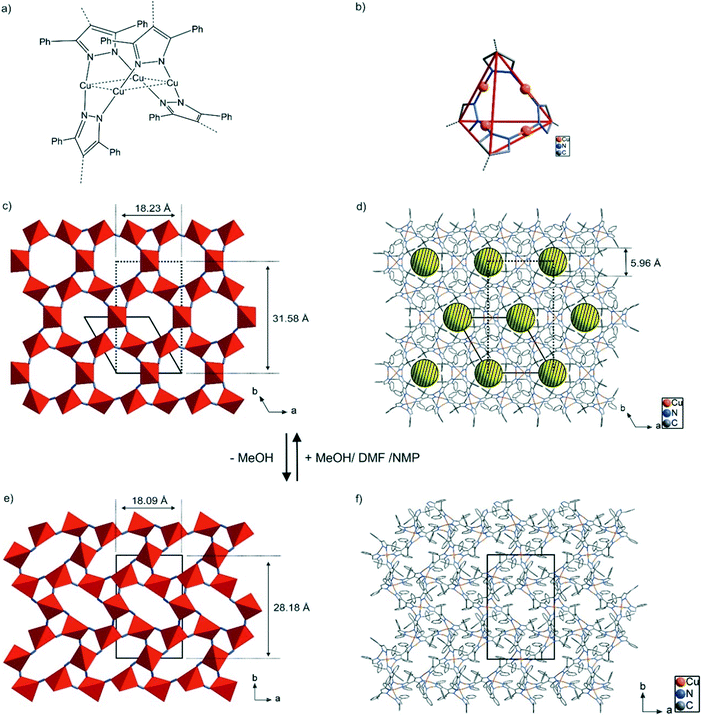
[CuI2(phbpz)]·MeOH (lp-CFA-9). Lp-CFA-9 crystallizes in the trigonal crystal system within the chiral space group P3221 (no. 154). The asymmetric unit consists of three copper, four nitrogen, thirteen carbon and twenty hydrogen atoms. An Ortep-style plot of the asymmetric unit of lp-CFA-9 is shown in the ESI,† Fig. S1. Lp-CFA-9 features a 3-D non-interpenetrated microporous structure constructed from Cu4pz4 secondary building units with the D2d (=![[4 with combining macron]](https://www.rsc.org/images/entities/char_0034_0304.gif) 2m) symmetry, each containing a tetranuclear coordination unit of four Cu(I) ions and four pyrazolate ligands, as shown in Fig. 2a and b. The Cu(I) ions within each SBU are two-fold coordinated in a nearly linear arrangement by pyrazolate N-donor atoms from the ligand molecules; the N–Cu–N dihedral angles, therefore, are close to 180° (171.6(3), 172.9(2), 177.7(3)°). The four central Cu(I) ions are in the same plane, whereas two phbpz2− ligands are positioned above and below this plane, thus building a saddle-shaped structure (see Fig. 2a). The intramolecular Cu⋯Cu distances range from 3.0252(7) to 3.1829(1) Å. The Cu–N distances range from 1.840(3) to 1.847(3) Å. These values are in good agreement with those found in the structurally related Cu-MOF, Cu2L (L = 3,3′,5,5′-tetraethyl-4,4′-bipyrazolate),28 and copper(I)-containing compounds.27 The phenyl groups of each bipyrazolate linker are twisted with respect to each other and are disordered.
2m) symmetry, each containing a tetranuclear coordination unit of four Cu(I) ions and four pyrazolate ligands, as shown in Fig. 2a and b. The Cu(I) ions within each SBU are two-fold coordinated in a nearly linear arrangement by pyrazolate N-donor atoms from the ligand molecules; the N–Cu–N dihedral angles, therefore, are close to 180° (171.6(3), 172.9(2), 177.7(3)°). The four central Cu(I) ions are in the same plane, whereas two phbpz2− ligands are positioned above and below this plane, thus building a saddle-shaped structure (see Fig. 2a). The intramolecular Cu⋯Cu distances range from 3.0252(7) to 3.1829(1) Å. The Cu–N distances range from 1.840(3) to 1.847(3) Å. These values are in good agreement with those found in the structurally related Cu-MOF, Cu2L (L = 3,3′,5,5′-tetraethyl-4,4′-bipyrazolate),28 and copper(I)-containing compounds.27 The phenyl groups of each bipyrazolate linker are twisted with respect to each other and are disordered.
The SBUs of lp-CFA-9 are connected by single bonds and create one-dimensional channels expanding in the c-direction of the crystal lattice (see Fig. 2c and d). Taking the van der Waals radii of hydrogen atoms (1.2 Å) into account, the narrowest channel diameter calculated between the hydrogen atoms of the phenyl groups is 5.96 Å. Estimation using the SQUEEZE30 program reveals that the initial solvent accessible void volume is 664.7 Å3, or 0.118 cm3 g−1, which is 14.1% of the unit cell volume (4721.1(2) Å3) for a probe radius of 2.07 Å, corresponding to the approximate van der Waals radius of carbon dioxide.31 In the crystal structure of lp-CFA-9, the channels are occupied by disordered MeOH molecules. The positions of the solvent molecules were impossible to resolve and refine from the electron density distribution. According to the crystallographic data, there is an electron count of 114 per unit cell, which corresponds to 6.5 MeOH molecules in the unit cell of lp-CFA-9. Removal of the solvent by drying and/or heating the sample leads to structural changes. Due to the fact that the lp-CFA-9 and np-CFA-9 structures are described in different crystal systems with different space groups which do not have a direct group–subgroup relation between them, the hexagonal unit cell of lp-CFA-9 was transformed to the orthorhombic one (see Fig. 2c–f). Direct comparison of the unit cells indicates that the structural transition from the solvated sample (lp-CFA-9) to a desolvated one (np-CFA-9) is connected with the dynamic shortening of the a- (from 18.23 to 18.09 Å) and b-lattice parameters (from 31.58 Å to 28.18 Å) and slight elongation of the c-parameter (from 16.40 to 16.72 Å). This process is accompanied by the unit cell volume change from 9442 Å3 (lp-CFA-9) to 8524 Å3 (np-CFA-9). The framework flexibility results from the properties of the tetraphenylbipyrazolate ligand where two pyrazolate rings can rotate around the central C–C single bond. In lp-CFA-9, the angle between the planes created by pyrazolate rings is 60.7°, while in np-CFA-9 the angle value ranges from 65.0 to 65.5° (see Fig. 3). The intramolecular Cu⋯Cu distances in np-CFA-9 range from 3.049(3) to 3.129(1) Å. The Cu–N distances range from 1.774(15) to 1.916(13) Å (see the ESI,† Table S1). Taking the van der Waals radii of hydrogen atoms (1.2 Å) into account, the narrowest channel diameter calculated between the hydrogen atoms of the Ph-groups in np-CFA-9 is 4.07 Å, while the smallest aperture of the channel is 2.27 Å. Estimation using the SQUEEZE30 program reveals that the initial solvent accessible void volume is 566.5 Å3, or 0.046 cm3 g−1, which is 6.6% of the unit cell volume (8524.4(11) Å3) for a probe radius of 2.07 Å,31 corresponding to the approximate van der Waals radius of carbon dioxide.
 | ||
| Fig. 3 Structural overlay of the SBUs of lp-CFA-9 and np-CFA-9 (lp-CFA-9 – SBU in black, np-CFA-9 – two different SBUs in red and green). | ||
Topology analysis using the TOPOS program32 (see the ESI†) reveals that the lp-CFA-9 and np-CFA-9 coordination networks can be described as chiral qtz (quartz) nets by regarding the Cu4pz4 SBUs as four-connected nodes and the phbpz2− ligands as spacers (see the ESI† and Fig. 4).
 | ||
| Fig. 4 (a) Simplified diagram of the SBUs of CFA-9. Topological representation of lp-CFA-9 (b) and np-CFA-9 (c). | ||
The chirality of both networks results from the D2d symmetry of their SBUs. It is known that α-quartz exists in two crystal structure forms, which represent exact mirror images of each other. Taking into account that these forms are described by two different space groups P3121 (no. 152, right-handed screw) and P3221 (no. 154, left-handed screw), it can be concluded that lp-CFA-9 described in the P3221 (no. 154) space group represents the left-handed screw.33 Due to the fact that in the case of np-CFA-9 two enantiomers can be described in the same P21212 (no. 18) space group, the structure of np-CFA-9 was transformed to the P6222 (no. 180) and P6422 (no. 181) space groups. From the comparison of two structures of lp-CFA-9P3221 (no. 154) and np-CFA-9P6222 (no. 180), it follows that the networks exhibit the same chirality. Interestingly, to the best of our knowledge, only one example of a predicted SiO2 polymorph described in the P21212 (no. 18) space group can be found in the literature.34
The crystal structure transformation from the solvated state to the desolvated one and back upon immersing the dried sample in polar solvents (MeOH, DEF, NMP) is dynamic and reversible, as confirmed by XRPD studies.
TGA and XRPD studies
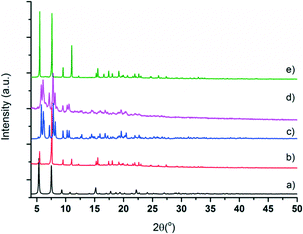
Microcrystalline powder samples of CFA-9 were exposed to air for a long period of time; the colour change of the sample from white to light green after several months reflects very slow oxidation of the Cu(I) ions. The phase purity of CFA-9 was confirmed by XRPD measurement under ambient conditions. The experimental XRPD pattern of the wet sample (a) is consistent with the simulated one (b), as gleaned from the single crystal X-ray diffraction data, as shown in Fig. 5. Differences in peak intensities are due to occluded solvent molecules. Similarly, the experimental XRPD pattern of the dried sample (c) is consistent with the simulated one (d), as gleaned from the single crystal X-ray diffraction data.In addition, the thermal stability of CFA-9 was determined by thermogravimetric (TG) and VTXRPD measurements. Prior to the measurements, the sample was heated at 100 °C under vacuum for 2 h in order to remove occluded solvent molecules (MeOH). As shown in Fig. 6, the thermogravimetric profile of CFA-9 under nitrogen exhibits a weight loss of 31% between 570 and 650 °C, while under oxygen a weight loss of 73% occurs between 350 and 400 °C. In both cases, the steps are connected with the degradation of the compound. According to the VTXRPD data presented in Fig. 7, the sample is stable up to ca. 450 °C (measurement in a capillary). Above 500 °C, Cu (PDF no. 3-1015) was detected. Removal of the solvent by drying and/or heating the sample leads to XRPD pattern changes, which is connected with the structural changes of the compound. Interestingly, the XRPD pattern of the CFA-9 sample heated at 100 °C for 0.5 h under vacuum can be recovered after the desolvated compound was taken up with polar solvents such as MeOH, EtOH, DMF, DEF or NMP, which indicates that the solvent removal is completely reversible and the initial structure can be recovered (see Fig. 5e).
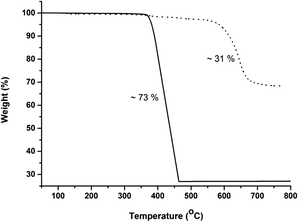 | ||
| Fig. 6 Temperature-dependent weight loss of CFA-9 under flowing nitrogen (dashed line) and oxygen (solid line) gas. | ||
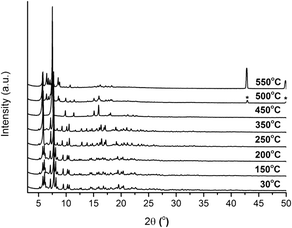 | ||
| Fig. 7 VTXRPD plots of CFA-9 kept in air and sampled in a temperature range of 30–550 °C. *Cu PDF no: 3-1015. | ||
Physisorption studies
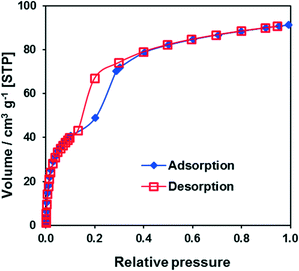
The argon adsorption isotherm for CFA-9 measured at 87.3 K (Fig. S4†) is typical of non-porous solids and reveals a BET surface area of only 11 m2 g−1. However, the sorption measurement with CO2 at 194.7 K reveals a much higher BET surface area of 189 m2 g−1 and shows a well-pronounced hysteresis in the relative pressure range 0.15–0.3 (Fig. 8), which is typical of breathing MOFs. The pore volume of np-CFA-9 determined from the adsorption branch of the CO2 isotherm at p/p0 = 0.1 is 0.051 cm3 g−1 while the volume of lp-CFA-9 determined from the adsorption branch of the CO2 isotherm at p/p0 = 0.99 is 0.115 cm3 g−1; both values correspond well to the calculated ones. The flexibility of the framework was additionally investigated by XRPD measurements under CO2 atmosphere (Fig. 9).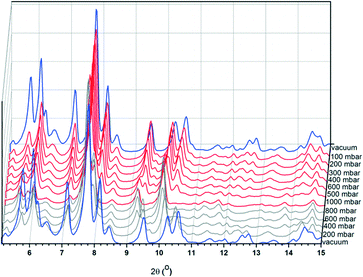 | ||
| Fig. 9 XRPD plots of CFA-9 measured at −78.5 °C under vacuum (blue lines) and under increasing CO2 pressure (red lines) and decreasing CO2 pressure (grey lines). | ||
The sample was cooled under vacuum to −78.5 °C and the pressure of CO2 was gradually increased up to 1000 mbar (red curves in Fig. 9) and then substantially decreased (grey curves). After changing from vacuum to a CO2 atmosphere, the intensity of the first five Bragg peaks decreased. With increasing CO2 pressure, new peaks occur (e.g. 9.67° 2θ at 100 mbar, 9.28° 2θ at 500 mbar, and 5.61° 2θ at 600 mbar). Next, decreasing the CO2 pressure leads to the same XRPD pattern as the one detected under vacuum (blue patterns).
The isosteric heat of CO adsorption determined from adsorption isotherms measured in the temperature range 203–223 K (Fig. S6†) lies at approx. 40 kJ mol−1 at low loading (<0.3 mmol g−1) and decreases to typical physisorption values of 17–20 kJ mol−1 at higher loading (Fig. 10). Such behaviour hints at weak binding of carbon monoxide to Cu(I) centers of CFA-9. Oxygen, in contrast, shows a constant physisorption heat of approx. 15 kJ mol−1 and thus does not bind to the Cu(I) centers.
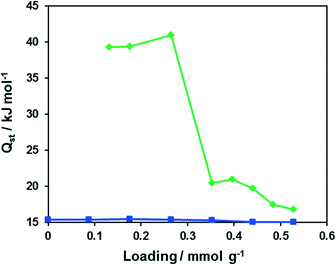 | ||
| Fig. 10 Dependencies of the isosteric heats of O2 (blue) and CO (green) adsorption on the loading for CFA-9. | ||
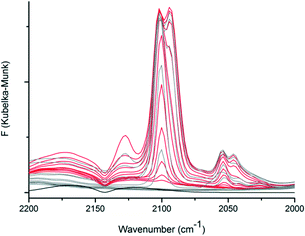
The adsorption of CO in CFA-9 was further studied by diffuse reflectance Fourier-transform IR spectroscopy (DRIFT). The pre-dried and activated CFA-9 sample was heated to 100 °C under Ar and the atmosphere was changed to CO. The bands at 2170 cm−1 and 2125 cm−1 belong to free CO molecules in the gas phase (black line, Fig. 11). At 100 °C under CO atmosphere, a new band at 2102 cm−1 appeared. Gradually decreasing the temperature in 20 °C steps led to the increase in the intensity of this band until a new weak band at 2050 cm−1 was detected at 40 °C. The corresponding spectra (red lines) are presented in Fig. 11. At −40 °C, the splitting of the band at 2102 cm−1 was observed and a new additional band centered at 2094 cm−1 was registered. Subsequent lowering of the temperature led to increasing intensities of the bands at 2102 and 2094 cm−1 and the appearance of new bands at 2127 and 2046 cm−1. At −100 °C, the atmosphere was changed to Ar, and after 1 h the sample was gradually heated up to 100 °C. The corresponding spectra (gray lines) are presented in Fig. 11. With increasing temperature, the bands at 2127, 2094 and 2046 cm−1 gradually decreased in intensity, and at −40 °C the main bands at 2102 and 2053 cm−1 were observed. Subsequent rising of the temperature led to complete vanishing of these bands at 20 °C. All these recorded bands correspond to the stretch mode of the CO molecule coordinatively bound to CuI–ions and are in good agreement with literature data: νCO = 2137 cm−1 for [Cu{HB(3,5-(CF3)2pz)3}(CO)],35 2102 cm−1 for [Cu{HB(3-C3F7pz)3}(CO)],36 2056 cm−1 for [Cu{HB(3,5-iPr2pz)3}(CO)]37 and 2043–2063 cm−1 for hemocyanin.38
In order to prove the reactivity of CFA-9 towards oxidizing reagents, the compound was oxidized by H2O2 or t-BuOOH and investigated by UV-vis spectroscopy. The solid-state UV-vis spectrum of CFA-9 displays one strong absorption peak at 318 nm in the UV region, which could be assigned to the intraligand electron transitions (Fig. 12). The UV-vis spectra of CFA-9 samples, oxidized by H2O2 or t-BuOOH, exhibit one additional broad peak with the maximum centered at ca. 600 nm, which encompasses the CuII d–d transitions.39 The XRPD patterns of the oxidized samples are similar to that of the CFA-9 sample (see Fig. S2†). Furthermore, the oxidized CFA-9 sample can be reduced back to a Cu(I)-MOF upon heating in DMF at 120 °C for 4 h. The XRPD pattern is also similar to that of the CFA-9 sample, indicating that the structure remains stable during this oxidation/reduction sequence.
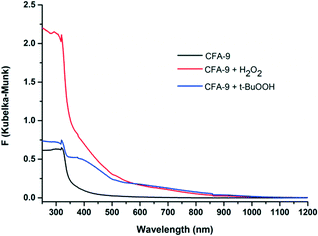 | ||
| Fig. 12 UV-vis spectra of CFA-9 at room temperature. Black line – CFA-9, red – CFA-9 oxidized by H2O2, blue – CFA-9 oxidized by t-BuOOH. | ||
X-ray photoelectron spectroscopy (XPS) further proves the redox activity of CFA-9. Fig. 13 depicts the XPS spectrum of CFA-9 oxidized by H2O2, which shows a prominent satellite feature at about 940 eV between the two Cu2p peaks. This characteristic maximum is only present for Cu(II) species,40e.g. Cu(OAc)2. The XPS spectrum of the as-synthesized CFA-9 shows only the Cu2p1/2 and Cu2p3/2 peaks at about 951 eV and 931 eV. Peak shape analysis of the Cu2p3/2 peaks of CFA-9 and oxidized CFA-9 also speaks in favour of Cu(I) for the former and Cu(II) for the latter (see Fig. 14).41
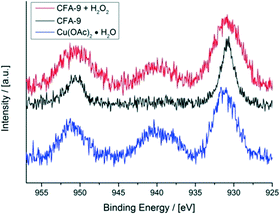 | ||
| Fig. 13 XPS spectra of the Cu2p1/2 and Cu2p3/2 regions of CFA-9 (black), CFA-9 oxidized by H2O2 (red), and Cu(OAc)2 (blue). | ||
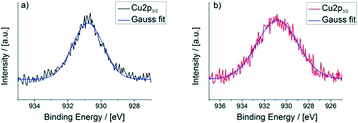 | ||
| Fig. 14 Peak shape analysis of the Cu2p3/2 peaks of a) CFA-9 (FWHM = 2.2 eV) and b) CFA-9 oxidized by H2O2 (FWHM = 4.4 eV). | ||
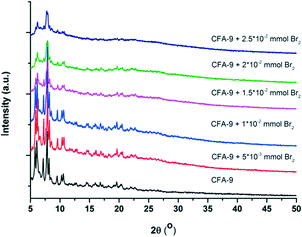
Additionally, the reactivity of CFA-9 towards Br2 was investigated. 11.3 mg (0.01 mmol) of the sample was added to solutions of Br2 in CH2Cl2 (0.005, 0.01, 0.015, 0.02 and 0.05 mmol) and stirred for 15 minutes at r. t. The color of the samples changed from colorless to brown. Then, the samples were filtered off by suction, washed thoroughly with MeOH and dried. The samples were analyzed by EDX spectroscopy (Table 1) and X-ray diffraction (Fig. 15). Several attempts were undertaken to perform single-crystal X-ray diffraction measurements. Unfortunately, the quality of the Br2-treated crystals was not sufficient for the measurement. Instead, the samples were investigated by powder X-ray diffraction. The measurements show that the crystallinity of the framework is completely retained only when a 1![[thin space (1/6-em)]](https://www.rsc.org/images/entities/char_2009.gif) :
:![[thin space (1/6-em)]](https://www.rsc.org/images/entities/char_2009.gif) 1 Br2/Cu ratio was applied. In this case, a product with an approx. Br/Cu ratio of 0.5 was obtained. Applying a higher initial Br2/Cu ratio allows the increase in the Br/Cu ratio in the product, but also leads to subsequent degradation of the framework.
1 Br2/Cu ratio was applied. In this case, a product with an approx. Br/Cu ratio of 0.5 was obtained. Applying a higher initial Br2/Cu ratio allows the increase in the Br/Cu ratio in the product, but also leads to subsequent degradation of the framework.
![[thin space (1/6-em)]](https://www.rsc.org/images/entities/char_2009.gif) :
:![[thin space (1/6-em)]](https://www.rsc.org/images/entities/char_2009.gif) Cu ratios in the products obtained from the reaction of CFA-9 with Br2
Cu ratios in the products obtained from the reaction of CFA-9 with Br2
Initial molar ratio Br2![[thin space (1/6-em)]](https://www.rsc.org/images/entities/char_2009.gif) : :![[thin space (1/6-em)]](https://www.rsc.org/images/entities/char_2009.gif) Cu Cu |
Br![[thin space (1/6-em)]](https://www.rsc.org/images/entities/char_2009.gif) : :![[thin space (1/6-em)]](https://www.rsc.org/images/entities/char_2009.gif) Cu ratio in the product Cu ratio in the product |
|---|---|
1![[thin space (1/6-em)]](https://www.rsc.org/images/entities/char_2009.gif) : :![[thin space (1/6-em)]](https://www.rsc.org/images/entities/char_2009.gif) 2 2 |
0.34 |
1![[thin space (1/6-em)]](https://www.rsc.org/images/entities/char_2009.gif) : :![[thin space (1/6-em)]](https://www.rsc.org/images/entities/char_2009.gif) 1 1 |
0.51 |
1.5![[thin space (1/6-em)]](https://www.rsc.org/images/entities/char_2009.gif) : :![[thin space (1/6-em)]](https://www.rsc.org/images/entities/char_2009.gif) 1 1 |
0.62 |
2![[thin space (1/6-em)]](https://www.rsc.org/images/entities/char_2009.gif) : :![[thin space (1/6-em)]](https://www.rsc.org/images/entities/char_2009.gif) 1 1 |
0.67 |
2.5![[thin space (1/6-em)]](https://www.rsc.org/images/entities/char_2009.gif) : :![[thin space (1/6-em)]](https://www.rsc.org/images/entities/char_2009.gif) 1 1 |
0.95 |
Photoluminescence
Pyrazolate-bridged complexes containing Cu(I) ions with d10 closed-shell electronic configuration are known to show luminescence.42 Upon irradiation with UV light, Cu(I) pyrazolates undergo a metal-to-ligand charge transfer resulting in a charge separated excited singlet state. This state can either decay to the ground state by emission of slightly red-shifted light, or undergo spin conversion into an excited triplet state, which shows slow decay (luminescence) to the ground state.43 The latter transition might be influenced by weak Cu⋯Cu interactions that typically occur in Cu(I) complexes and coordination polymers comprising bridging pyrazolate moieties. The usually broad luminescence band for Cu(I) pyrazolates is observed between ca. 460 and 660 nm (see Table 2). CFA-9 irradiated at 312 nm gave two broad emission bands with the maxima at 360 and 631 nm (Fig. 16). The luminescence behaviour of CFA-9 was almost the same as those previously reported in the literature and results from intramolecular Cu⋯Cu interactions (3.049(3)(intra) and 8.266(2)(inter) Cu⋯Cu distances in CFA-9).| Compound | Emission λmax (excited) (nm) | Cu–Cu shortest distance (Å) |
|---|---|---|
| HL = 3,5-diethyl-4-(4-pyridyl)-pyrazole. | ||
| CFA-9 | 631, 360 (312) | 3.049(3)(intra), 8.266(2)(inter) |
| CFA-2 (ref. 26) | 468 (381) | 3.192(2)(intra), 7.651(inter) |
| [Cu(μ-3,5-iPr2pz)]3 (ref. 42b) | 577 (280) | 3.0250(7)(inter), 3.1907(6)(intra) |
| [Cu(μ-3-tBu-5-iPrpz)]4 (ref. 42b) | 556.5 (280) | 3.071(2)(intra) |
| [Cu(μ-3,5-tBu2pz)]4 (ref. 42c) | 544.5 (280) | 3.1325(6)(intra) |
| [Cu(μ-3,5-Me2pz)]3 (ref. 42c) | 656 (304) | 3.195(intra), 2.946(inter) |
| [Cu(μ-3,5-(CF3)2pz)]3 (ref. 42c) | 645 (306) | 3.218(intra), 3.813(1)(inter) |
| [Cu(μ-3-(CF3)pz)]3 (ref. 42c) | 659 (306) | 3.214(intra), 3.100(inter) |
| [Cu(μ-3-(CF3)-5-Mepz)]3 (ref. 42c) | 634 (345) | 3.201(intra), 3.704(inter) |
| [Cu(pz)]3 (ref. 44) | 542 (305) | 2.954(inter), 3.194(intra) |
| [Cu2(bpz)]n (ref. 44) | 598 (305) | 3.331(inter), 3.022(intra) |
| {[4-Cl-3,5-(CF3)2pz]Cu}3 (ref. 45) | 574 (280) | 3.210(intra) |
| {[4-Br-3,5-(CF3)2pz]Cu}3 (ref. 45) | 585 (300) | 3.214(intra) |
| {CuCl[CuL]3}n (ref. 46) | 476 (355) | 3.103(1)(intra) |
| {CuBr[CuL]3}n (ref. 46) | 536 (397) | 3.094(2)(intra), 5.120(3)(inter) |
| {CuI[CuL]3}n (ref. 46) | 525 (400) | 3.126(1)(intra), 3.311(inter) |
| {CuSCN[CuL]3(MeCN)}n (ref. 46) | 560 (405) | 3.109(1)(intra), 3.368(1)(inter) |
| {Cu2I2[CuL]3}n (ref. 46) | 482 (397) | 3.100(1)(intra) |
| [Cu(ppz)]3 (ref. 47) | 564 (300) | 3.172(intra), 3.439(inter) |
| {[Cu(ppz)]3[CuCN]3} (ref. 47) | 494 (360) | 3.128(intra), 3.317(inter) |
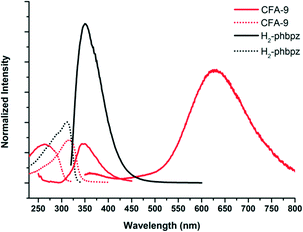 | ||
| Fig. 16 Solid-state photoluminescence spectra of CFA-9 and the H2-phbpz ligand at room temperature. Dashed-lines – excitation spectra, continuous-lines – emission spectra. | ||
Conclusions
The work reported here focuses on the synthesis and characterization of a chiral metal–organic framework assembled from tetranuclear Cu(I) secondary building units and 3,3′,5,5′-tetraphenylbipyrazolate ligands. CFA-9 exhibits breathing effects upon exposure to different kinds of polar liquids (MeOH, EtOH, DMF, DEF, NMP), whereas non-polar solvents are not taken up at all. The framework flexibility results from the properties of the tetraphenylbipyrazolate ligand where two pyrazolate rings can rotate around the central C–C single bond. The interplanar angle changes from 60.7° (fully solvated state, lp-CFA-9) to 65.0–65.5° (fully desolvated form, np-CFA-9). The structural dynamics accompanying solvent removal and uptake in CFA-9 are connected with the changes of the crystal system from hexagonal to orthorhombic (np-CFA-9 phase) and back to hexagonal (lp-CFA-9 phase), respectively. The weak chemisorption of carbon monoxide on Cu(I) centers was confirmed by sorption and IR measurements, whereas no chemisorption of oxygen was observed. The reactions of CFA-9 with H2O2 or t-BuOOH indicate that the MOF is stable during repeated oxidation/reduction sequences.Experimental
Materials and general methods
Commercially available reagents of analytical grade were used as received without further purification.Synthesis of CFA-9
![[thin space (1/6-em)]](https://www.rsc.org/images/entities/char_2009.gif) 450 W xenon arc lamp at r. t. The excitation and emission spectra were corrected for the wavelength-dependent lamp intensity and detector response, respectively.
450 W xenon arc lamp at r. t. The excitation and emission spectra were corrected for the wavelength-dependent lamp intensity and detector response, respectively.
| Compound | lp-CFA-9·MeOH | np-CFA-9 |
|---|---|---|
| a R 1 = ∑‖F0| − |Fc‖/∑|F0|. b wR2 = ∑[w(F02 − Fc2)2]/∑[w(F02)2]1/2. | ||
| Empirical formula | C31H24Cu2N4O | C30H20Cu2N4 |
| Formula | Cu2C30H20N4·MeOH | Cu2C30H20N4 |
| M r/g mol−1 | 595.62 | 563.58 |
| T/K | 100(2) | 296(2) |
| Wavelength/Å | 0.71073 | 0.71073 |
| Crystal system | Trigonal | Orthorhombic |
| Space group | P3221 (no. 154) | P21212 (no. 18) |
| a/Å | 18.2348(6) | 18.0922(15) |
| b/Å | 18.2348(6) | 28.182(2) |
| c/Å | 16.3950(4) | 16.7188(12) |
| V/Å3 | 4721.1(2) | 8524.4(11) |
| Z | 6 | 12 |
| D c/g cm−3 | 1.257 | 1.437 |
| μ/mm−1 | 1.378 | 1.530 |
| F(000) | 1824 | 3778 |
| θ range/° | 2.56 to 25.02 | 2.20 to 25.07 |
| Refls. collected | 36![[thin space (1/6-em)]](https://www.rsc.org/images/entities/char_2009.gif) 249 249 |
126![[thin space (1/6-em)]](https://www.rsc.org/images/entities/char_2009.gif) 433 433 |
| Refls. unique | 5569 | 15![[thin space (1/6-em)]](https://www.rsc.org/images/entities/char_2009.gif) 080 080 |
| R (int) | 0.0363 | 0.2354 |
| GooF | 1.059 | 1.426 |
| Flack parameter | 0.02(2) | 0.12(5) |
| R 1 [I > 2σ(I)]a | 0.0409 | 0.1496 |
| wR2 (all data)b | 0.1129 | 0.3181 |
| Largest diff. peak and hole/Å−3 | 0.799 and −0.274 | 1.157 and −0.947 |
Acknowledgements
Financial support by the DFG (Priority Program SPP 1928 “COORNETs”) is gratefully acknowledged.Notes and references
- (a) J. Liu, L. Chen, H. Cui, J. Zhang, L. Zhang and C.-Y. Su, Chem. Soc. Rev., 2014, 43, 6011 RSC; (b) K. Leus, Y.-Y. Liu and P. Van Der Voort, Catal. Rev.: Sci. Eng., 2014, 56, 1 CrossRef CAS; (c) P. Silva, S. M. F. Vilela, J. P. C. Tomé and F. A. A. Paz, Chem. Soc. Rev., 2015, 44, 6774 RSC.
- (a) J. Ren, H. W. Langmi, B. C. North and M. Mathe, Int. J. Energy Res., 2015, 39, 607 CrossRef CAS; (b) D. Banerjee, A. J. Cairns, J. Liu, R. K. Motkuri, S. K. Nune, C. A. Fernandez, R. Krishna, D. M. Strachan and P. K. Thallapally, Acc. Chem. Res., 2015, 48, 211 CrossRef CAS PubMed; (c) H. Furukawa, K. E. Cordova, M. O'Keeffe and O. M. Yaghi, Science, 2013, 341, 974 CrossRef CAS PubMed.
- M. Giménez-Marqués, T. Hidalgo, C. Serre and P. Horcajada, Coord. Chem. Rev., 2016, 307, 342 CrossRef.
- (a) L. Wang, Y. Han, X. Feng, J. Zhou, P. Qi and B. Wang, Coord. Chem. Rev., 2016, 307, 361 CrossRef CAS; (b) M. R. Ryder and J.-C. Tan, Mater. Sci. Technol., 2014, 30, 13a CrossRef.
- A. Schneemann, V. Bon, I. Schwedler, I. Senkovska, S. Kaskel and R. A. Fischer, Chem. Soc. Rev., 2014, 43, 6062 RSC.
- (a) C. R. Murdock, B. C. Hughes, Z. Lu and D. M. Jenkins, Coord. Chem. Rev., 2014, 258–259, 119 CrossRef CAS; (b) G. Férey, Chem. Soc. Rev., 2008, 37, 191 RSC.
- SciFinder, American Chemical Society, 2016.
- PubMed, National Center for Biotechnology Information, U.S. National Library of Medicine.
- Web of Science, Thomson Reuters, 2015.
- B. Mu, F. Li, Y. Huang and K. S. Walton, J. Mater. Chem., 2012, 22, 10172 RSC.
- D. L. Reger, A. Leitner, P. J. Pellechia and M. D. Smith, Inorg. Chem., 2014, 53, 9932 CrossRef CAS PubMed.
- (a) L. Ma, C. Abney and W. Lin, Chem. Soc. Rev., 2009, 38, 1248 RSC; (b) J. D. Evans and F.-X. Coudert, J. Am. Chem. Soc., 2016, 138, 6131 CrossRef CAS PubMed; (c) T. Sawano, P. Ji, A. R. McIsaac, Z. Lin, C. W. Abney and W. Lin, Chem. Sci., 2015, 6, 7163 RSC.
- (a) Y. Cui, B. Li, H. He, W. Zhou, B. Chen and G. Qian, Acc. Chem. Res., 2016, 49(3), 483 CrossRef CAS PubMed; (b) M. Zhang, X. Chen, J. Zhang, J. Kong and L. Yuan, Chirality, 2016, 28(4), 340 CrossRef CAS PubMed.
- (a) O. R. Evans and W. B. Lin, Acc. Chem. Res., 2002, 35, 511 CrossRef CAS PubMed; (b) C. Wang, T. Zhang and W. Lin, Chem. Rev., 2012, 112, 1084 CrossRef CAS PubMed.
- (a) C.-L. Chang, X.-Y. Qi, J.-W. Zhang, Y.-M. Qiu, X.-J. Li, X. Wang, Y. Bai, J.-L. Sun and H.-W. Liu, Chem. Commun., 2015, 51, 3566 RSC; (b) Z. Chen, X. Liu, C. Zhang, Z. Zhang and F. Liang, Dalton Trans., 2011, 40, 1911 RSC.
- L. Que and W. B. Tolman, Nature, 2008, 455, 333 CrossRef CAS PubMed.
- L. Jian, C. Chen, F. Lan, S. Deng, W. Xiao and N. Zhang, Solid State Sci., 2011, 13, 1127 CrossRef CAS.
- D. Jiang, T. Mallat, F. Krumeich and A. Baiker, J. Catal., 2008, 275, 390 CrossRef.
- D. Jiang, T. Mallat, D. M. Meier, A. Urakawa and A. Baiker, J. Catal., 2010, 270, 26 CrossRef CAS.
- N. T. S. Phan, P. H. L. Vu and T. T. Nguyen, J. Catal., 2013, 306, 38 CrossRef CAS.
- (a) S. Marx, W. Kleist and A. Baiker, J. Catal., 2011, 281, 76 CrossRef CAS; (b) F. X. Llabres i Xamena, O. Casanova, R. Galiasso Tailleur, H. Garcia and A. Corma, J. Catal., 2008, 255, 220 CrossRef CAS; (c) S. Wang, L. Li, J. Zhang, X. Yuan and C.-Y. Su, J. Mater. Chem., 2011, 21, 7098 RSC.
- C. Huang, J. Wu, C. Song, R. Ding, Y. Qiao, H. Hou, J. Chang and Y. Fan, Chem. Commun., 2015, 51, 10353 RSC.
- (a) P.-Q. Liao, C.-T. He, D.-D. Zhou, J.-P. Zhang and X.-M. Chen, in The Chemistry of Metal–Organic Frameworks: Synthesis, Characterization and Applications, ed. S. Kaskel, Wiley, Weinheim, Germany, 2016, ch. 11, pp. 309–343 Search PubMed; (b) C. Pettinari, A. Tăbăcaru and S. Galli, Coord. Chem. Rev., 2016, 307, 1–31 CrossRef CAS; (c) J.-P. Zhang, Y.-B. Zhang, J.-B. Lin and X.-M. Chen, Chem. Rev., 2012, 112, 1001 CrossRef CAS PubMed.
- M. Grzywa, C. Geßner, B. Bredenkötter, D. Denysenko, J. van Leusen, P. Kögerler, E. Klemm and D. Volkmer, Dalton Trans., 2014, 43, 16846 RSC.
- D. Denysenko, M. Grzywa, J. Jelic, K. Reuter and D. Volkmer, Angew. Chem., Int. Ed., 2014, 53, 5832 CrossRef CAS PubMed.
- M. Grzywa, C. Geßner, D. Denysenko, B. Bredenkötter, F. Gschwind, K. M. Fromm, W. Nitek, E. Klemm and D. Volkmer, Dalton Trans., 2013, 42, 6909 RSC.
- (a) J.-X. Zhang, T.-T. Yan, J.-F. Kou, W.-H. Zhang and G. Yang, Z. Naturforsch., B: J. Chem. Sci., 2015, 70, 59 CAS; (b) A. Tăbăcaru, C. Pettinari, I. Timokhin, F. Marchetti, F. Carrasco-Marín, F. J. Maldonado-Hódar, S. Galli and N. Masciocchi, Cryst. Growth Des., 2013, 13, 3087 CrossRef.
- J.-H. Wang, M. Li and D. Li, Chem. – Eur. J., 2014, 20, 12004 CrossRef CAS PubMed.
- J. P. Freeman and J. F. Hansen, J. Chem. Soc., Chem. Commun., 1972, 961 RSC.
- A. L. Spek, J. Appl. Crystallogr., 2003, 36, 7 CrossRef CAS.
- W. M. Haynes, Handbook of Chemistry and Physics, CRC Press, Cleveland, 2013 Search PubMed.
- V. A. Blatov, IUCr CompComm Newsletter, 2006, vol. 7, pp. 4–38 Search PubMed.
- Y. Tanaka, T. Kojima, Y. Takata, A. Chainani, S. W. Lovesey, K. S. Knight, T. Takeuchi, M. Oura, Y. Senba, H. Ohashi and S. Shin, Phys. Rev. B: Condens. Matter Mater. Phys., 2010, 81, 144104 CrossRef.
- J. C. Wojdeł, M. A. Zwijnenburg and S. T. Bromley, Chem. Mater., 2006, 18, 1464 CrossRef.
- H. V. R. Dias and H.-L. Lu, Inorg. Chem., 1995, 34, 5380 CrossRef CAS.
- H. V. R. Dias and H.-J. Kim, Organometallics, 1996, 15, 5374 CrossRef CAS.
- K. Fujisawa, T. Ono, Y. Ishikawa, N. Amir, Y. Miyashita, K. Okamoto and N. Lehnert, Inorg. Chem., 2006, 45, 1698 CrossRef CAS PubMed.
- L. Y. Fager and J. O. Alben, Biochemistry, 1972, 11, 4786 CrossRef CAS PubMed.
- (a) F. G. Mutti, M. Gullotti, L. Casella, L. Santagostini, R. Pagliarin, K. K. Andersson, M. F. Iozzi and G. Zoppellaro, Dalton Trans., 2011, 40, 5436 RSC; (b) C. Di Nicola, Y. Y. Karabach, A. M. Kirillov, M. Monari, L. Pandolfo, C. Pettinari and A. J. L. Pombeiro, Inorg. Chem., 2007, 46, 221 CrossRef CAS PubMed.
- (a) M. C. Biesinger, L. W. M. Lau, A. R. Gerson and R. St. C. Smart, Appl. Surf. Sci., 2010, 257, 887 CrossRef CAS; (b) C. Huang, J. Wu, C. Song, R. Ding, Y. Quiao, H. Hou, J. Chang and Y. Fan, Chem. Comm., 2015, 51, 10353 RSC; (c) A. S. Duke, E. A. Dolgopolova, R. P. Galhenage, S. C. Ammal, A. Heyden, M. D. Smith, D. A. Chen and N. B. Shustova, J. Phys. Chem. C, 2015, 119, 27457 CrossRef CAS.
- E. S. Shpiro, W. Grünert, R. W. Joyner and G. N. Baeva, Catal. Lett., 1994, 24, 159 CrossRef CAS.
- (a) Y. Cui, Y. Yue, G. Qian and B. Chen, Chem. Rev., 2012, 112, 1126 CrossRef CAS PubMed; (b) K. Fujisawa, Y. Ishikawa, Y. Miyashita and K. Okamoto, Inorg. Chim. Acta, 2010, 363, 2977 CrossRef CAS; (c) H. V. R. Dias, H. V. K. Diyabalanage, M. G. Eldabaja, O. Elbjeirami, M. A. Rawashdeh-Omary and M. A. Omary, J. Am. Chem. Soc., 2005, 127, 7489 CrossRef CAS PubMed; (d) Q. Xiao, J. Zheng, M. Li, S.-Z. Zhan, J.-H. Wang and D. Li, Inorg. Chem., 2014, 53, 11604 CrossRef CAS PubMed.
- (a) N. Armaroli, G. Accorsi, F. Cardinali and A. Listorti, in Curr Chem, ed. V. Balzani and S. Campagna, Springer-Verlag, Berlin Heidelberg, Germany, 2007, vol. 280, pp. 69–115 Search PubMed; (b) P. C. Ford, W. Cariati and J. Bourassa, Chem. Rev., 1999, 99, 3625 CrossRef CAS PubMed.
- J. He, Y.-G. Yin, T. Wu, D. Li and X.-C. Huang, Chem. Comm., 2006, 2845 RSC.
- C. V. Hettiarachchi, M. A. Rawashdeh-Omary, D. Korir, J. Kohistani, M. Yousufuddin and H. V. R. Dias, Inorg. Chem., 2013, 52, 13576 CrossRef CAS PubMed.
- L. Hou, W.-J. Shi, Y.-Y. Wang, H.-H. Wang, L. Cui, P.-X. Chen and Q.-Z. Shi, Inorg. Chem., 2011, 50, 261 CrossRef CAS PubMed.
- J.-X. Zhang, J. He, Y.-G. Yin, M.-H. Hu, D. Li and X.-C. Huang, Inorg. Chem., 2008, 47, 3471 CrossRef CAS PubMed.
- APEX2 Version 2011.6, Bruker AXS Inc Search PubMed.
- SAINT Version 8.32B, Bruker AXS Inc., 2013 Search PubMed.
- XL Version 2013/3, G. M. Sheldrick, Acta Crystallogr., Sect. A: Found. Crystallogr., 2008, 64, 112 CrossRef CAS PubMed.
Footnote |
| † Electronic supplementary information (ESI) available: Ortep-style plot of the asymmetric units; topology analysis; XRPD patterns of lp- and np-CFA-9; and IR spectrum and gas sorption measurements of CFA-9. CCDC 1488850 and 1488851. For ESI and crystallographic data in CIF or other electronic format see DOI: 10.1039/c6ce01594h |
| This journal is © The Royal Society of Chemistry 2016 |

