 Open Access Article
Creative Commons Attribution 3.0 Unported Licence
Crystal structure and phase transitions of a layered perovskite-like CsScF4 crystal†
A. S.
Krylov
*a,
M. S.
Molokeev
ab,
S. V.
Misyul
c,
S. N.
Krylova
a,
A. S.
Oreshonkov
ac,
A. A.
Ivanenko
a,
V. A.
Zykova
d,
Y. N.
Ivanov
a,
A. A.
Sukhovsky
a,
V. N.
Voronov
a,
I. N.
Safonov
c and
A. N.
Vtyurin
ac
aL.V. Kirensky Institute of Physics, SB RAS, 660036, Krasnoyarsk, Russia. E-mail: shusy@iph.krasn.ru
bDepartment of Physics, Far Eastern State Transport University, 680021, Khabarovsk, Russia
cInstitute of Engineering Physics and Radioelectronics, Siberian Federal University, 660041, Krasnoyarsk, Russia
dInstitute of Automation and Electrometry, SB RAS, 630090, Novosibirsk, Russia
First published on 12th September 2016
Abstract
This work is devoted to the complex research on temperature phase transitions in a CsScF4 crystal. The crystal structure was solved and refined at different temperatures by using the Rietveld method. Structural phase transitions were investigated by using the following spectroscopic methods, some of them for the first time: Brillouin spectroscopy, Raman spectroscopy, IR absorption spectroscopy and NMR. The symmetry analysis of the Brillouin zone center of all phases is presented. The vibrational spectra of the crystal in three phases have been calculated. The structural phase transition mechanism was determined. The transitions at T1 = 475 K and T2 = 317.5 K are of displacement type. The Raman soft modes have been associated with rotations of the ScF6 octahedral group.
1 Introduction
The crystals whose high symmetry phase belongs to the space group D14h-P4/mmm have been under intense scrutiny in recent few years. Among them, the layered perovskite-like compounds with a TlAlF4-type structure are remarkable for retaining the infinite chains of vortex-sharing octahedra as an essential feature of the perovskite structure. Several compounds of the series exhibit phase transitions (PT) to a superconductive state, for example, Tl–Ca–Ba–Cu–O compounds containing constituents with a high-temperature superconductive phase.1,2ABX4 crystals with a TlAlF4-type structure are known to have compounds where the A position is taken by zigzag polyethylene diammonium ions ([NH3(CH2)nNH3]+), essentially increasing the distances between the layers of connected octahedral groups BX6.3 The structure of such compounds was studied3 for chlorides with B = Mn, Cd, Cu and n = 2–5. Many of the mentioned compounds have sequences of phase transitions (see ref. 1 and 4–6). Earlier phase transitions in crystals of the MAlF4 family (M = Tl, K, Rb, NH4) were studied by various techniques (Brillouin and ultrasonic,7,8 Raman,9,10 Raman under high hydrostatic pressure,11,12 neutron scattering,13 group theory,14 Monte Carlo simulation15). Sc-containing layered perovskites have not been widely studied. Indeed, some of the Sc-containing layered perovskites have interesting physical properties such as surprisingly large negative thermal expansion coefficients which exist over a wide range of temperatures.16–18
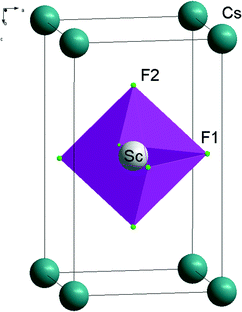
Symmetry and crystallographic analyses of phase transition sequences in layered TlAlF4-type crystals were better described in ref. 5 where it was pointed out that such structures realize mostly rotary distortions or pivot-type distortions caused by the rotation of octahedral groups BX6. The order parameters (OP) corresponding to librational vibrations of the octahedra are transformed according irreducible representations (IR) of M (k18) and X (k15) boundary points of the Brillouin zone of the D14h-P4/mmm group (denotations according to ref. 19 and 20). Distortions associated with condensation of librational modes of M and X points are denoted in ref. 5 as distortions of ϕ and ψ types. Irreducible representations and order parameters inducing symmetry changes are commonly referred to as critical or primary (Fig. 1).
However, in some cases, distortion of the initial phase structure cannot be described by the critical order parameters only. In the distorted (disymmetric) phase, shifts or ordering of atoms should be consistent with the symmetry of this phase and determined by non-critical (secondary) order parameters and irreducible representations. The entire totality of order parameters – critical and noncritical – occurring during phase transition forms a complete order parameter condensate.21 Group theory analysis5 of the complete order parameter condensate in crystals with a P4/mmm parent phase showed that critical distortions of ϕ and ψ types could be accompanied by noncritical distortions of octahedral groups and noncritical shifts of atoms located between the layers of octahedral groups. Such shifts and distortions are of a secondary nature and could be rather small in the proximity of the phase transition points.
The phase transition sequence in a CsScF4 crystal was studied by optical, calorimetric, X-ray and Raman scattering methods.6,22 It was found6 to undergo two phase transitions under decreasing temperature; the respective temperatures and basic thermodynamic characteristics are given in Table 1. The experimental data6,22 gave grounds to make the following conclusions: 1) both phase transitions in CsScF4 are of displacement type, 2) the phase transition from G0 to G1 is of the first order and that from G1 to G2 is of the second order, and 3) distortions are of the form (00Ψz) at phase transition G0 → G1 and (Φ1Φ2Ψz) at phase transition G1 → G2.
| G2 | G1 | G0 | |
|---|---|---|---|
| PT temperature, K | 317.5 | 475 | |
| Change in the entropy ΔS/R at PT | 0.21 | 0.16 | |
| Change in the entropy δS/R at PT | 0 | 0.11 | |
| Space group | D 132h-Pmmm | D 54h-P4/mbm | D 14h-P4/mmm |
| Z | 4 | 2 | 1 |
| T exp, K | 200 | 400 | 500 |
| Cell parameters | |||
| a i | 2a0 | a 0 + b0 | a 0 |
| 7.944 | 5.662 | 4.025 | |
| b i | 2b0 | −a0 + b0 | b 0 |
| 7.956 | 5.662 | 4.025 | |
| c i | c 0 | c 0 | c 0 |
| 6.763 | 6.814 | 6.822 |
However, these conclusions about the form of distortions at the phase transitions were based on indirect data. Besides, the temperature dependence of superstructure reflections occurring in the monoclinic phase which could not be explained by the rotations of octahedral groups only is conspicuous.6
To answer the arising questions, experimental Raman scattering, nuclear magnetic resonance and X-ray diffraction studies of the CsScF4 crystal have been carried out over a broad temperature range including phase transition temperatures. To interpret the results of the studies, the phase transition sequence was described within the thermodynamic approach.
2 Experimental
A clear and transparent CsScF4 crystal was grown by using the Bridgman method in a platinum ampoule. The grown crystal had an ideal basal plane of (001)0.At room temperature, CsScF4 single crystals have multiple twins, and therefore, the powder X-ray diffraction (XRD) data were obtained using a Bruker D8 ADVANCE Bragg–Brentano diffractometer with Cu-Kα radiation. The beam was controlled by a 0.6 mm fixed divergence slit, a 6 mm receiving VANTEC slit and Soller slits. Low- and high-temperature measurements were carried out using an Anton Paar TTK450 attachment.
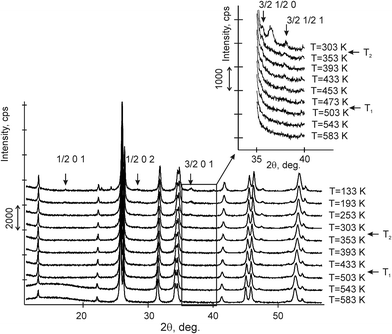
The variable counting time (VCT) and step size (VSS) schemes were used to collect the diffraction data.23–26 The total experimental time was 5 hours. There were 10 such experiments performed at different temperatures from 133 to 583 K (Fig. 2).
X-ray analysis of the CsScF4 structure at room temperature showed that the grown crystals were free from any impurities. The main structural reflections were found to coincide with the orthorhombic symmetry suggested in ref. 5 and 34.
Raman spectra in a backscattering geometry were recorded in a subtractive dispersion mode using a Horiba Jobin Yvon T64000 triple spectrometer equipped with a liquid nitrogen cooled charge coupled device detection system. A Spectra-Physics Stabilite Ar+ ion laser 2017 with λ = 514.5 nm and 5 mW power on the sample was used as an excitation light source.
Temperature measurements were carried out using a closed cycle ARS CS204-X1.SS helium cryostat in the temperature range of 10–295 K. The temperature was monitored by using a LakeShore DT-6SD1.4L silicon diode. During experiments, the cryostat was evacuated to 10−6 mbar. To investigate the low-wavenumber spectra, measurements down to 6 cm−1 were performed in a subtractive dispersion mode. Deformation of the low-wavenumber spectral edge by the optical slit, which sometimes smears the true features of the low-wavenumber spectra, was carefully eliminated by rigorous optical alignment. The CCD pixel coverage in an additive dispersion mode was as fine as 0.3 cm−1, but it was limited by the spectrometer spectral resolution of 1.8 cm−1.
The temperature experiments were carried out in a dynamic mode varying the sample temperature at the rate of 0.5 K min−1. The uncertainty of the measured temperature for a given rate can be estimated as the difference between the adjacent measurements and it was ±0.12 K in one spectrum measurement. The overall time for a single spectrum accumulation was within 30 s. The spectra were acquired with a temperature step of 0.25 K. This measurement protocol was the same as described in ref. 27 and 28.
The high temperature (above 320 K) and polarized Raman experiments were carried out using a laser beam focused on the sample by a 50× Olympus LMPlanFl objective lens with a numerical aperture (NA) of 0.5. The power of the incident laser light was 5 mW on the sample. The scattered light was collected by the same objective lens in a backscattering geometry and analyzed using a polarizer and a λ-plate. The temperature of the samples was controlled by using a Linkam THMS600 microstat with the stability of <±0.2 K.
Infrared spectra were obtained in the temperature range from 15 to 300 K using a vacuum Vertex 80 spectrometer. A 3 × 3 mm and 50 μm thick crystal plate was used as a sample.
NMR studies of CsScF4 crystals were carried out on all magnetic nuclei in the crystal. NMR spectra of 19F, 45Sc and 133Cs nuclei were recorded using an AVANCE 300 pulse NMR spectrometer by Fourier spectroscopy (Larmor frequencies for 19F nuclei – 282.4 MHz, for 45Sc nuclei – 72.9 MHz, and for 133Cs nuclei – 39.4 MHz, the 90° pulse time was 2.9 μs for fluorine and about 1 μs for scandium and cesium).
The Brillouin scattering spectra were measured in a backscattering geometry using 3 + 3 pass Sandercock tandem Fabry–Perot interferometers.29 The distance between the interferometer mirrors was 5 mm corresponding to the free dispersion range of 30 GHz. The radiation source was a solid state 200 mW, 532 nm laser. The reference beam was isolated after reflection of the primary laser radiation from a thin glass plane and was used to adjust the spectrometer and stabilize its operation during measurements. After passing the glass plane, the characteristic laser radiation was directed by a prism (PR) (2 mm) onto the sample under study. An achromatic lens (L1) with a focal length of 150 mm both focused the radiation onto the sample and collected the scattered signal. The scattered radiation was focused on the input diaphragm of the spectrometer by a lens (L2) with a focal length of 400 mm. The sizes of the input and output diaphragms were 450 and 700 μm, respectively. The periscope mirrors M1 and M2 were used for vertical and horizontal adjustments to put the scattered radiation into the spectrometer.
3 Determination of crystal structures
Earlier5 it was supposed that the crystal has the phase transition sequence . We believe that these designations of irreducible representations (irrep) are incorrect. In reality, M3+ (k18t3) and X3+ (k15t3) irreps lead to distortion of the ScF6 octahedron (Fig. 3). The analysis shows that only M2+ (k18t5) and X2− (k15t8) lead to the rotation of the ScF6 octahedron (Fig. 3), so M2+ and X2− should be critical irreps instead. In addition, such a sequence of irreps agrees with the sequence of space groups,
  , found earlier.5
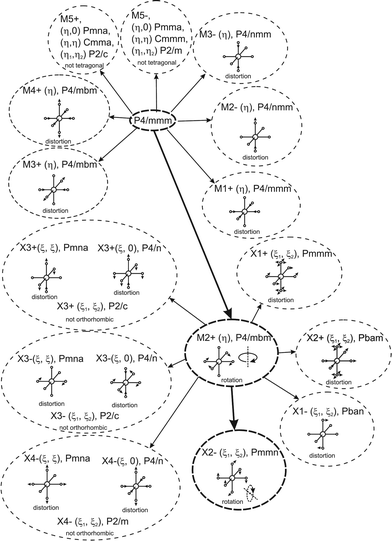 | ||
| Fig. 3 Group–subgroup graph with possible distortion of the ScF6 octahedron. Phase transitions allowing the rotation of the ScF6 octahedron are shown by a bold line. | ||
Comparison of powder diffraction data shows that the structure has changed at 460–475 K where superstructure peaks emerge corresponding to the M-point of the Brillouin zone (Fig. 2) and at T2 = 317.5 K where several superstructure peaks of the X-point of the Brillouin zone emerge. This confirms that the phase transition at T1 = 475 K is associated with the appearance of the order parameter (OP) of the M irreducible representation and the next phase transition at T2 = 317.5 K is associated with the OP of the X irreducible representation. As ScF6 can be rotated by M2+ and X2− only, it was decided to refine the crystal structure considering M2+ and X2− as critical irreducible representations.
The crystal structure of the low temperature phases was solved by distortion-mode refinement of the X-ray data using TOPAS 4.2 program, with the file generated by ISODISPLACE.30,31 Space groups P4/mbm and Pmmn were used. There are two OPs associated with all displacements of atoms, GM1+ (a) and M2+ (η), for the P4/mbm phase and nine OPs, GM1+ (a), M1+ (b), M2+ (η), and six OPs, X2− (ξ1, ξ2), for the Pmmn phase. M2+ acts on 2e sites occupied by F and leads to the rotation of the ScF6, while X2− acts on F sites and Cs sites. M1+ leads to distortion of the ScF6 octahedron. All the respective amplitudes were used to find a model structure by using the simulated annealing method. The refinement yielded satisfactory final R-factors (Table 3), interatomic distances as well as thermal parameters. The Rietveld difference plot of CsScF4 at 303 K is shown in Fig. 4. All other results within the range of 133–583 K are given in the ESI.† The thermal parameter of the Cs ion was refined in an anisotropic model. The atomic coordinates and isotropic thermal parameters can be found in Table 4 and the main bond lengths in Table 2. One can see that the thermal parameters increase evenly upon heating. This is indicative of the absence of any order–disorder process at phase transitions and proves the suggestion5 that the mechanisms of phase transitions have a displacive distortion nature. The difference between the lengths of Sc–F bonds is small (maximum 0.115 Å) and the F–Sc–F angles in the octahedron range within 87–93°. Thus, the ScF6 octahedron does not undergo strong distortions at phase transitions. This agrees with the earlier conclusions.5,22,32–34
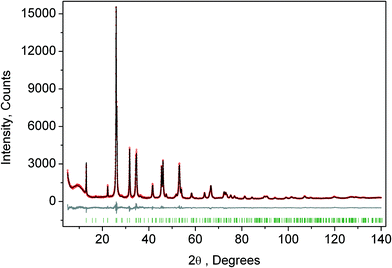 | ||
| Fig. 4 Rietveld difference plot of CsScF4 at 303 K (Pmmn phase). The other plot is presented in the ESI.† | ||
| Bond length | |
|---|---|
| T = 133 K, Pmmn | |
| Sc–F3 | 1.934(5) |
| Sc–F1 | 2.018(4) |
| Sc–F2 | 2.049(5) |
| Cs1–F3 | 3.07(1) |
| Cs1–F2 | 3.27(2) |
| Cs1–F3 | 3.30(1) |
| Cs2–F3 | 3.07(1) |
| Cs2–F3 | 3.29(1) |
| T = 193 K, Pmmn | |
| Sc–F3 | 1.935(4) |
| Sc–F1 | 2.026(4) |
| Sc–F2 | 2.034(4) |
| Cs1–F3 | 3.08(1) |
| Cs1–F2 | 3.29(1) |
| Cs1–F3 | 3.36(2) |
| Cs2–F3 | 3.06(1) |
| Cs2–F3 | 3.30(1) |
| T = 253 K, Pmmn | |
| Sc–F3 | 1.934(5) |
| Sc–F1 | 2.024(5) |
| Sc–F2 | 2.033(5) |
| Cs1–F3 | 3.10(2) |
| Cs1–F2 | 3.28(2) |
| Cs1–F3 | 3.41(3) |
| Cs2–F3 | 3.07(2) |
| Cs2–F3 | 3.30(2) |
| T = 303 K, Pmmn | |
| Sc–F3 | 1.926(4) |
| Sc–F1 | 2.017(4) |
| Sc–F2 | 2.022(5) |
| Cs1–F3 | 3.16(2) |
| Cs1–F2 | 3.22(2) |
| Cs1–F3 | 3.57(3) |
| Cs2–F3 | 3.15(2) |
| Cs2–F3 | 3.23(2) |
| T = 353 K, P4/mbm | |
| Sc–F2 | 1.914(4) |
| Sc–F1 | 2.023(6) |
| Cs–F2 | 3.196(2) |
| T = 393 K, P4/mbm | |
| Sc–F2 | 1.911(5) |
| Sc–F1 | 2.020(6) |
| Cs–F2 | 3.201(2) |
| T = 433 K, P4/mbm | |
| Sc–F2 | 1.902(2) |
| Sc–F1 | 2.020(6) |
| Cs–F2 | 3.209(2) |
| T = 503 K, P4/mmm | |
| Sc–F2 | 1.923(5) |
| Sc–F1 | 2.009(1) |
| Cs–F2 | 3.207(3) |
| T = 543 K, P4/mmm | |
| Sc–F2 | 1.913(5) |
| Sc–F1 | 2.013(1) |
| Cs–F2 | 3.217(2) |
| T = 583 K, P4/mmm | |
| Sc–F2 | 1.913(5) |
| Sc–F1 | 2.016(1) |
| Cs–F2 | 3.222(2) |
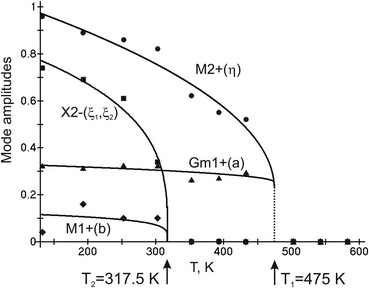
Complete mode details of distorted structures show the following temperature dependences of displacive mode amplitudes (Fig. 5). It is obvious that OP (η) of M2+ irrep is critical as it has maximal values. It emerges jumpwise at T1 = 475 K which accounts for a first order transition and increases upon further cooling. New critical OPs (η1, ξ2) appear at T2 = 317.5 K and increase rapidly upon cooling. GM1+ (a) and M1+ (b) are noncritical.
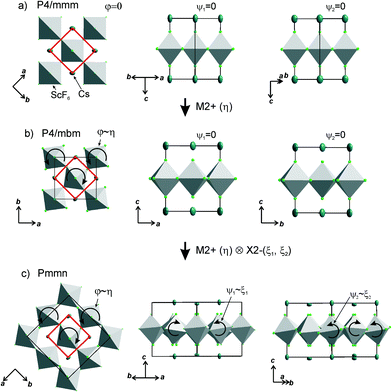
The primitive cell volume is doubled at the first phase transition  (Fig. 6). The cell parameters are transformed: a1 = a0 + b0; b1 = b0 − a0; c1 = c0 (a1, b1, and c1 are the basis vectors of the distorted P4/mbm phase, and a0, b0, and c0 are the basis vectors of the parent P4/mbm phase), and the origin shift is (1/2, 1/2, 0). The ScF6 octahedra with a common node are rotated on ϕ ∼ η in opposite directions. There are no other rotations or heavy atom displacement.
At the second phase transition  , the primitive cell volume increases 4 times. Position 1a occupied by Cs is split into two: Cs1 and Cs2. The cell parameters are transformed as follows: a2 = 2a0; b2 = 2b0; c2 = c0 (a2, b2, and c2 are the basis vectors of the distorted Pmmn phase, and a0, b0, and c0 are the basis vectors of the parent P4/mbm phase). The rotation on ϕ ∼ η goes on, and two new rotations appear: around the ā +
 ![[b with combining macron]](https://www.rsc.org/images/entities/i_char_0062_0304.gif) axis on angle ψ1 ∼ ξ1 and around the ā −
axis on angle ψ1 ∼ ξ1 and around the ā − ![[b with combining macron]](https://www.rsc.org/images/entities/i_char_0062_0304.gif) axis on angle ψ2 ∼ ξ2 (Fig. 6). The new OPs (ξ1, ξ2) make the Cs1 and Cs2 atoms move along the c axis.
axis on angle ψ2 ∼ ξ2 (Fig. 6). The new OPs (ξ1, ξ2) make the Cs1 and Cs2 atoms move along the c axis.
A detailed analysis of the OP and irreps in the program ISOTROPY30 shows that M2+ (η) and X2− (ξ1, ξ2) induce the phase transition that could be a second order phase transition. In fact, the phase transition at T1 = 475 K is of a first order type, and at T2 = 317.5 K, it is of a second order type.5,22,32–34
4 Vibrational spectroscopy
4.1 The selection rules
To describe the results of the Raman and infrared experiments, we performed a symmetry analysis of the vibrational modes in all phases. The selection rules, classification of modes, Wyckoff positions, irreducible representations and Raman tensors for all three phases are presented in Table 5. The fractional atomic coordinates are taken from Table 4. The Raman mode representation for the tetragonal phase P4/mbm at temperatures above 475 K at the Brillouin zone center is| ΓRaman = A1g + Eg | (1) |
| ΓIR = 3A2u + 4Eu | (2) |
| ΓRaman = 2A1g + B1g + B2g + 3Eg | (3) |
| ΓIR = 3A2u + 7Eu | (4) |
| ΓRaman = 9Ag + 5B1g + 8B2g + 8B3g | (5) |
| ΓIR = 11B1u + 10B2u + 10B3u | (6) |
4.2 Raman and IR
To analyze the low wavenumber Raman spectra quantitatively, we performed a spectral analysis with a combination of conventional damped harmonic oscillator functions:35,36 | (7) |
 | (8) |
 | (9) |
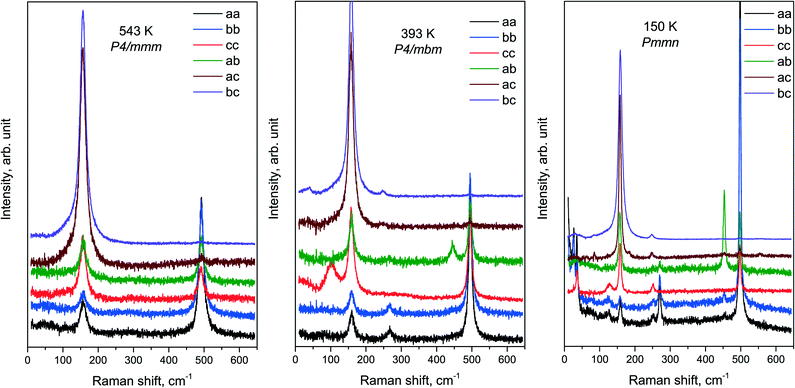
The high symmetry phase studied earlier using Raman spectra32 exhibits two vibrations in the spectrum: at 495 cm−1 (A1g) and 152 cm−1 (Eg) just as was predicted by the selection rules (Table 5). The experimental Raman data, numerical simulation and normal vibrational mode representations for the P4/mbm phase are given in Table 8. These vibrations are the vibrations of axial fluorine atoms. After the first phase transition, vibrations emerge mostly because of the restructuring of the Brillouin zone; as a result, part of the vibrations from the M point become Raman-active. We observe seven vibrations: 32 cm−1 (Eg), 107 cm−1 (A1g), 152 cm−1 (Eg), 188 cm−1 (B1g), 233 cm−1 (Eg), 255 cm−1 (B2g), 495 cm−1 (A1g). These vibrations are not associated with vibrations of heavy ions but for vibrations of fluorine ions only (Table 5). The experimental Raman data, numerical simulation and normal vibrational mode representations for the P4/mbm phase can be found in Table 9.
An overview of the experimental spectra of all components of the Raman tensor in all phases is shown in Fig. 7. The temperatures of the spectra in the figure were chosen rather far from the phase transition points. The spectra of the intermediate phase P4/mbm at 393 K are in fairly good agreement with the ones previously published.32
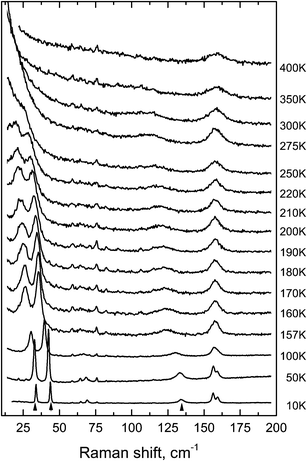
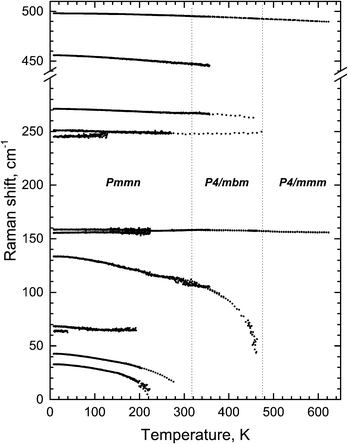
The condensation of soft modes after both phase transitions is the most significant observed result, which is presented in Fig. 8. The plot showing the dependence of wavenumber vs. temperature is shown in Fig. 9. The Raman spectra include several modes demonstrating soft mode behavior: one (Eg 33 cm−1 at 393 K) below the first phase transition at T1 = 478 K and two (Ag 37 cm−1 and 56 cm−1 at 193 K) below the second phase transition at T1 = 317.5 K. These data are in good agreement with the conclusion based on the XRD experiments. The results of empirical vibrational spectra simulation show that these soft modes correspond to rotations of the ScF6 octahedral group (see Table 10).
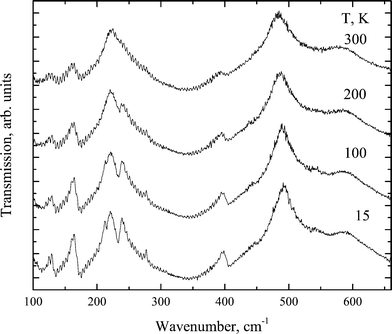
The transformation of the IR spectra at temperatures below 700 cm−1 is shown in Fig. 10. Table 6 compares the experimental and calculated data for a crystal in the Pmmn phase.
4.3 Vibrational spectra simulation
The lattice dynamics of CsScF4 in all phases was simulated in terms of the Born–Karman model using LADY software.37,38 Within this model, only pair-wise interactions and bond-stretching force constants are considered. A simplified version of the Born–Karman model implies that the bond-stretching force constant A depend on R only (R is the bond length), and the A(R) dependences are the same for all atom pairs: | (10) |
| T, K | Sp. gr. | a i , Å | b i , Å | c i , Å | V, Å3 | Z | R wp, % | R B, % |
|---|---|---|---|---|---|---|---|---|
| 133 | Pmmn | 7.9561(5) | 7.9545(5) | 6.7557(3) | 427.55(5) | 4 | 6.26 | 1.89 |
| 193 | Pmmn | 7.9663(5) | 7.9630(4) | 6.7668(3) | 429.25(4) | 4 | 5.35 | 1.50 |
| 253 | Pmmn | 7.9783(5) | 7.9748(5) | 6.7814(3) | 431.46(4) | 4 | 5.84 | 1.52 |
| 303 | Pmmn | 7.9878(5) | 7.9832(4) | 6.7936(2) | 433.21(4) | 4 | 4.43 | 1.41 |
| 353 | P4/mbm | 5.6538(2) | 6.8076(3) | 217.60(1) | 2 | 5.97 | 1.55 | |
| 393 | P4/mbm | 5.6601(2) | 6.8135(3) | 218.28(2) | 2 | 5.50 | 1.37 | |
| 433 | P4/mbm | 5.6667(2) | 6.8180(3) | 218.94(2) | 2 | 6.21 | 1.62 | |
| 503 | P4/mmm | 4.0175(1) | 6.8226(3) | 110.117(9) | 1 | 5.91 | 1.82 | |
| 543 | P4/mmm | 4.0260(1) | 6.8233(3) | 110.599(9) | 1 | 4.94 | 1.91 | |
| 583 | P4/mmm | 4.0317(2) | 6.8282(4) | 110.99(1) | 1 | 5.15 | 2.03 |
| x | y | z | Biso, Å2 | |
|---|---|---|---|---|
| T = 133 K, Pmmn | ||||
| Cs1 | 1/4 | 1/4 | −0.0285(5) | 2.5(1)* U11 = 0.054(4), U22 = 0.020(4), U33 = 0.020(3) |
| Cs2 | 1/4 | 3/4 | −0.001(2) | 2.6(1)* U11 = 0.023(4), U22 = 0.020(4), U33 = 0.055(4) |
| Sc | 0 | 0 | 1/2 | 1.4(1) |
| F1 | 1/4 | 0.540(3) | 0.515(3) | 1.9(2) |
| F2 | 0.044(3) | 1/4 | 0.552(3) | 1.9(2) |
| F3 | 0.491(2) | 0.469(2) | 0.2164(6) | 1.9(2) |
| T = 193 K, Pmmn | ||||
| Cs1 | 1/4 | 1/4 | −0.0259(5) | 3.0(1)* U11 = 0.069(3), U22 = 0.020(4), U33 = 0.025(3) |
| Cs2 | 1/4 | 3/4 | −0.004(2) | 3.0(1)* U11 = 0.027(3), U22 = 0.020(4), U33 = 0.067(3) |
| Sc | 0 | 0 | 1/2 | 1.7(1) |
| F1 | 1/4 | 0.546(3) | 0.515(3) | 2.4(2) |
| F2 | 0.032(3) | 1/4 | 0.549(3) | 2.4(2) |
| F3 | 0.493(2) | 0.471(2) | 0.2162(6) | 2.4(2) |
| T = 253 K, Pmmn | ||||
| Cs1 | 1/4 | 1/4 | −0.0224(8) | 3.5(2)* U11 = 0.074(5), U22 = 0.020(5), U33 = 0.037(4) |
| Cs2 | 1/4 | 3/4 | −0.005(2) | 3.6(1)* U11 = 0.049(5), U22 = 0.020(5), U33 = 0.066(5) |
| Sc | 0 | 0 | 1/2 | 1.7(2) |
| F1 | 1/4 | 0.542(4) | 0.509(4) | 2.7(2) |
| F2 | 0.033(4) | 1/4 | 0.544(4) | 2.7(2) |
| F3 | 0.494(2) | 0.474(2) | 0.2166(6) | 2.7(2) |
| T = 303 K, Pmmn | ||||
| Cs1 | 1/4 | 1/4 | −0.0191(6) | 4.3(2)* U11 = 0.094(5), U22 = 0.020(4), U33 = 0.047(5) |
| Cs2 | 1/4 | 3/4 | 0.002(2) | 3.55(1)* U11 = 0.061(5), U22 = 0.020(4), U33 = 0.068(5) |
| Sc | 0 | 0 | 1/2 | 3.9(2) |
| F1 | 1/4 | 0.539(4) | 0.508(4) | 3.8(2) |
| F2 | 0.031(4) | 1/4 | 0.523(4) | 3.8(2) |
| F3 | 0.495(2) | 0.486(2) | 0.2170(5) | 3.8(2) |
| T = 353 K, P4/mbm | ||||
| Cs | 0 | 1/2 | 0 | 3.97(8)* U11 = U22 = 0.036(2), U33 = 0.078(2), U12 = 0.015(2) |
| Sc | 0 | 0 | 1/2 | 1.9(1) |
| F1 | 0.711(1) | 0.211(1) | 1/2 | 4.2(2) |
| F2 | 0 | 0 | 0.2189(7) | 4.2(2) |
| T = 393 K, P4/mbm | ||||
| Cs | 0 | 1/2 | 0 | 4.2(1)* U11 = U22 = 0.038(2), U33 = 0.084(2), U12 = −0.015(2) |
| Sc | 0 | 0 | 1/2 | 1.9(1) |
| F1 | 0.716(1) | 0.216(1) | 1/2 | 4.2(2) |
| F2 | 0 | 0 | 0.2195(7) | 4.2(2) |
| T = 433 K, P4/mbm | ||||
| Cs | 0 | 1/2 | 0 | 4.7(1)* U11 = U22 = 0.043(2), U33 = 0.091(2), U12 = 0.001(3) |
| Sc | 0 | 0 | 1/2 | 2.0(2) |
| F1 | 0.718(1) | 0.218(1) | 1/2 | 4.3(2) |
| F2 | 0 | 0 | 0.2211(8) | 4.3(2) |
| T = 503 K, P4/mmm | ||||
| Cs | 0 | 0 | 0 | 4.7(1)* U11 = U22 = 0.042(2), U33 = 0.094(2), U12 = 0.011(1) |
| Sc | 1/2 | 1/2 | 1/2 | 2.0(2) |
| F1 | 0 | 1/2 | 1/2 | 5.4(2) |
| F2 | 1/2 | 1/2 | 0.2182(8) | 5.4(2) |
| T = 543 K, P4/mmm | ||||
| Cs | 0 | 0 | 0 | 5.1(1)* U11 = U22 = 0.046(2), U33 = 0.101(2), U12 = 0.013(1) |
| Sc | 1/2 | 1/2 | 1/2 | 2.0(2) |
| F1 | 0 | 1/2 | 1/2 | 5.4(2) |
| F2 | 1/2 | 1/2 | 0.2196(7) | 5.4(2) |
| T = 583 K, P4/mmm | ||||
| Cs | 0 | 0 | 0 | 5.8(1)* U11 = U22 = 0.055(2), U33 = 0.112(2), U12 = 0.014(2) |
| Sc | 1/2 | 1/2 | 1/2 | 2.9(1) |
| F1 | 0 1/2 | 1/2 | 6.2(2) | |
| F2 | 1/2 | 1/2 | 0.2199(7) | 6.2(2) |
| Symm. type | Cacl. mode, cm−1 | IR, (133 K) experiment, cm−1 |
|---|---|---|
| B 1u | 8.0 | |
| B 2u | 8.37 | |
| B 3u | 8.8 | |
| B 1u | 11.9 | |
| B 2u | 12.1 | |
| B 3u | 12.9 | |
| B 2u | 82.96 | |
| B 3u | 85.1 | 110 |
| B 1u | 140.3 | 124 |
| B 3u | 142.7 | 127 |
| B 1u | 145.7 | |
| B 2u | 146.5 | |
| B 2u | 164.1 | |
| B 3u | 165.6 | |
| B 1u | 167.0 | |
| B 1u | 168.1 | |
| B 3u | 186.8 | |
| B 2u | 188.9 | |
| B 1u | 195.4 | |
| B 3u | 203.3 | |
| B 2u | 219.6 | |
| B 1u | 223.1 | 223 |
| B 1u | 270.9 | 249 |
| B 2u | 272.9 | |
| B 3u | 278.0 | |
| B 1u | 280.0 | 392 |
| B 2u | 503.4 | 436 |
| B 3u | 524.7 | 487 |
| B 3u | 609.1 | |
| B 2u | 609.4 | |
| B 1u | 610.1 | 587 |
| Bond | λ [aJ Å−1] | ρ [Å] |
|---|---|---|
| Cs–F | 24.45810 | 0.333473 |
| Sc–F1 | 199.2600 | 0.372764 |
| Sc–F2 | 329.0828 | 0.384075 |
| F1–F1 | 308.7130 | 0.378027 |
| F1–F2 | 332.7137 | 0.384993 |
| F2–F2 | 75.10116 | 0.349106 |
4.4 Brillouin light scattering
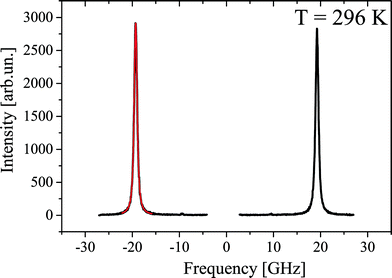
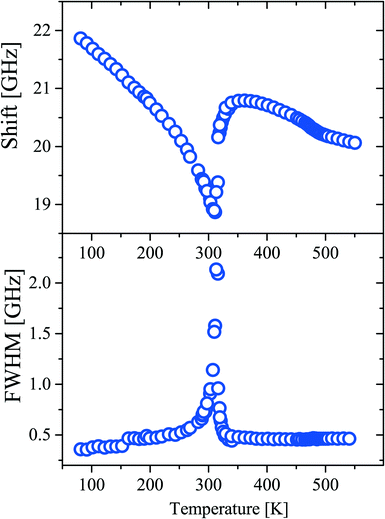
Fig. 11 shows a typical Brillouin scattering spectrum measured in the crystal under study at a temperature of 296 K. To define positions and linewidths, each of the Brillouin components is described by a Voigt function with a free Gauss parameter. A fitting example is given in Fig. 11 in red.Fig. 12 shows the experimentally obtained temperature dependences of the position and width (FWHM) of the Brillouin components. At ∼311 K, the temperature dependences of both parameters exhibit a distinctive feature indicating a phase transition. Such a behavior is typical for second order structural phase transitions. Another feature is observed as a kink at about 480 K. The magnitude of the effect is relatively small, but it allows us to confidently claim the existence of the first order phase transition. The lack of drastic changes in the elastic parameters of the material may be an indication of the lack of changes in the structure of the crystal lattice at this temperature. Such features take place in glass when additional degrees of freedom of molecules are defrosted during heating of the sample.
5 NMR
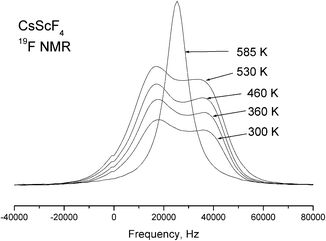
Temperature dependences of the 19F NMR spectra were experimentally studied with a single crystal sample in the temperature range of 290–585 K. With the external magnetic field oriented along the c-axis of the crystal, the NMR spectrum of 19F at room temperature consists of two lines of equal intensities. When the crystal is rotated around the a axis, one of these lines splits into two; the splitting is maximal when the magnetic field is normal to the c axis. This behavior leads to the conclusion that these lines belong to two magnetically nonequivalent fluorine atoms in the equatorial plane of the ScF6 octahedron. It is impossible to obtain parameter values of the chemical shielding tensors from orientation dependences of poorly resolvable NMR spectra of 19F; we can only suppose that they correspond to the polar and equatorial fluorine atoms. The obtained NMR spectra of 19F vary very little in the temperature range from 290 to 510 K, including both phase transitions. Taking into consideration the results of X-ray structural studies, such a result is quite expected, because the bond lengths of the ScF6 octahedron practically do not change in transitions, and accordingly, the parameters of magnetic shielding of fluorine atoms change insignificantly. As for the parameters of the dipole–dipole interaction (manifested, first of all, in the width of individual lines), their invariability is indicative of the lack of mobility of fluorine ions in the structure. However, the NMR 19F lines were found to broaden with further heating (above 510 K), and above 530 K, all the lines merge into a single line in the centroid of the 19F NMR spectrum; its width decreases with increasing temperature (Fig. 13). Such changes in the spectrum are typical of an exchange process, in this case the exchange between polar and equatorial fluorine atoms. The emergence of a single line corresponds to the frequency of exchange approximately equal to the line splitting value in the 19F NMR spectrum.Thus, the temperature dependence in Fig. 13 allows the exchange rate ν ∼ 104 Hz to be evaluated at T = 530 K. Further narrowing of the lines with increasing temperature is associated with diffusion of fluorine atoms over the crystal lattice sites.
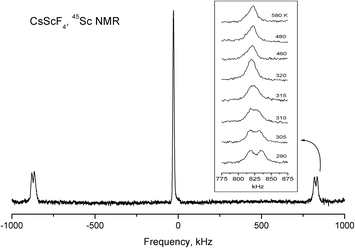
The spin of 45Sc and 133Cs nuclei is I = 7/2, and unlike the 19F nuclei, they have electric quadrupole moments. NMR makes it possible to obtain information about the value and symmetry of gradients of crystalline electric fields at the site of the nucleus under study. In the low-temperature phase, there is one structurally nonequivalent scandium atom (position 4d) in a unit cell. However, in general orientation, each of the seven components of the NMR spectrum of 45Sc splits into four lines. Consequently, in a unit cell of CsScF4, there are four magnetically nonequivalent positions of scandium ions. The analysis of orientation dependences of the NMR spectrum of 45Sc made it possible to find the three-axial tensor of the electric-field gradient (EFG) at the site of the scandium ion with the main value Vzz = 3.41 MHz and asymmetry parameter η ≈ 0.1. The principal axis Vzz of the EFG tensor is tilted from the c axis of the crystal by about 10° at room temperature (292 K). Under heating, the tilt angle gradually decreases, so does the asymmetry parameter, and at phase transition temperature T2 = 317 K, the EFG tensor becomes axially-symmetrical in compliance with the point symmetry of the scandium ion position (2b) in the intermediate phase. Fig. 14 shows temperature evolution of 45Sc NMR spectrum lines belonging to transition 3/2 ↔ 1/2. Over the entire temperature range of existence of the intermediate phase, the principal value of Vzz = 3.41 MHz of the axially symmetrical EFG tensor does not change (Fig. 14). This value does not change in the transition to the high-temperature phase (T1 = 475 K), either. Even though in this phase transition the point symmetry of the scandium position does not change and the distance to the nearest fluorine ions changes insignificantly, in the second coordination sphere, according to the X-ray results considerable changes occur which, in principle, should change the Vzz value. The absence of changes in the 45Sc NMR spectra indirectly proves the phase transition model ensuing from the Raman and X-ray data. The changes in the scandium spectrum related to very small structure variation should be very small.
In the low-temperature phase of CsScF4, there are two structurally nonequivalent cesium atoms and, accordingly, two three-axis EFG tensors on the Cs nuclei. As a cesium NMR line from each structurally and magnetically nonequivalent position of cesium splits into 7 components, the quadrupole splitting is not more than 20 kHz, and the tensor parameters are quite close, the resolution in the spectrum is insufficient to accurately define parameters of the said tensors and the tilt angle of their principal axis Vzz from the c axis of the crystal. The phase transition into the intermediate phase (T2 = 317 K) is clearly recorded by considerable simplification of the 133Cs NMR spectra. Analysis of orientation dependences helps to find one axially symmetrical EFG tensor with a principal value of Vzz = 20 kHz and the direction of the principal axis along the c axis. A further increase in temperature up to 510 K does not change the parameters of this tensor. The lack of changes in the cesium spectrum in the first phase transition (475 K) can be explained by the same reasons as in the scandium case, but here the situation is aggravated by much worse resolution associated with small quadrupole splitting.
Thus, the NMR studies on the whole confirm the phase transition model developed on the basis of these Raman scattering and X-ray structural studies. However, it should be noted that the spectra of none of the nuclei under study exhibit the first phase transition at T = 475 K. We assume this to be a consequence of specificity of structural changes taking place at this transition. An additional result is the exchange between equatorial and polar fluorine atoms found in NMR studies of 19F approximately 50 K above the first phase transition. The frequency of this exchange is found to be 20 kHz at 550 K and it increases with temperature.
6 Phase transition thermodynamic model
Critical one-dimensional IR of M2+ induces changes in the crystal symmetry at the phase transition of the first order5,6 and another phase transition of the second order is associated with OPs, transformed by two-dimensional IR of X2−. The free energy (FE) corresponding to these representations and describing phase transition sequences can be written as follows: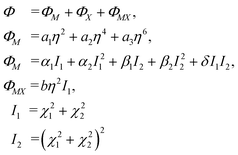 | (11) |
To describe phase transition of the first order, ΦM – part of the FE associated with one-dimensional IRs – is written up to the 6th power of the OP η. This ensues from the necessity of describing phase transition of the first order.46 For the same reason, we assume a2 < 0. The other – ΦX – part of FE is written up to the 8th power of the two-component OP (χ1, χ2), as this is the lowest power at which the emergence of all low-symmetry phases occurring in the experiments can be described.5,6
Two more restrictions on the TP coefficients are imposed by the conditions of the existence of global minimum: a3 > 0 and a3 > 0. A similar free energy but with expansion to the fourth power of η OP was considered in ref. 47. The given FE was analyzed and phase state diagrams were described in a standard manner similar to the one described in ref. 46 In the case of the CsScF4 crystal, the transition temperatures are apart from each other by more than 100 degrees, so in eqn (11) we leave the first term of expansion only.
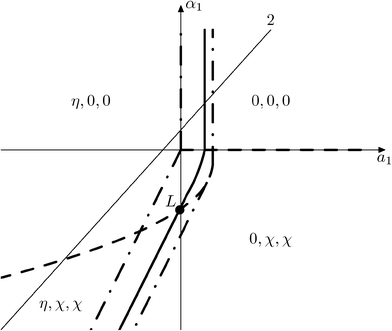
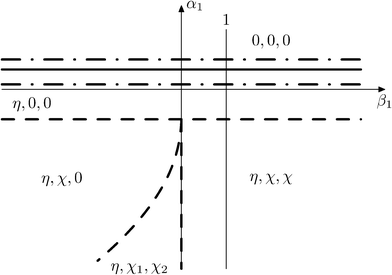
6.1 Possible types of phase diagrams
Fig. 15 and 16 show the obtained phase diagrams. First order phase transitions are shown by full lines and second order phase transitions by dashed ones; the dash-dotted lines are the boundaries of phase stability for the first order transitions. Thin full lines numbered 1 and 2 depict a thermodynamic path realized in the CsScF4 crystal. The temperatures of the observed phase transitions differ considerably, so the coefficient b from ΦMX should be nonzero and its sign determines the succession of transitions: for positive b, the first transition occurs in the phase with nonzero η, i.e. phase (η, 0, 0). Negative b results in the phase (0, χ, χ). The phase diagrams produced are shifted along a1 and α1 against the diagrams for non-interacting OP η and χ by the value proportional to coefficient b. It is possible to transit from phase (η, 0, 0) into (η, χ, χ) only when β1 > 0. For negative β1, phase (η, 0, 0) transits into phase (η, χ, 0). A more detailed examination of the diagram in Fig. 16 shows that the boundary (full line in Fig. 16) of the first order phase transition between phases (η, 0, 0) and (0, χ, χ) runs along the lineThe stability zone of the phase with OP (0, χ, χ) is restricted by the dash-dotted straight line from the origin of the coordinates in Fig. 16. Phases (η, 0, 0) and (η, χ, χ) are separated by the line of the second order transition a1 = α1(2ba2 − 3α1a3)/b2 (dashed line). Contrary to ref. 47, the boundary of phase (η, 0, 0) is described by a quadratic equation.  ;
;  . At the phase diagram, there exist a point L with the coordinates (η, 0, 0), (η, χ, χ) and (0, χ, χ) where three phases coexist.
7 Conclusions
We have found relationships between the coefficients of thermodynamic potential as a function of order parameters of one-dimensional M2+ and two-dimensional X2− irreducible representations which can occur in layered perovskite CsScF4. Expressions for phase boundaries have been accurately derived from the considered potential. Knowing the pattern of phase states, one can conceive how it changes under external influence of different kind which is necessary for a conscious choice of crystals and understanding possible impacts on them in some applications. The sequence of phase transitions has been reinvestigated:At the first phase transition, ScF6 octahedra rotate jumpwise by ϕ ∼ η that accounts for the first order transition. There are no other rotations or heavy atom displacements. At the second phase transition, two new rotations appeared: around the ā + ![[b with combining macron]](https://www.rsc.org/images/entities/i_char_0062_0304.gif) axis on angle ψ1 ∼ ξ1 and around the ā −
axis on angle ψ1 ∼ ξ1 and around the ā − ![[b with combining macron]](https://www.rsc.org/images/entities/i_char_0062_0304.gif) axis on angle ψ2 ∼ ξ2. Cs1 and Cs2 atoms move along the c axis at this second transition. The mechanisms of all phase transitions are of displacive distortion type. The results of vibrational spectroscopy and NMR studies all in all confirm this phase transition model developed on the basis of the XRD data and thermodynamic model.
axis on angle ψ2 ∼ ξ2. Cs1 and Cs2 atoms move along the c axis at this second transition. The mechanisms of all phase transitions are of displacive distortion type. The results of vibrational spectroscopy and NMR studies all in all confirm this phase transition model developed on the basis of the XRD data and thermodynamic model.
Acknowledgements
The authors are grateful to Prof. I. N. Flerov for valuable support and useful discussions. This work was partly supported by the Russian Foundation for Basic Research, Project 16-02-00102. The research is partially conducted within the framework of the state task of the Ministry of Education and Science of the Russian Federation for Siberian Federal University on R&D performance in 2014 (Task 3.2534.2014/K). X-ray data from powders, Raman NMR, and IR spectra were obtained with use the analytical equipment of Krasnoyarsk Center of collective use SB RAS.References
- K. S. Aleksandrov and J. Bartolome, Phase Transitions, 2001, 74, 255–336 CrossRef CAS.
- S. S. P. Parkin, V. Y. Lee, A. I. Nazzal, R. Savoy, R. Beyers and S. J. LaPlaca, Phys. Rev. Lett., 1988, 61, 750–753 CrossRef CAS PubMed.
- H. Arend, W. Huber, F. H. Mischgovsky and G. Richter, J. Cryst. Growth, 1978, 43, 213–223 CrossRef CAS.
- K. S. Aleksandrov and B. V. Beznosikov, Perovskites: Present and Future. Variety of Parent Phases, Phase Transitions, Possibilities of Synthesis of New Compounds, SB RAS, Novosibirsk, 2004 Search PubMed.
- K. S. Aleksandrov, B. V. Beznosikov and S. V. Misyul, Ferroelectrics, 1987, 73, 201–211 CrossRef CAS.
- I. N. Flerov, K. S. Aleksandrov, S. V. Melnikova, A. I. Kruglik, S. V. Misjul and B. V. Beznosikov, Ferroelectrics, 1989, 96, 175–179 CrossRef CAS.
- A. Bulou, M. Debiéche, J. Nouet, F. Ganot, C. Dugautier and P. Moch, Phase Transitions, 1991, 33, 99 CrossRef CAS.
- F. Ganot, M. Papin, A. Bulou and P. Moch, Ferroelectrics, 1991, 124, 321 CrossRef CAS.
- M. Papin, A. Bulou and J. Nouet, J. Phys.: Condens. Matter, 1993, 87, 232 Search PubMed.
- M. Couzi, P. L. Loyzance, R. Mokhlisse, A. Bulou and J. L. Fourquet, Phys. Chem. Chem. Phys., 1983, 87, 232 CAS.
- Q. Wang, G. Ripault and A. Bulou, Phase Transitions, 1995, 53, 1 CrossRef CAS.
- Q. Wang, A. Bulou and A. Desert, J. Phys.: Condens. Matter, 1995, 7, 825 CrossRef CAS.
- A. Bulou and J. Nouet, J. Phys. C: Solid State Phys., 1987, 20, 2885 CrossRef CAS.
- A. Bulou, M. Rousseau and B. Hennion, J. Phys.: Condens. Matter, 1989, 1, 4553 CrossRef CAS.
- E. Palacios-Lidón, E. Palacios, R. Burriel and A. Bulou, Ferroelectrics, 2002, 270, 387 CrossRef.
- B. K. Greve, K. L. Martin, P. L. Lee, P. J. Chupas, K. W. Chapman and A. P. Wilkinson, J. Am. Chem. Soc., 2010, 132, 15496 CrossRef CAS PubMed.
- C. W. Li, X. Tang, J. A. Munoz, J. B. Keith, S. J. Tracy, D. L. Abernathy and B. Fultz, Phys. Rev. Lett., 2011, 107, 195504 CrossRef PubMed.
- L. Hu, J. Chen, L. Fan, J. Deng, R. Yu and X. Xing, J. Am. Ceram. Soc., 2014, 97, 1009 CrossRef CAS.
- O. V. Kovalev, Irreducible Representations of the Space Groups, Routledge, 1965 Search PubMed.
- S. C. Miller and W. F. Love, Tables of Irreducible Representations of The Space Groups and Co-Representations of Magnetic Space Groups, Pruett Press Boulder, Colorado, 1967 Search PubMed.
- V. P. Sakhnenko, V. M. Talanov and G. M. Chechin, Fiz. Met. Metalloved., 1986, 62, 847–856 CAS.
- A. N. Vtyurin, A. S. Krylov, I. V. Shmygol and A. P. Shebanin, Phys. Solid State, 1997, 39, 632–633 CrossRef.
- I. C. Madsen and R. J. Hill, Adv. X-Ray Anal., 1992, 35, 39–47 Search PubMed.
- I. C. Madsen and R. J. Hill, J. Appl. Crystallogr., 1994, 27, 385–392 CrossRef CAS.
- W. I. F. David, Abstract P2.6, NIST Special Publication, 1992, vol. 846, p. 210 Search PubMed.
- Diffrac-Plus Basic XRD Wizard, Bruker AXS GmbH, Karlsruhe, Germany, 2002–2007 Search PubMed.
- A. S. Krylov, E. M. Merkushova, A. N. Vtyurin and L. I. Isaenko, Phys. Solid State, 2012, 54, 1275 CrossRef CAS.
- A. S. Krylov, E. M. Kolesnikova, L. I. Isaenko, S. N. Krylova and A. N. Vtyurin, Cryst. Growth Des., 2014, 14, 923 CAS.
- S. M. Lindsay, M. W. Anderson and J. R. Sandercock, Rev. Sci. Instrum., 1981, 52, 1478 CrossRef CAS.
- H. T. Stokes, D. M. Hatch and B. J. Campbell, ISOTROPY, 2007, stokes.byu.edu/isotropy.html Search PubMed.
- B. J. Campbell, H. T. Stokes, D. E. Tanner and D. M. Hatch, J. Appl. Crystallogr., 2006, 39, 607 CrossRef CAS.
- A. N. Vtyurin, A. Bulou, A. S. Krylov, I. V. Shmygol and K. S. Aleksandrov, J. Raman Spectrosc., 2000, 31, 151–155 CrossRef CAS.
- A. S. Krylov, I. V. Shmygol, A. P. Shebanin, A. N. Vtyurin and A. G. Ageev, Ferroelectrics, 1999, 233, 103 CrossRef CAS.
- I. N. Flerov, M. V. Gorev, J. Grannec and A. Tressaud, J. Fluorine Chem., 2002, 116, 9–14 CrossRef CAS.
- L. H. Hoang, N. T. M. Hien, W. S. Choi, Y. S. Lee, K. Taniguchi, T. Arima, S. Yoon, X. B. Chen and I.-S. Yang, J. Raman Spectrosc., 2010, 41, 1005 CrossRef CAS.
- V. K. Malinovsky, A. M. Pugachev and N. V. Surovtsev, Phys. Solid State, 2008, 50, 1137 CrossRef CAS.
- M. B. Smirnov and V. Yu. Kazimirov, LADY: software for lattice dynamics simulations, JINR communications, E 14-2001-159, 2001 Search PubMed.
- M. B. Smirnov, A. P. Mirgorodsky and P. E. Quintard, J. Mol. Struct., 1995, 348, 159 CrossRef CAS.
- A. A. Savina, V. V. Atuchin, S. F. Solodovnikov, Z. A. Solodovnikova, A. S. Krylov, E. A. Maximovskiy, M. S. Molokeev, A. S. Oreshonkov, A. M. Pugachev and E. G. Khaikina, J. Solid State Chem., 2015, 225, 53–58 CrossRef CAS.
- A. N. Vtyurin, A. S. Krylov, S. N. Krylova, S. V. Goryainov, V. N. Voronov and A. S. Oreshonkov, Ferroelectrics, 2012, 440, 100–104 CrossRef CAS.
- A. N. Vtyurin, A. S. Krylov, S. V. Goryainov, S. N. Krylova, A. S. Oreshonkov and V. N. Voronov, Phys. Solid State, 2012, 54, 934–936 CrossRef CAS.
- A. S. Krylov, A. N. Vtyurin, A. S. Oreshonkov, V. N. Voronov and S. N. Krylova, J. Raman Spectrosc., 2013, 44, 763–769 CrossRef CAS.
- Yu. V. Gerasimova, A. S. Oreshonkov, A. N. Vtyurin, A. A. Ivanenko, L. I. Isaenko, A. A. Ershov and E. I. Pogoreltsev, Phys. Solid State, 2013, 55, 2331–2334 CrossRef CAS.
- Xia Zhiguo, M. S. Molokeev, A. S. Oreshonkov, V. V. Atuchin, R.-S. Liu and C. Dong, Phys. Chem. Chem. Phys., 2014, 16, 5952–5957 RSC.
- V. V. Atuchin, A. S. Aleksandrovsky, O. D. Chimitova, T. A. Gavrilova, A. S. Krylov, M. S. Molokeev, A. S. Oreshonkov, B. G. Bazarov and J. G. Bazarova, J. Phys. Chem. C, 2014, 118, 15404–15411 CAS.
- Y. A. Izyumov and V. N. Syromyatnikov, Phase Transitions and Crystal Symmetry, Springer Netherlands, 1990, p. 444 Search PubMed.
- M. P. Ivliev and V. P. Sakhnenko, Ferroelectrics, 1996, 175, 65–71 CrossRef CAS.
Footnote |
| † Electronic supplementary information (ESI) available. See DOI: 10.1039/c6ce01144f |
| This journal is © The Royal Society of Chemistry 2016 |

