 Open Access Article
Polymorphism of the azobenzene dye compound methyl yellow†
Dyanne L.
Cruickshank
*a,
Christopher H.
Hendon
*b,
Matthew J. R.
Verbeek
a,
Aron
Walsh
c and
Chick C.
Wilson
cd
aCentre for Supramolecular Chemistry Research, Department of Chemistry, University of Cape Town, Rondebosch, 7701, South Africa. E-mail: dyanne.cruickshank@gmail.com
bDepartment of Chemistry, Massachusetts Institute of Technology, Cambridge, MA, USA. E-mail: hendon@mit.edu
cDepartment of Chemistry, University of Bath, Bath, BA2 7AY, UK
dEPSRC Centre for Innovative Manufacturing in Continuous Manufacturing and Crystallisation (CMAC), University of Bath, Bath, BA2 7AY, UK
First published on 20th April 2016
Abstract
The crystal structure and polymorphism of the well-known aminoazobenzene, N,N-dimethyl-4-aminoazobenzene (DAB) are studied; a second polymorph of DAB reported and the relationship between the two polymorphs studied using differential scanning calorimetry and by evaluating their lattice energies and absorption spectra. Without significantly strong intermolecular interactions present in the two forms of DAB, a balance between conformational strain and a cumulative π-orbital overlapping effect results in the existence of the enantiotropically related polymorphs and their alternative packing arrangements. The UV/vis spectra of the two polymorphs are different, thus illustrating the significance of small structural changes on the colour of a material, which could behave differently under particular sensing conditions. DAB has been used primarily as an acid/base indicator solution and a dye molecule and the implications of the polymorphic relationships established here are discussed with respect to the range of applications this molecule finds as a sensor and for its incorporation into various functional films and devices.
1. Introduction
Molecules containing an azo chromophore have a long-standing reputation as excellent dyes. (E)-N,N-Dimethyl-4-aminoazobenzene (DAB) more commonly known as methyl yellow, is one of the most successful azo dyes that found a wide range of applications initially, especially in the food and textile industries.1 After being reported as a carcinogen in the mid-1900's2 and discontinued as a food additive, DAB found other applications, most notably in sensing devices. DAB-based detectors are now being explored for their use in large chemical plants to detect formaldehyde and ammonia gas.3,4 It is also being incorporated into biomedical devices to detect for specific bio-analytes and to act as a sensor to determine optimal biological conditions.5 DABs ability to perform as a sensor is due to its obvious colour change (yellow to red and vice versa) that takes place with a change in pH. In addition to its acid/base indicator properties,6 it is able to undergo trans–cis photoisomerisation.7,8The physical and chemical properties of the DAB molecule are well-studied, but knowledge of the crystalline material has long been disregarded. Indeed, the first crystal structure of DAB was reported in 1992. However, the initial report was concerned with the effect of protonation on the azo bridge rather than the solid-state structure.9 At the time, it was thought that the protonation of this group served a structural role and the intramolecular hydrogen bond formed between the hydrazone-ketone tautomer was critical to the structural integrity of the azo-type material. However, the existence of a deprotonated azo-region, seen from the X-ray crystal structure of DAB, demonstrated that these dyes were indeed stable. Following this study, numerous other substituted azobenzene structures were realised in the 1990s,10 but packing polymorphism amongst mono- and di-substituted azobenzene dye compounds was not commonly observed. This is likely due to a lack of interest in the polymorphic nature of dye materials at the time, and difficulty in crystallising these, and other related materials.
There are no known polymorphs of the ubiquitous dye DAB in the trans-isomer. Here, we demonstrate that DAB crystallises in two polymorphs and we study their enantiotropic relationship using thermal methods (DSC and hot stage microscopy). Their optical and energetic properties are further explored using density functional theory (DFT), corroborating our experimental observations. We also find that the previously reported solid form of DAB (form I) is metastable, despite each DAB molecule occupying the more favourable planar molecular geometry. We can attribute the increase in stability of DAB form II to better π-orbital overlapping effects and thus we are able to present both a novel polymorph of DAB and an energetic basis for its formation. We anticipate that the results presented here may be used when rationalising and designing future materials that contain DAB as a key sensor molecule.
2. Experimental
2.1 Materials and preparation of polymorphs
DAB was purchased from Sigma Aldrich on two separate occasions (batch numbers 077K1187 and BCBM8998V). Solvent grade ethanol and acetonitrile were used for the recrystallisation of DAB form I and II respectively.2.2 Characterisation methods
| C14H15N3 (DAB) | Form I | Form II |
|---|---|---|
| Crystal system | Orthorhombic | Monoclinic |
| Crystal colour and habit | Yellow plate | Orange plate |
| Crystal dimensions (mm) | 0.20 × 0.18 × 0.02 | 0.20 × 0.11 × 0.08 |
| Space group | P212121 | P21/c |
| a (Å) | 6.021(2) | 6.2362(2) |
| b (Å)/β (°) | 7.287(3) | 16.4475(6), 93.457(4) |
| c (Å) | 27.27(1) | 11.5774(5) |
| Volume (Å3), Z | 1196.6, 4 | 1185.3, 4 |
| ρ calc (g cm−3) | 1.251 | 1.262 |
| μ (mm−1) | 0.077 | 0.077 |
| F(000) | 480 | 480 |
| θ range for data collection (°) | 2.9–25.7 | 3.0–29.6 |
| Miller index ranges | −7 ≤ h ≤ 3 | −8 ≤ h ≤ 8 |
| −6 ≤ k ≤ 8 | −22 ≤ k ≤ 22 | |
| −32 ≤ l ≤ 33 | −15 ≤ l ≤ 14 | |
| Reflections collected | 2253 | 2951 |
| Independent reflections | 1775 | 1988 |
| Final R indices [I > 2σ(I)] | R 1 = 0.0436, wR2 = 0.0992 | R 1 = 0.0519, wR2 = 0.1046 |
| R indices (all data) | R 1 = 0.0637, wR2 = 0.1083 | R 1 = 0. 0892, wR2 = 0.1221 |
| Largest diff. peak and hole (e Å−3) | 0.15, −0.17 | 0.21, −0.22 |
| CCDC deposition no. | 1443009 | 1443008 |
3. Results and discussion
3.1 Polymorph discovery
DAB was purchased from Sigma Aldrich on two separate occasions (the as-purchased PXRD patterns are shown in Fig. 1). The calculated PXRD pattern for form I, the only reported crystal structure, did not show perfect agreement with PXRD patterns of the samples as purchased, from which it was clear that there were at least two crystalline phases in the samples. Through targeted growth of form I and the solid form that emerged as the new form II, we were able to deconvolute the PXRD patterns. For rapid analysis, the forms can be identified by the low angle reflections, i.e. the presence of a reflection at a 2θ angle of 7° is indicative of form I.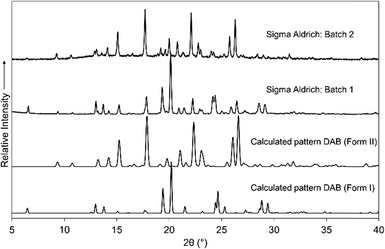 | ||
| Fig. 1 Calculated PXRD patterns of the two polymorphic forms of DAB and the experimental PXRD patterns from two different batches of DAB (Sigma Aldrich). | ||
Form I is readily crystallised through the evaporation of a solution of DAB from a variety of solvents (including mixed solvent systems, see ESI† Table S1 for details). Form II was obtained by dissolving 10 mg of DAB in acetonitrile and placing it into a fridge (4 °C). Seven months later form II appears as a dark orange crystalline material.
Full data collections were performed on the single crystals of DAB forms I and II and their X-ray structures determined. The single crystal X-ray structure of form I was redetermined, as the current structure on the Cambridge Structural Database (CSD) has poor hydrogen placement.
3.2 X-ray analysis
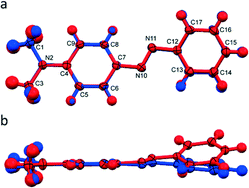
DAB form I displays a planar structure with torsion angles about the azo bond of less than one degree. Form II, however, displays a noticeable out-of-plane bend (torsion angle N10–N11–C12–C13 = 20°). This is the main conformational difference between the two polymorphs as they both maintain the trans conformation about the azo bond. These differences are shown by overlaying a representative DAB molecule from each structure, Fig. 2. From both simple Hückel theory, and expanded descriptions of complex π-systems, it is clear that the extent of orbital overlap determines the electronic structure of the system.24–26 From molecular arguments alone we anticipate that polymorphs form I and II should be electronically dissimilar.As well as the molecular differences, the intermolecular packing arrangements of the two polymorphs are significantly different (Fig. 3), with form I exhibiting a pseudo-layered arrangement of the molecules along the [0 1 0] plane. In these layers DAB molecules position themselves in a head-to-tail, zig-zag arrangement. The packing arrangement of form II, on the other hand, contains DAB molecules arranged in centrosymmetric pairs with centroid to centroid distances measuring over 4.7 Å. There are two noteworthy intermolecular interactions that occur between the DAB pairs that are positioned perpendicular to one another in the herringbone formation shown in Fig. 3(b). A C–H⋯π (C3⋯Cga, 3.76 Å, 157° a: −x, y − 1/2, −z − 1/2) and C–H⋯N (C15⋯N11b, 3.316(2) Å; H15⋯N11b, 2.53 Å; 140°, b: x, 3/2 − y, 1/2 + z) interaction on either side of each DAB pair weakly binds the perpendicular neighbours to one another. These intermolecular interactions for DAB form II are evident on the Hirshfeld fingerprint plots (Fig. 3), which are different for the two polymorphs.27 Form II contains two long and sharp lateral spikes with a minimum di + de ≈ 2.5 Å which corresponds to the C–H⋯N contacts, while this signature feature is not seen in the fingerprint plot for form I. The torsion angle around the azo bond in form II results in increased C–H⋯N and C–H⋯π interactions. The Hirshfeld surface analysis diagrams (ESI† Fig. S1) supports the fingerprint plots and clearly shows the intermolecular interactions present between the molecules in each polymorph.
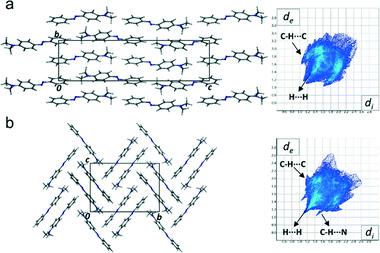 | ||
| Fig. 3 Packing diagrams of DAB form I (a) and form II (b) viewed down the a-axis with their respective Hirshfeld fingerprint plots. | ||
The dimethylamino group is largely responsible for the large displacements found between the layered DAB molecules and centrosymmetric pairs in form I and II respectively. The molecular displacement is consistent with increased electron density in the phenyl rings, and therefore an increase in intermolecular π-repulsion. Electrostatics play an important role in the molecular arrangement of both polymorphs as there are no true π-stacking interactions present in either structure. The azo and N(CH3)2 moieties are the electron deficient groups which are in close proximity to the repulsive π-electron regions of the two phenyl rings.
3.3 Thermal analysis
The DSC results for the raw material as supplied, and samples of form I and form II of DAB are illustrated in Fig. 4. The accurate heats of transition (ΔHt) and fusion (ΔHf) as well as their extrapolated onset temperatures (Tt and Tf) for the three samples are listed in Table 2. The DSC trace of the raw material illustrates two endothermic peaks (A and B). A pure sample of form I, crystallised from ethanol at room temperature, contains one endothermic event (melting, peak B). This thermal transition occurs at 116 °C and can be seen in the hot stage microscope images (upper panel of Fig. 5). Due to purification limitations, it was challenging to isolate a powder composed of purely form II (PXRD analysis showed a small quantity of form I, ESI† Fig. S2). This pseudo-pure sample showed the expected endothermic peak associated with the melting event of form I (peak B), and also a much lower energy melting event at a lower temperature (peak A, ca. 80 °C). The DSC trace associated with form II closely matches the as-purchased material. However, the change in enthalpy for DAB form II (peak A) was significantly greater than that of the raw material (Table 2), further confirming that the raw material is a physical mixture of the two polymorphs. Hot stage microscopy images of form II (lower panel of Fig. 5) shows a loss of crystallinity and darkening of the crystal occurring at 80 °C. This event can be associated with a phase transition from form II to form I. According to the heat of transition rule,28 these polymorphs are enantiotropically related to one another with form II being the stable polymorph below 80 °C. Form I is the thermodynamically stable form between the thermodynamic transition point and its melting point. Despite form II having two weak intermolecular interactions, the heat supplied at 80 °C is sufficient to collapse the structure and allow the ‘twisted’ azo bond to relax into the more planar conformation.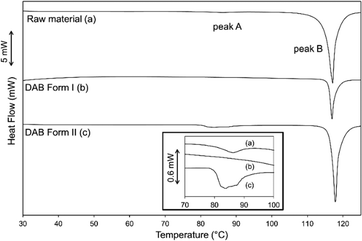 | ||
| Fig. 4 DSC traces of the DAB samples illustrating the dominant melting peak B and the inset illustrates peak A that is present for sample (a) and (c) (↓endo). | ||
| Samples | Onset Tt (°C) | ΔHt (J g−1) | Onset Tf (°C) | ΔHf (J g−1) |
|---|---|---|---|---|
| Raw material – peak A | 80.7 ± 0.5 | 1.9 ± 0.1 | ||
| (n = 2) | (n = 2) | |||
| Raw material – peak B | 114.7 ± 0.1 | 96.4 ± 0.8 | ||
| (n = 2) | (n = 2) | |||
| DAB form I – peak B | 113.3 ± 0.2 | 93 ± 1 | ||
| (n = 2) | (n = 2) | |||
| DAB form II – peak A | 79.5 ± 0.5 | 8 ± 2 | ||
| (n = 2) | (n = 2) | |||
| DAB form II – peak B | 116.5 ± 0.2 | 107.4 ± 0.1 | ||
| (n = 2) | (n = 2) |
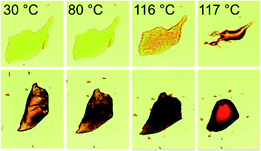 | ||
| Fig. 5 HSM images of the single crystals of form I (upper) and form II (lower), used for the X-ray data-collections, being heated at a rate of 10 °C min−1. | ||
3.4 Solid-state electronic structure
Using the structures obtained from the solid-state DFT optimisations, total crystal lattice energies and electronic structures were obtained for both DAB polymorphs. Form I was computed to be less stable than form II by 1.6 kJ mol−1 per molecule. The difference in relative lattice energies for these two polymorphs is small and supports the postulation by Cruz-Cabeza et al. that 74% of conformational polymorphs differ in lattice energy by less than 6 kJ mol−1.29 Spectroscopic measurements elucidated that form I has an absorption onset at 510 nm while form II has an absorption onset at 525 nm. These are in qualitative agreement with experimentally determined UV-vis absorption onsets (form I at 553 nm, form II at 575 nm). This result is somewhat surprising as the molecular-favoured geometry (i.e. the planar π-system like that of form I) is certainly more favoured than deviations from planarity.Both theoretically and experimentally determined spectra are presented in Fig. 6. Examination of the origin of the highest occupied crystalline orbitals (HOCOs) and lowest unoccupied crystalline orbitals (LUCOs) (Fig. 6(b)–(e)), show that the fundamental electronic transition corresponds to an azo-bridge-to-planar π-system transition. However, form I is noticeably different in HOCO charge locality. Electron density is observed to be more centred on the azo bridge in form I, rather than the peripheral functionality in form II. This increased orbital interaction is stabilising. The LUCO for both systems are similar. As a result, it is predicted that form I will exhibit a wider gap electronic transition due to increased stabilising π-delocalisation.
Thus, the molecular geometry of the crystal constituents is a good indication of the spectroscopic energetics (as the transitions are intramolecular and highly localised, the crystal packing contributions are minimal), but the molecular geometry is not a good indication of net crystal energy. The latter fails because molecular arguments do not consider both intermolecular multipole stabilising interactions and crystal density.
The difference in crystal energy can be thought of as a product of two interactions; i) intermolecular multipole stabilising interactions, and ii) crystal density. Given form I′s overall decrease in stability, we can conclude that the energy deficit is a product of intermolecular interactions. It is likely that form II is stabilised by the stronger C–H⋯N and C–H⋯π interactions and overall electrostatics present within the crystal structure and the conformational strain around the azo bond plays a much smaller role.
4. Conclusion
We have presented the discovery of a second, more stable, polymorph of the azobenzene dye DAB. The conformational polymorphs are enantiotropically related to one another and their relative lattice energies are very similar. Both polymorphs are obtained simultaneously in the production of the dye and sold to consumers. The origin of the difference in structure may be attributed to a macroscopic crystal packing rather than being determined by molecular torsions. Furthermore, our methods have elucidated that the unfavourable molecular torsions are the origin of the decreased absorption onset, but the long absorption onset tail associated with form II imparts an orange hue on the crystals.As the scientific community moves towards advanced solid-state applications of these types of molecules in films and sensing devices, their polymorphic nature will become increasingly important; one polymorph may have preferred physical and spectroscopic properties than another, and the relative stability and possibility of transformations between the polymorphs must be taken into account in formulating, storing and using the resulting DAB-containing functional product.
Acknowledgements
This work was funded by a Leverhulme Trust Visiting Fellowship (to DLC), the EPSRC (grants EP/K004956/1 & EP/I033459/1) as well as a South African National Research Foundation Fellowship (NRF RCA to DLC). The computational work was facilitated by access to the UK National Supercomputer, ARCHER (EPSRC Grant EP/L000202) and XSEDE (NSF Grant ACI-1053575).Notes and references
- Industrial Dyes Chemistry, Properties, Applications, ed. K. Hunger, Wiley-VCH Verlag GmbH & KGaA, Weinheim, 2003 Search PubMed.
- K. Sugiura, Cancer Res., 1948, 3, 141–144 Search PubMed.
- N. Nakano, M. Ishikawa, Y. Kobayashi and K. Nagashima, Anal. Sci., 1994, 10, 641–645 CrossRef CAS.
- S. Sternberg, D. Boggs, R. Yeh and L. Pan, US Pat., 20030113932 A1, 2003 Search PubMed.
- (a) H. Lewis, H. Ni, L. Pang, S. Stanislaw and L. Tang, PCT Int. Appl., WO2013110574 A1, 2013; (b) W. S. Yerazunis, K. T. Lau, R. L. Shepherd and K. H. Crowley, US Pat. Appl. Publ., US20080069727 A1, 2008.
- F. J. Green, The Sigma-Aldrich Handbook of Stains, Dyes and Indicators, Aldrich Chemical Company, Inc., Milwaukee, WI, 1990 Search PubMed.
- P. Hamm, S. M. Ohline and W. Zinth, J. Chem. Phys., 1997, 106, 519–529 CrossRef CAS.
- H. Koshima, N. Ojima and H. Uchimoto, J. Am. Chem. Soc., 2009, 131, 6890–6891 CrossRef CAS PubMed.
- A. Whitaker, J. Crystallogr. Spectrosc. Res., 1992, 22, 151–155 CrossRef CAS.
- Cambridge Structural Database and Cambridge Structural Database system, Version 5.36, November 2014 release with Feb and May 2015 updates.
- Bruker, SAINT +. Version 6.02 (Includes XPREP and SADABS), Bruker AXS Inc., Madison, Wisconsin, USA, 1999 Search PubMed.
- G. Sheldrick, Acta Crystallogr., Sect. A: Found. Crystallogr., 2008, 64, 112–122 CrossRef CAS PubMed.
- K. Yvon, W. Jeitschko and E. Parthé, J. Appl. Crystallogr., 1977, 10, 73–74 CrossRef.
- L. J. Barbour, Supramol. Chem., 2001, 1, 189–191 CrossRef CAS.
- G. Kresse and J. Furthmüller, Phys. Rev. B: Condens. Matter Mater. Phys., 1996, 54, 11169–11186 CrossRef CAS.
- A. J. Jackson, J. M. Skelton, C. H. Hendon, K. T. Butler and A. Walsh, J. Chem. Phys., 2015, 143, 184101 CrossRef PubMed.
- J. P. Perdew, A. Ruzsinszky, G. I. Csonka, O. A. Vydrov, G. E. Scuseria, L. A. Constantin, X. Zhou and K. Burke, Phys. Rev. Lett., 2008, 100, 136406 CrossRef PubMed.
- J. P. Perdew, K. Burke and M. Ernzerhof, Phys. Rev. Lett., 1996, 77, 3865–3868 CrossRef CAS PubMed.
- J. Tao and J. P. Perdew, Phys. Rev. Lett., 2003, 91, 146401 CrossRef PubMed.
- C. H. Hendon, D. R. Carbery and A. Walsh, Chem. Sci., 2014, 5, 1390–1398 RSC.
- A. T. Murray, J. M. Frost, C. H. Hendon, C. D. Molloy, D. R. Carbery and A. Walsh, Chem. Commun., 2015, 51, 8935–8938 RSC.
- C. H. Hendon, K. E. Wittering, T.-H. Chen, W. Kaveevivitchai, I. Popov, K. T. Butler, C. C. Wilson, D. L. Cruickshank, O. Š. Miljanić and A. Walsh, Nano Lett., 2015, 15, 2149–2154 CrossRef CAS PubMed.
- K. T. Butler, C. H. Hendon and A. Walsh, J. Am. Chem. Soc., 2014, 136, 2703–2706 CrossRef CAS PubMed.
- S. G. DiMagno, A. K. Wertsching and C. R. Rossll, J. Am. Chem. Soc., 1995, 117, 8279–8280 CrossRef CAS.
- H. Ryeng and A. Ghosh, J. Am. Chem. Soc., 2002, 124, 8099–8103 CrossRef CAS PubMed.
- S. Kato, M. Kivala, W. Bernd Schweizer, C. Boudon, J.-P. Gisselbrecht and F. Diederich, Chem. – Eur. J., 2009, 15, 8687–8691 CrossRef CAS PubMed.
- M. A. Spackman and J. J. McKinnon, CrystEngComm, 2002, 4, 378–392 RSC.
- A. Burger and R. Ramberger, Mikrochim. Acta, 1979, II, 259–271 CrossRef.
- A. J. Cruz-Cabeza, S. M. Reutzel-Edens and J. Bernstein, Chem. Soc. Rev., 2015, 44, 8619–8635 RSC.
Footnote |
| † Electronic supplementary information (ESI) available: The CIF files have been deposited with the Cambridge Crystallographic Data Centre (CCDC 1443008 and 1443009). A supporting information file has also been supplied with additional figures and experimental information. For ESI and crystallographic data in CIF or other electronic format see DOI: 10.1039/c6ce00387g |
| This journal is © The Royal Society of Chemistry 2016 |

