DOI:
10.1039/C5CE02581H
(Paper)
CrystEngComm, 2016,
18, 2081-2088
Influence of Ta5+ content on the crystallographic structure and electrical properties of [001]PC-oriented (Li,Na,K)(Nb,Ta)O3 single crystals
Received
29th December 2015
, Accepted 12th February 2016
First published on 12th February 2016
Abstract
A series of centimeter-sized lead-free piezoelectric Li+- and Ta5+-modified (Na,K)NbO3 single crystals with an ABO3 perovskite structure was successfully grown by the top-seeded solution growth method. Effective segregation of the elements was considered in order to further develop the growth of Li+- and Ta5+-modified (Na,K)NbO3 single crystals. The crystallographic structure and electrical behaviour along the [001]PC orientation were studied. X-ray diffraction, Raman spectroscopy and dielectric studies reveal that the increase in Ta5+ content reduces the orthorhombic–tetragonal phase transition. Bipolar and unipolar strain curves were investigated at 2 kV mm−1. The highest bipolar and unipolar strains associated with a large-signal piezoelectric constant of 368 pm V−1 were achieved for Li0.02Na0.626K0.354Nb0.808Ta0.192O3. The asymmetric bipolar strain curves were observed and related to the existence of internal bias fields induced by
| |  |
(1)
|
defect dipoles, which were created during the crystal growth process.
1. Introduction
Lead-free piezoelectrics are currently studied and developed as alternatives to lead-based materials, such as Pb(Ti,Zr)O3 (PZT), due to environmental issues caused by the toxicity of lead.1–3 At the present time, Na0.5Bi0.5TiO3-based,1,4,5 BaTiO3-based6–8 and NaxK1−xNbO3-based (KNN)9,10 lead-free piezoelectric materials exhibit the most promising properties, which can compete with those of PZT, as referenced by Saito et al. in 2004.9 Since then, the KNN-based systems have attracted much attention, whereby enhanced dielectric, ferroelectric and piezoelectric properties could be obtained in the vicinity of their Polymorphic Phase Transition (PPT) between the orthorhombic and the tetragonal phases.11–14 This phase transition, occurring in pure KNN at 200 °C, can be shifted to room temperature by chemical modifications, which is an effective way to improve electrical performance. Of particular significance are Li+, Sb5+ and Ta5+ substitutions. For instance, a d33 of about 230 pC N−1, with a planar mode coupling coefficient of kp = 0.51, and a relatively high Curie temperature of TC = 323 °C were reported in a polycrystalline (Li,Na,K)(Nb,Ta)O3 (KNLTN) ceramic with 3 mol% Li+ and 20 mol% Ta5+, while even higher properties were reported in textured (Li,Na,K)(Nb,Ta,Sb)O3 (KNLSTN) polycrystalline ceramics with d33 = 416 pC N−1 and a high planar mode coupling coefficient kp = 0.61.9,15 At this point it should be noted that Sb is a toxic element and should therefore be avoided.
The research on perovskite lead-based piezoelectric materials revealed that single crystals exhibit much higher piezoelectric properties than polycrystalline ceramics, due to their anisotropic properties and the absence of intergranular interactions.16 Recently, Huo et al.17 have grown a Mn-doped [Lix(Na0.484K0.516)1−x](Nb0.713Ta0.287)O3 single crystal with a piezoelectric coefficient of d33 = 630 pC N−1 and a very high longitudinal mode coupling coefficient of k33 = 0.95. Nevertheless, the exact composition was not reported. In general, Li+ content is hardly measured due to the chemical stability of KNN-based crystals which are poorly dissolvable in acid solutions used for Inductively Coupled Plasma Optical Emission Spectroscopy (ICP-OES) analysis, and due to its low content which is difficult to detect in a precise manner. Table 1 summarizes selected properties of pure and modified-KNN single crystals grown by various techniques such as Top-Seeded Solution Growth (TSSG), the Floating Zone Method (FZM), flux-Bridgman and Solid State Crystal Growth (SSCG). As evident, only a few Li+ or/and Ta5+-modified KNN-based single crystals with the orthorhombic–tetragonal phase transition temperature (TO–T) close to the room temperature were reported. The highest measured room temperature dielectric permittivity εr was 1015,18 while most εr values are lower than 800.
Table 1 Comparison of the properties of KNN-based single crystals
| Composition |
Method |
T
O–T (°C) |
T
C (°C) |
ε
r (at RT) |
d
33 (pC N−1) |
d
33* (pm V−1) |
Ref. |
[110]PC-oriented single crystals.
Flux-Bridgman.
[1![[3 with combining macron]](https://www.rsc.org/images/entities/char_0033_0304.gif) 1]O-oriented single crystals. 1]O-oriented single crystals.
|
| KNLTN |
TSSG |
−23 |
197 |
|
|
|
22
|
KNLTN![[thin space (1/6-em)]](https://www.rsc.org/images/entities/char_2009.gif) : :![[thin space (1/6-em)]](https://www.rsc.org/images/entities/char_2009.gif) Mn Mn |
TSSG |
30 |
235 |
350 |
630 |
870 |
17
|
| KNLTN |
TSSG |
49 |
232 |
790 |
354 |
672 |
22
|
| KNLTN |
TSSG |
79 |
276 |
500 |
255 |
470 |
23
|
| KNTN |
TSSG |
120 |
298 |
267 |
162 |
|
24
|
| KNTN |
TSSG |
120 |
290 |
300 |
∼170 |
|
25
|
| KNTN |
FZM |
171 |
370 |
128 |
|
|
26
|
| KNTNa |
FZM |
|
|
148 |
70 |
|
26
|
| KNLN |
Bridgmanb |
179 |
421 |
530 |
161 |
|
27
|
| KNLN |
Bridgman |
192 |
426 |
185 |
405 |
|
28
|
KNLN![[thin space (1/6-em)]](https://www.rsc.org/images/entities/char_2009.gif) : :![[thin space (1/6-em)]](https://www.rsc.org/images/entities/char_2009.gif) Mn Mn |
Bridgmanb |
186 |
441 |
614 |
190 |
|
27
|
KNLN![[thin space (1/6-em)]](https://www.rsc.org/images/entities/char_2009.gif) : :![[thin space (1/6-em)]](https://www.rsc.org/images/entities/char_2009.gif) Mn Mn |
Bridgmanb |
195 |
446 |
899 |
|
|
27
|
| KNN |
TSSG |
180 |
400 |
423 |
70 |
|
29
|
| KNNa |
TSSG |
185 |
400 |
375 |
145 |
|
29
|
| KNNc |
SSCG |
192 |
410 |
1015 |
|
80 |
18
|
| KNN |
FZM |
192 |
405 |
114 |
76 |
|
26
|
| KNNa |
FZM |
|
|
123 |
65 |
|
26
|
The KNN-based single crystal growth is affected by the difficulty in controlling the stoichiometry of the crystals. On the one hand, the compositions of the as-grown crystals are different from those of the initial liquid due to the thermodynamic segregation of the elements in KNN-based solid solutions.19,20 On the other hand, Prakasam et al.21 noted that the segregation phenomena for individual elements in KNLSTN single crystals were also induced by the preferential volatilization of some elements from the liquid solution during the growth process occurring at high temperature.
In the present work, several growth experiments of KNLTN single crystals were undertaken by the TSSG method and the segregation phenomena of Li+ and Ta5+ were examined. The influence of Ta5+ content on the structural and electrical properties is investigated and electric-field-induced bipolar strain curves of KNLTN single crystals are reported for the first time.
2. Experimental
2.1 Crystal growth
Crystal growth was carried out in a resistive heating furnace with a longitudinal thermal gradient smaller than 1 °C cm−1. KNLTN single crystals were grown by the TSSG method with [001]C-oriented KTaO3 seeds and an excess of Li2O and K2O acting as a self-flux. Three growth attempts, labeled as KNLTN1, KNLTN2 and KNLTN3, with increasing Ta5+ contents, were performed with a constant initial Li+ content. Moreover, a pure (Na,K)NbO3 (KNN0) single crystal has been grown as a reference with the same method. High purity powders of Na2CO3 (99.99%, Aran Isles Chemical Inc.), Li2CO3 (99.99%, Aran Isles Chemical Inc.), K2CO3 (99.99%, Aran Isles Chemical Inc.,), Nb2O5 (99.99%, Aran Isles Chemical Inc.,) and Ta2O5 (99.99%, Aran Isles Chemical Inc.,) were used as the starting materials to synthesize KNLTN by a high temperature solid-state reaction. After mixing for 24 h, the powders were kept at 800 °C for 24 h and finally melted at a temperature above 1200 °C. The batch was held at a soaking temperature of about 20 °C above the saturation temperature for 24 h and subsequently the [001]C-oriented KTaO3 seed was immersed into the saturated liquid solution with a stirring rate of 40 rpm for 24 h under air atmosphere. The rotation speed was set in the range from 10 rpm to 35 rpm and the cooling rate was fixed between 0.1 °C h−1 and 0.5 °C h−1.
2.2 Characterization
Chemical compositions were measured by combination of Electron Probe Micro Analysis (EPMA) and ICP-OES. The amount of each element, except Li+, was first measured locally on polished single crystals by EPMA using a CAMECA SX-100 instrument operating at 20 keV and 20 nA. Complementary chemical analyses for all elements were performed by ICP-OES with a VARIAN 720-ES spectrometer. The solutions were prepared by dissolving 50 mg of a crushed crystal in a 40 vol% HF solution at 180 °C with a 5-bar-autogenous pressure. ICP-OES and EPMA analysis results were averaged leading to a per-site-accuracy of 1 mol% for Nb5+ and Ta5+ and 5 mol% for alkali elements, except Li+ for which the accuracy is 0.24 mol%.
Powder X-ray diffraction (XRD) has been performed on crushed crystals using a PANalytical X'pert Pro MPD diffractometer with Cu Kα radiation and Bragg–Brentano geometry, while Kα2 reflections were removed after the measurement. The Laue backscattering method was used to orient the single crystals. The backscattered diffraction patterns were collected using a CCD-camera device (Photonic Science dual lens coupled X-rays Laue system) after a 3–5 min stationary crystal irradiation with polychromatic X-rays supplied by a molybdenum anticathode. The Raman spectra were carried out on the single crystals by using a LabRAM HR800 Raman spectroscopy with 633 nm radiation from a He-Ne laser at room temperature. Two sides of plate-like samples from all single crystals were covered with silver electrodes for electrical measurements. Temperature-dependent permittivity measurements have been carried out by a HP 4284A impedance analyzer with a Nabertherm furnace in the temperature range between 30 °C and 450 °C and a Novocontrol Alpha-A high performance frequency analyzer in the temperature range from −100 °C to 30 °C. Electric-field-induced strain curves and ferroelectric hysteresis loops were measured by a modified Sawyer–Tower setup with a 10 μF reference capacitance and an optical displacement sensor (Philtec, Inc.). Triangular electric field signals with a 10 Hz frequency were used.
3. Results and discussion
The KNLTN1 boule is depicted in Fig. 1 and looks milky overall. Fig. 1(d) provides the backscattered Laue diffraction pattern along the [001]PC orientation. The typical dimensions of the as-grown KNLTN crystals are about 20 mm in diameter and about 5 mm in thickness.
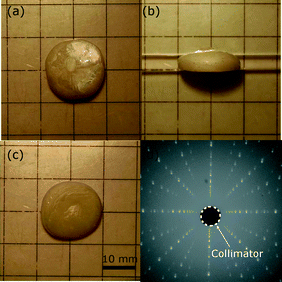 |
| | Fig. 1 View from (a) the top, (b) the side and (c) the bottom; (d) backscattered Laue diffraction pattern of one of the as-grown (Li,Na,K)(Nb,Ta)O3 single crystals. | |
The chemical compositions of the as-grown crystals are listed in Table 2. The alkali contents of the KNLTN crystals on the A-site are close to each other, making it possible to compare crystal properties as a function of Ta5+ content. The slight concentration difference can be ascribed to the small change in the compositions in the initial solutions and the difficulty in keeping the same crystal growth conditions during every growth process such as the volatilization rate of the liquid solution with respect to the growth time.21
Table 2 Chemical compositions (EPMA, ICP-OES) and X-ray diffraction (XRD) structure of the as-grown KNLTN single crystals
|
|
Element concentration Cs |
Structure |
|
|
| A site |
B site |
Lattice parameters |
Phase |
|
|
| Li (%) |
Na (%) |
K (%) |
Nb (%) |
Ta (%) |
a (Å) |
b (Å) |
c (Å) |
|
|
| KNN0 |
0.0 |
11.9 |
88.1 |
100 |
0.0 |
3.963 |
5.681 |
5.707 |
O |
|
|
| KNLTN1 |
2.0 |
71.2 |
26.8 |
86.4 |
13.6 |
3.970 |
5.587 |
5.704 |
O |
|
|
| KNLTN2 |
2.0 |
62.6 |
35.4 |
80.8 |
19.2 |
3.984 |
3.984 |
4.127 |
T |
|
|
| KNLTN3 |
1.7 |
63.8 |
34.5 |
65.6 |
34.4 |
3.997 |
3.997 |
4.073 |
T |
|
|
The difference between the crystal composition and the concentration of the elements in the initial liquid solution can be described by the classical effective segregation coefficient keff:20
| |  | (1) |
where
k0 is the thermodynamic segregation coefficient,
kvolatilization ≥ 1 is defined as the volatilization contribution factor to the effective segregation coefficient,
ν is the growth rate,
δ is the thickness of the solid–liquid boundary layer and
D is the diffusion coefficient of the element in the liquid solution.
In the case of flux growth, the growth rate is very slow so ν is considered to be close to zero. According to the fact that the volatilization of the solution during the growth process acts as an important factor on the effective segregation coefficients with respect to the growth time, the effective segregation coefficient is assumed as:
| |  | (2) |
Moreover, it is assumed that the equilibrium phases were reached during the flux growth process. At the equilibrium state, no composition gradient can be detected in every phase. It is therefore assumed that both solid and liquid phases were uniform. Hence, the effective segregation coefficient keff can also be expressed as (eqn 3), arising from the well-known Scheil's equation:20
| |  | (3) |
where
CS is the concentration of the element in the solid phase,
i.e. in the single crystal, and
CL(∞) the concentration of the element in the liquid solution at the beginning of crystal growth.
Table 3 and Fig. 2(a) display the keff of individual elements as a function of CL(∞) for the four crystal growth attempts. The effective segregation coefficients keff(Li+), keff(K+) and keff(Nb5+) are lower than 1, while keff(Na+) and keff(Ta5+) are higher than 1. Moreover, the increasing concentration of K+ and Nb5+ ions in the initial liquid solutions resulted in increasing keff, while the opposite trend is observed for Ta5+ ions. This trend is directly related to the slope signs of the liquidus and solidus lines, as described by analogy in KNbO3–KTaO3 and NaNbO3–KNbO3 phase diagrams where two ions on the A or B site were considered.30,31 From the KNbO3–KTaO3 phase diagram,30 a positive slope of the liquidus curve induces a keff(Ta5+) > 1. In addition, Fig. 2(b) shows that the calculated keff(Ta5+) in the crystal decreases with increasing Ta5+ content in the liquid. The keff(Ta5+) values of the present work are consistent with those calculated from the phase diagram, as presented in Fig. 2(b). In addition, it can be inferred that a keff(Ta5+) > 1 leads to a strong depletion of Ta5+ in the liquid solution and subsequently to a step by step decrease of its incorporation into the crystal as the growth proceeds. Using the same approach, the negative slope of the liquidus curve in the NaNbO3–KNbO3 system31 leads to a reverse behaviour for K+: keff(K+) < 1 and increasing K+ content along the growth direction. Changes in Ta5+ and K+ concentrations should be detected in principle along the growth directions of all crystals, and they therefore should affect their electrical properties due to compositional inhomogeneity. However, due to the small sample size, the concentration of the elements has been considered as homogeneous for further electrical characterization.
Table 3 Segregation coefficients with respect to the element concentrations in liquid solution CL(∞)
|
|
|
Li |
Na |
K |
Nb |
Ta |
| KNN0 |
k
eff
|
— |
2.38 |
0.93 |
1 |
— |
| KNN0 |
C
L(∞), (%) |
0.00 |
5.00 |
95.00 |
100.00 |
0.00 |
| KNLTN1 |
k
eff
|
0.18 |
3.31 |
0.40 |
0.89 |
4.69 |
| KNLTN1 |
C
L(∞), (%) |
11.38 |
21.54 |
67.08 |
97.10 |
2.90 |
| KNLTN2 |
k
eff
|
0.13 |
3.90 |
0.52 |
0.85 |
3.84 |
| KNLTN2 |
C
L(∞), (%) |
15.30 |
16.05 |
68.65 |
95.00 |
5.00 |
| KNLTN3 |
k
eff
|
0.11 |
3.98 |
0.89 |
0.82 |
1.72 |
| KNLTN3 |
C
L(∞), (%) |
15.30 |
16.05 |
68.65 |
80.00 |
20.00 |
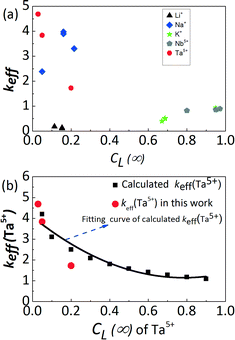 |
| | Fig. 2 (a) Effective segregation coefficient keff of individual elements as a function of the concentration of the elements in the liquid solution CL(∞), and (b) keff of Ta5+ as a function of its molar concentrations in the liquid solution compared with that deduced from the pseudo-binary KNbO3–KTaO3 phase diagram given by Reisman et al.30 | |
Besides, the keff values of Li+ measured in the KNLTN crystals were found to be about 0.13, which is consistent with the previous work of Hofmeister et al.,32 where the keff(Li+) in (LiyK1−y)(Nb0.65Ta0.35)O3:Cu crystals was calculated to be approximately 0.125. Higher Li+ content could lead to the formation of a secondary tetragonal-tungsten-bronze-type phase because of its limited solubility in the KNN matrix, as previously reported in polycrystalline ceramics.33,34 Therefore, the Li+ contents in KNLTN single crystals are low and almost constant. Moreover, according to the work of Sadel et al.,35 the keff(Li+) in (Li0.02Na0.98)NbO3 (LNN) crystals grown with NaBO2 flux at 1147 °C was calculated to be 0.25. The higher value, as compared to the present work, highlights the influence of volatilization of Li-based compounds on its effective segregation. Note that substantial evaporation of Li+ from the solution is reported to start at 1197 °C, which is in the working temperature range of the KNLTN crystal growth. In the present work, compared with the work of Sadel et al. where the volatilization contribution of Li+ is not so significant that keff = k0 for LNN, we assume that the same thermodynamic segregation coefficient k0 should be obtained for KNLTN due to the low Li+ solubility in the perovskite matrix and the close Li+ concentrations in the initial solution. Hence, the kvolatilization factor was estimated to be in the range from 1.39 to 2.27 for KNLTN.
Finally, it is worth mentioning that the segregation trends of alkali elements in KNLTN are similar, regardless of whether two or three different ions are present on the A-site: keff(Li+) < 1, keff(K+) < 1 and keff(Na+) > 1. However, we note that keff(Na+) depends on the presence or the absence of Li+ in the initial composition containing K+. As is evident, keff(Na+) should decrease monotonically with increasing concentration of Na+ in the liquid solution.31 In the present work, the initial content of Na+ in KNN0 is 5% and keff(Na+) = 2.38. Compared with the previous work of Reisman et al.,31 the keff(Na+) value is higher than 1 as expected. Nevertheless, keff(Na+) in the KNN0 single crystal should be higher than those of KNLTN2 (keff(Na+) = 3.90) and KNLTN3 (keff.5(Na+) = 3.98) where the initial content of Na+ is 16.05%. The lower keff(Na+) in the KNN0 single crystal suggests a stronger competition between the three alkali elements regarding their incorporation into the A-site, as compared to the previous literature reports where only two ions were introduced into the A or B sites.30,31 It appears that the presence of Li+ increases keff(Na+) in the KNLNT crystals, as compared to the systems without Li+.
The XRD patterns obtained on crushed single crystals are presented in Fig. 3(a), while the calculated lattice parameters and the crystallographic structure are provided in Table 2. The reason for different room temperature structures of the KNLTN single crystals is the variation of the Ta5+ content. All samples are in a single phase with the perovskite structure and no secondary phase is observed. In order to emphasize the details of the crystal structure, the peaks of the 2θ region around 45° are enlarged in Fig. 3(b). The ratios of intensities I022/I200 for the KNN0 and KNLTN1 samples are close to 2, while for KNLTN2 and KNLTN3 the I002/I200 values are about 0.5. These ratios confirm that the phase evolves from orthorhombic to tetragonal with increasing Ta5+ content. This phenomenon was induced by the substitution of Nb5+ (R = 0.069 nm; CN6) ions by the slightly smaller Ta5+ (R = 0.068 nm; CN6)36 as previously reported for Ta5+-modified KNN-based polycrystalline ceramics.37,38
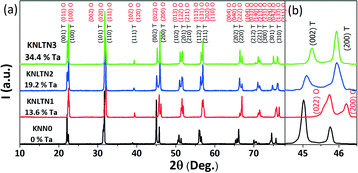 |
| | Fig. 3 XRD patterns of the crushed KNLTN single crystals. (a) Full range and (b) enlarged region of (002)T/(200)T or (022)O/(200)O peaks. | |
Fig. 4 shows the Raman spectra of the [001]PC-oriented KNLTN single crystals. The BO6 octahedron of the KNLTN system has six vibrational modes: 1A1g(v1) + 1Eg(v2) + 2F1u(v3,v4) + F2g(v5) + F2u(v6), where 1A1g(v1) + 1Eg(v2) + F1u(v3) are stretching modes and others are bending modes.39 The Raman peaks between 100 cm−1 and 200 cm−1 correspond to the translational modes of the A-site cations and the rotations of the BO6 octahedron. The modes in the range from 200 cm−1 to 1000 cm−1 come from the stretching and bending vibrations of the BO6 octahedron.39,40 With increasing Ta5+ content, the v2 modes and the shoulders of the v5 modes become weaker, indicating a phase transition from the orthorhombic to the tetragonal phase. On the other hand, the pure KNN single crystal possesses a weaker v1 and v5 mode, but a stronger v1 + v5 coupling mode and v4 mode, as compared to KNLTN single crystals. The decoupling effect of the v1 and v5 modes might result from the weaker interactions among the BO6 octahedra after Li+ and Ta5+ substitutions.
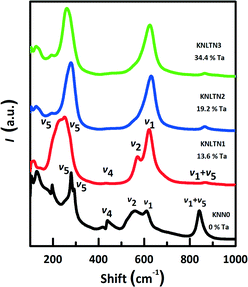 |
| | Fig. 4 Raman spectra of the [001]PC-oriented KNLTN single crystals with various Ta5+ contents at room temperature. | |
Fig. 5(a) provides the temperature-dependent dielectric permittivity and losses of the [001]PC-oriented KNLTN single crystals at 10 kHz in the temperature range from −100 °C to 450 °C. Fig. 5(b) displays the phase transition temperatures with various Ta5+ contents, obtained from the dielectric measurements. The increase in Ta5+ content shifts both TC and TO–T to lower temperatures and the decrease could be fitted with linear eqn (4) and (5):
| | | TC(°C) = −(4.6 ± 0.23)·x(mol%) + (436 ± 4.7) | (4) |
| | | TO−T(°C) = −(8.6 ± 1.25)·x(mol%) + (204 ± 26.19) | (5) |
where
x is the Ta
5+ mol% content. The rates of decrease for
TC and
TO–T are 4.6 °C/mol% Ta and 8.6 °C/mol% Ta, respectively. The shift of the phase transitions is attributed to the different electronegativity
9 of Ta
5+ and Nb
5+ and the change in the Goldschmidt tolerance factor
t.
41 The latter can be expressed as,
| |  | (6) |
where
RA,
RB and
RO are the ionic radii of the corresponding perovskite sites. The tolerance factor decreases slightly after more B sites are occupied by the smaller Ta
5+ and therefore the degree of lattice distortion is reduced with increasing Ta
5+ content. The lower electronegativity of Ta
5+ also weakens the B–O bond and therefore the off-center movement ability of the B-site ions during the cubic–tetragonal phase transition is decreased.
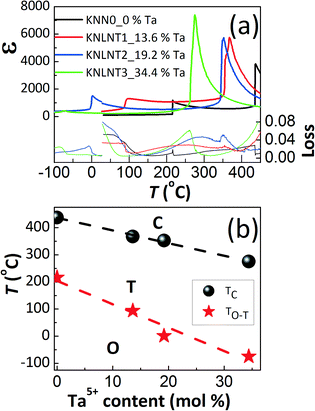 |
| | Fig. 5 (a) Temperature-dependent dielectric permittivity and losses of the [001]PC-oriented KNLTN single crystals during heating from −100 °C to 450 °C (10 kHz), and (b) phase transition temperatures (TC and TO–T) as a function of Ta5+ content. The minor discontinuity at 30 °C is related to the use of different measurement setups for the low and high temperature range. | |
The influence of the K/Na ratio on the phase structure and electrical properties in polycrystalline (K,Na)NbO3 ceramics was previously discussed by Zhang et al.42 By changing the K/Na ratio from 70/30 to 30/70, both phase transition temperatures TC and TO–T decreased by less than 10 °C. Similar results were also obtained by others.43,44 It can therefore be concluded that the observed changes in TC and TO–T are predominantly related to the Ta5+ content and the influence of the K/Na ratio can be neglected. The relative dielectric permittivities εr/ε0 of KNN0, KNLTN1, KNLTN2 and KNLTN3 at 30 °C are 107, 371, 964 and 231, respectively (Fig. 5(a)). KNLTN2 with 19.2% Ta5+ displays the highest dielectric permittivity at room temperature. Note also that this value is higher than the values from most other literature reports (see Table 1).
Fig. 6(a) depicts the bipolar electric-field-induced strain curves (S–E) of the [001]PC-oriented KNLTN single crystals. All samples exhibit typical butterfly-shaped S–E loops with an evident negative strain (Sneg).5,45 The unipolar strain curves are depicted in (b). KNLTN2 presents the highest bipolar and unipolar strains at the maximum investigated E-field of 2 kV mm−1. This is due to the proximity of its TO–T to room temperature, whereby the energy barrier for polarization rotation decreases, leading to increased strain values.
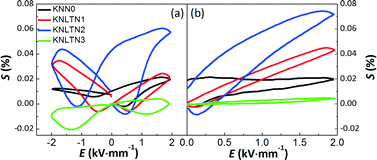 |
| | Fig. 6 Electric-field-induced (a) bipolar and (b) unipolar strains of the [001]PC-oriented KNLTN single crystals under 2 kV mm−1 and 10 Hz. | |
The electric field corresponding to the largest absolute value in Sneg was taken as coercive field EC.46,47 The asymmetry in the strain curves in Fig. 6(a) can be explained by the existence of an internal bias field Ei. The measured internal bias fields are approximately 20% of the corresponding coercive fields, as shown in Fig. 7(a). Although the origin of the internal bias fields in these samples is not clear, it might originate from the defect dipoles present in the as-grown single crystals. It is expected that the A-site elements K+, Na+, and Li+ evaporate from the crystal during the high-temperature growth process, creating
| |  |
(8)
|
vacancies.
48 As a consequence, oxygen vacancies
| |  |
(9)
|
were also created during the perovskite formation due to charge compensation. This could lead to the formation of
| |  |
(10)
|
defect dipoles,
49 which might be responsible for the observed internal bias field and the asymmetry of the bipolar
S–
E loops.
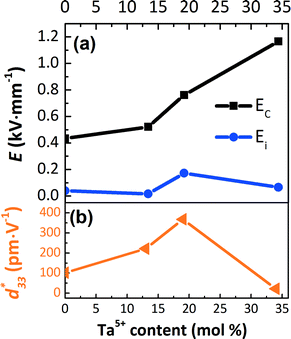 |
| | Fig. 7 (a) EC, Ei, and (b) piezoelectric constant d33* at 2 kV mm−1 of the [001]PC-oriented KNLTN single crystals with different Ta5+ contents. | |
The coercive field EC and internal field Ei were calculated by eqn (7) and (8) and are provided in Fig. 7(a).
| |  | (7) |
| |  | (8) |
where
EC+ and
EC− represent the positive and negative coercive fields, respectively.
In Fig. 6(a), the maximum positive strain Spos of the [001]PC-oriented KNLTN crystals was 0.06% when the Ta5+ content reached 19.2%. However, further increase in the Ta5+ content up to 34.4% leads to a significant decrease in Spos. KNLTN3 with 34.4% Ta5+ has a much larger absolute Sneg value compared to its Spos value. This phenomenon was previously observed in 0.62Pb(Mg1/3Nb2/3)O3–0.38PbTiO3 (PMN-PT) single crystals.46 It has been explained that the depolarization field and internal stresses are too small to produce significant back-switching of polarization in the absence of grain boundaries. However, studies of lead-based single crystals revealed that the shape of the bipolar strain curves depends on the crystallographic orientation and phase structure.50
Fig. 7(a) shows that the EC of KNLTN3 is more than 2 times higher than those of other crystals with lower Ta5+ contents. Increasing the Ta5+ content leads to a remarkable increase of EC due to the presence of the tetragonal phase. The large-signal converse piezoelectric constants d33* of the [001]PC-oriented KNLTN single crystals is depicted in Fig. 7(b). The d33* values of KNN0, KNLTN1, KNLTN2 and KNLTN3 measured at 2 kV mm−1 are 102, 221, 368 and 22 pm V−1, respectively. KNLTN2 crystal has the highest d33* value due to the proximity of the TO–T to room temperature.
Fig. 8 displays the ferroelectric hysteresis loop of the [001]PC-oriented KNLTN2 single crystal measured at 2 kV mm−1 and 10 Hz. The remanent polarization is approximately 5 μC cm−2 and the coercive field is 0.80 kV mm−1, which is in agreement with the value 0.76 kV mm−1 obtained from the bipolar strain loop. Unfortunately, the ferroelectric loops of other crystals could not be measured due to the high leakage currents. The piezoelectric, ferroelectric and dielectric parameters of all [001]PC-oriented KNLTN single crystals with different Ta5+ contents are summarized in Table 4.
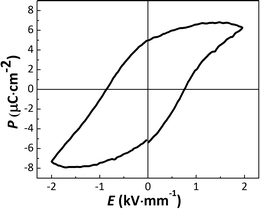 |
| | Fig. 8 Ferroelectric hysteresis loop of the [001]PC-oriented KNLTN2 single crystal under 2 kV mm−1 and 10 Hz. | |
Table 4 Piezoelectric, ferroelectric and dielectric parameters of the [001]PC-oriented KNLTN single crystals with different Ta5+ contents
| SAMPLE (Ta5+ mol%) |
d
33
* (pm V−1) |
S
pos (%), Bia |
–Sneg (%), Bia |
S
max (%), Unib |
E
C (kV mm−1) |
E
i (kV mm−1) |
ε
r (RT) |
ε
max (TC) |
T
O–T (°C) |
T
C (°C) |
|
Obtained from bipolar strain curves.
Obtained from unipolar strain curves.
|
| KNN0 (0) |
102 |
0.020 |
0.002 |
0.020 |
0.44 |
0.040 |
107 |
3814 |
216 |
437 |
| KNLTN1 (13.4) |
221 |
0.024 |
0.005 |
0.044 |
0.52 |
0.017 |
371 |
5765 |
94 |
367 |
| KNLTN2 (19.2) |
368 |
0.060 |
0.008 |
0.074 |
0.76 |
0.172 |
964 |
5743 |
1 |
352 |
| KNLTN3 (34.4) |
22 |
0.004 |
0.008 |
0.004 |
1.17 |
0.065 |
231 |
7394 |
-75 |
275 |
Conclusions
Li+- and Ta5+-modified KNN single crystals were grown by the TSSG method and centimeter-sized boules were successfully obtained. The effective segregation coefficients with respect to the initial concentrations of individual elements in the liquid were studied. Whereas Ta5+ and Nb5+ concentrations measured in the single crystals are consistent with the literature, the alkali elements (Li+, Na+ and K+) are strongly dependent on each other with regards to their incorporation into the lattice as well as the volatilization of the solution during the growth, particularly for Li+. XRD and Raman measurements determine the transition from the orthorhombic to the tetragonal phase with increasing Ta5+ content. A linear decrease in the phase transition temperatures (TC and TO–T) was found with increasing Ta5+ content. The highest strain and large-signal piezoelectric coefficient of 368 pm V−1 were observed in the [001]PC-oriented single crystal with 19.2% Ta5+, which was ascribed to the proximity of the TO–T to room temperature. In addition, the observed internal fields might be related to the presence of | |  |
(13)
|
defect dipoles created during the high-temperature crystal growth, and were found to contribute to the asymmetry of bipolar strain curves.
Acknowledgements
This work was supported by the Erasmus Mundus international doctoral school IDS-FunMat under the project number 2013-07 and the German-French Doctoral School. The authors thank Dr. Nicolas Penin and Mrs. Laetitia Etienne for ICP-OES analysis at ICMCB. The authors are also grateful to Dr. Michel Lahaye for EPMA and Mr. Eric Lebraud for XRD measurements at ICMCB.
References
- J. Rödel, W. Jo, K. T. Seifert, E. M. Anton, T. Granzow and D. Damjanovic, J. Am. Ceram. Soc., 2009, 92, 1153–1177 CrossRef.
- J. F. Li, K. Wang, F. Y. Zhu, L. Q. Cheng and F. Z. Yao, J. Am. Ceram. Soc., 2013, 96, 3677–3696 CrossRef CAS.
- T. R. Shrout and S. J. Zhang, J. Electroceram., 2007, 19, 113–126 CrossRef.
- T. Takenaka, K.-I. Maruyama and K. Sakata, Jpn. J. Appl. Phys., Part 1, 1991, 30, 2236 CrossRef CAS.
- W. Jo, R. Dittmer, M. Acosta, J. Zang, C. Groh, E. Sapper, K. Wang and J. Rödel, J. Electroceram., 2012, 29, 71–93 CrossRef CAS.
- W. Liu and X. Ren, Phys. Rev. Lett., 2009, 103, 257602 CrossRef PubMed.
- H. Liu, Q. Li, Y. Li, N. Luo, J. Shim, J. Gao, Q. Yan, Y. Zhang and X. Chu, J. Am. Ceram. Soc., 2014, 97, 2076–2081 CrossRef CAS.
- D. R. Brandt, M. Acosta, J. Koruza and K. G. Webber, J. Appl. Phys., 2014, 115, 204107 CrossRef.
- Y. Saito, H. Takao, T. Tani, T. Nonoyama, K. Takatori, T. Homma, T. Nagaya and M. Nakamura, Nature, 2004, 432, 84–87 CrossRef CAS PubMed.
- J. Wu, D. Xiao and J. Zhu, Chem. Rev., 2015, 115, 2559–2595 CrossRef CAS PubMed.
- Y. F. Chang, Z. P. Yang, D. F. Ma, Z. H. Liu and Z. L. Wang, J. Appl. Phys., 2009, 105, 054101 CrossRef.
- S. J. Zhang, R. Xia and T. R. Shrout, Appl. Phys. Lett., 2007, 91, 132913 CrossRef.
- Z. Y. Shen, K. Wang and J. F. Li, Appl. Phys. A: Mater. Sci. Process., 2009, 97, 911–917 CrossRef CAS.
- E. K. Akdoğan, K. Kerman, M. Abazari and A. Safari, Appl. Phys. Lett., 2008, 92, 112908 CrossRef.
- Y. Saito and H. Takao, Ferroelectrics, 2006, 338, 17–32 CrossRef CAS.
- S. J. Zhang and F. Li, J. Appl. Phys., 2012, 111, 031301 CrossRef.
- X. Huo, R. Zhang, L. Zheng, S. Zhang, R. Wang, J. Wang, S. Sang, B. Yang and W. Cao, J. Am. Ceram. Soc., 2015, 98, 1829–1835 CrossRef CAS PubMed.
- H. Uršič, A. Benčan, M. Škarabot, M. Godec and M. Kosec, J. Appl. Phys., 2010, 107, 033705 CrossRef.
- H. Tian, C. Hu, X. Meng, P. Tan, Z. Zhou, J. Li and B. Yang, Cryst. Growth Des., 2015, 15, 1180–1185 Search PubMed.
-
K. A. Jackson, Kinetic Processes: Crystal Growth, Diffusion, and Phase Transformations in Materials, Wiley, New York, 2004 Search PubMed.
- M. Prakasam, P. Veber, O. Viraphong, L. Etienne, M. Lahaye, S. Pechev, E. Lebraud, K. Shimamura and M. Maglione, C. R. Phys., 2013, 14, 133–140 CrossRef CAS.
- X. Huo, L. Zheng, R. Zhang, R. Wang, J. Wang, S. Sang, Y. Wang, B. Yang and W. Cao, CrystEngComm, 2014, 16, 9828–9833 RSC.
- X. Q. Huo, L. M. Zheng, S. J. Zhang, R. Zhang, G. Liu, R. Wang, B. Yang, W. W. Cao and T. R. Shrout, Phys. Status Solidi RRL, 2014, 8, 86–90 CrossRef CAS PubMed.
- L. M. Zheng, X. Q. Huo, R. Wang, J. J. Wang, W. H. Jiang and W. W. Cao, CrystEngComm, 2013, 15, 7718–7722 RSC.
- L. M. Zheng, J. J. Wang, X. Q. Huo, R. Wang, S. J. Sang, S. Y. Li, P. Zheng and W. W. Cao, J. Appl. Phys., 2014, 116, 044105 CrossRef PubMed.
- M. Bah, F. Giovannelli, R. Retoux, J. Bustillo, E. L. Clezio and I. Monot-Laffez, Cryst. Growth Des., 2016, 16, 315–324 Search PubMed.
- Y. Liu, G. Xu, J. Liu, D. Yang and X. Chen, J. Alloys Compd., 2014, 603, 95–99 CrossRef CAS.
- K. Chen, G. S. Xu, D. F. Yang, X. F. Wang and J. B. Li, J. Appl. Phys., 2007, 101, 044103 CrossRef.
- H. Deng, X. Y. Zhao, H. W. Zhang, C. Chen, X. B. Li, D. Lin, B. Ren, J. Jiao and H. S. Luo, CrystEngComm, 2014, 16, 2760–2765 RSC.
- A. Reisman, S. Triebwasser and F. Holtzberg, J. Am. Chem. Soc., 1955, 77, 4228–4230 CrossRef CAS.
- A. Reisman and E. Banks, J. Am. Chem. Soc., 1958, 80, 1877–1882 CrossRef CAS.
- R. Hofmeister, A. Yariv and A. Agranat, J. Cryst. Growth, 1993, 131, 486–494 CrossRef CAS.
- Y. Guo, K.-I. Kakimoto and H. Ohsato, Appl. Phys. Lett., 2004, 85, 4121–4123 CrossRef CAS.
- N. Klein, E. Hollenstein, D. Damjanovic, H. J. Trodahl, N. Setter and M. Kuball, J. Appl. Phys., 2007, 102, 014112 CrossRef.
- A. Sadel, R. Von der Mühll, J. Ravez, J. Chaminade and P. Hagenmuller, Solid State Commun., 1982, 44, 345–349 CrossRef CAS.
- G. E. McGuire, G. K. Schweitzer and T. A. Carlson, Inorg. Chem., 1973, 12, 2450–2453 CrossRef CAS.
- Y. Chang, Z.-P. Yang, D. Ma, Z. Liu and Z. Wang, J. Appl. Phys., 2008, 104, 024109 CrossRef.
- Z. P. Yang, Y. F. Chang and L. L. Wei, Appl. Phys. Lett., 2007, 90, 042911 CrossRef.
- K. i. Kakimoto, K. Akao, Y. Guo and H. Ohsato, Jpn. J. Appl. Phys., 2005, 44, 7064 CrossRef CAS.
- S. Sang, Z. Yuan, L. Zheng, E. Sun, R. Zhang, J. Wang, R. Wang, B. Yang and M. Liu, Opt. Mater., 2015, 45, 104–108 CrossRef CAS.
- V. M. Goldschmidt, Naturwissenschaften, 1926, 14, 477–485 CrossRef CAS.
- Q. Zhang, B. Zhang, H. Li and P. Shang, Rare Met., 2010, 29, 220–225 CrossRef CAS.
- W. Jiagang, X. Dingquan, Z. Jianguo, Y. Ping and W. Yuanyu, J. Appl. Phys., 2008, 103, 024102 CrossRef.
- L. Wu, J. Zhang, C. Wang and J. Li, J. Appl. Phys., 2008, 103, 4116 Search PubMed.
- J. Fu, R. Z. Zuo, H. Qi, C. Zhang, J. F. Li and L. T. Li, Appl. Phys. Lett., 2014, 105, 242903 CrossRef.
- G. Viola, T. Saunders, X. Wei, K. B. Chong, H. Luo, M. J. Reece and H. Yan, J. Adv. Dielectr., 2013, 03, 1350007 CrossRef.
- A. Achuthan and C. T. Sun, Acta Mater., 2009, 57, 3868–3875 CrossRef CAS.
- A. Popovič, L. Bencze, J. Koruza and B. Malič, RSC Adv., 2015, 5, 76249–76256 RSC.
- R.-A. Eichel, J. Electroceram., 2007, 19, 11–23 CrossRef.
- S.-E. Park and T. R. Shrout, J. Appl. Phys., 1997, 82 Search PubMed.
|
| This journal is © The Royal Society of Chemistry 2016 |
Click here to see how this site uses Cookies. View our privacy policy here.  Open Access Article
 c,
Daniel
Rytz
d,
Michael
Josse
ab,
Jürgen
Rödel
c and
Mario
Maglione
ab

![[3 with combining macron]](https://www.rsc.org/images/entities/char_0033_0304.gif) 1]O-oriented single crystals.
1]O-oriented single crystals.
![[thin space (1/6-em)]](https://www.rsc.org/images/entities/char_2009.gif) :
:![[thin space (1/6-em)]](https://www.rsc.org/images/entities/char_2009.gif) Mn
Mn![[thin space (1/6-em)]](https://www.rsc.org/images/entities/char_2009.gif) :
:![[thin space (1/6-em)]](https://www.rsc.org/images/entities/char_2009.gif) Mn
Mn![[thin space (1/6-em)]](https://www.rsc.org/images/entities/char_2009.gif) :
:![[thin space (1/6-em)]](https://www.rsc.org/images/entities/char_2009.gif) Mn
Mn


