DOI:
10.1039/C5CE02430G
(Paper)
CrystEngComm, 2016,
18, 2046-2056
Decrease of the required dopant concentration for δ-Bi2O3 crystal stabilization through thermal quenching during single-step flame spray pyrolysis†
Received
11th December 2015
, Accepted 28th January 2016
First published on 28th January 2016
Abstract
δ-Bi2O3 is one of the best oxygen ion conductors known. However, due to its limited thermal stability and complicated synthesis techniques, its applications are limited. Here, the synthesis of stable nano-sized δ-Bi2O3 using versatile and rapid flame spray pyrolysis (FSP) combined with in situ Ti and/or Mn doping for an enhanced thermal stability is reported for the first time. Exceptionally low Bi replacing cation concentrations (8 at% Ti) were sufficient to obtain phase-pure δ-Bi2O3 which was attributed to the extraordinarily high temperature gradient during FSP. The required cation amount for δ-phase stabilization was even further reduced by introducing mixtures of Mn and Ti (2.5 at% Mn + 2.5 at% Ti). Rietveld analysis revealed that the δ-Bi2O3 structure is best represented by the Fm![[3 with combining macron]](https://www.rsc.org/images/entities/char_0033_0304.gif) m space group containing two closely neighbored 8c and 32f Wyckoff positions. Depending on the amount of Mn/Ti cations, about 25% of the possible oxygen positions remain vacant, suggesting high bulk oxygen mobility. The enhanced oxygen mobility was confirmed by temperature programmed reduction (H2-TPR) with bulk reduction for δ-Bi2O3 in contrast to exclusive surface reduction for β-Bi2O3.
m space group containing two closely neighbored 8c and 32f Wyckoff positions. Depending on the amount of Mn/Ti cations, about 25% of the possible oxygen positions remain vacant, suggesting high bulk oxygen mobility. The enhanced oxygen mobility was confirmed by temperature programmed reduction (H2-TPR) with bulk reduction for δ-Bi2O3 in contrast to exclusive surface reduction for β-Bi2O3.
Introduction
Tuning the crystal structure of polymorphic metal oxides can yield materials with unique properties such as TiO2 with a modified anatase/rutile ratio for improved photocatalysis1,2 or cubic ZrO2 stabilized by Y3+ for solid oxide fuel cells (SOFCs).3 A polymorphic material that gained increasing attention is Bi2O3 as its high-temperature δ-phase exhibits the highest oxygen ion conductivity among the known oxide ceramics.4–6 Ion conductivity in solid oxides originates from the hopping of oxygen ions within the crystal structure to adjacent equivalent but vacant oxygen sites.7,8 The reason for the extraordinarily high oxygen mobility in δ-Bi2O3 was attributed to the high number of oxygen vacancies the δ-phase naturally possesses.9,10 However, cubic δ-Bi2O3 is only thermodynamically stable at 729–824 °C,9,10 while the metastable β- or γ-Bi2O3 and stable α-Bi2O3 phases are formed during the cooling,6,11 significantly complicating the synthesis of δ-Bi2O3 and limiting its use in different applications. Numerous attempts were made to extend the low-temperature stability of δ-Bi2O3 such as electrodeposition on single and polycrystalline Au as well as on stainless steel substrates.10,12 Reactive sputtering13 and chemical vapor deposition14 are also known to be suitable techniques for obtaining pure thin-film δ-Bi2O3. Another approach for stabilizing δ-Bi2O3 at lower temperatures is through the formation of solid solutions by partially replacing Bi with other cations.15–18 The most commonly used cations (referred to as dopants in spite of the high concentrations) for this purpose are the lanthanides, yttrium and a few other transition metals.9,15,19 However, admixing foreign metal ions potentially lowers the cation polarizability of δ-Bi2O3, and as such, low dopant concentrations are desirable for stabilizing δ-Bi2O3.16 Co-doping with more than one cation was shown to reduce the required amount of dopants due to the increased structural and mixing entropies.16,20 To date, however, the required amount of dopants is commonly larger than 12 at%, while requiring costly and time-consuming processing such as solid-state reactions and wet chemical routes.5,15–17,20,21
Here, we introduce the rapid synthesis of δ-Bi2O3 nanoparticles using flame spray pyrolysis (FSP). The FSP method is an elegant and industrially relevant single-step technique for the synthesis of nanosized metal oxides.22 The extraordinarily high quenching rates associated with the flame synthesis resulted in many metastable phases with precisely controlled composition of both the dopants and the host matrix.23,24 The rapid quenching nature of the FSP method affords exceptionally low concentrations of Ti and/or Mn dopants to yield δ-phase Bi2O3 stable at room temperature.
Experimental section
Material preparation
A single-nozzle flame spray pyrolysis (FSP)22 method was utilized for the synthesis of Ti- and Mn-doped Bi2O3 particles. The required amounts of titanium(IV) isopropoxide (97%; Aldrich), bismuth neodecanoate (Aldrich), and manganese(II) 2-ethylhexanoate (40% in mineral spirits; Strem Chemicals) were dissolved in xylene (≥99.5%; Aldrich) for an overall metal concentration of 0.5 M (see Table 1). Subsequently, 5 mL min−1 precursor solution was fed to the nozzle with a syringe pump, dispersed into fine droplets by 5 L min−1 O2, and inflamed by a 1.5 L min−1 CH4/3.2 L min−1 O2 supporting flame. The pressure drop at the nozzle tip was kept constant at 1.5 bar. The particles were collected on GF/D (Whatman) glass fiber filters of 25.7 cm diameter, from which they were recovered for further analyses. A MnOx reference sample was synthesized for UV/vis analyses with identical flame parameters and a 0.5 M solution of manganese(II) 2-ethylhexanoate (40% in mineral spirits; Strem Chemicals) in xylene.
Table 1 The sample composition, BET specific surface areas (SSA), primary particle diameter (dBET), crystal phases, and the optical bandgap (Eg) of pristine and doped Bi2O3 samples as-prepared with flame spray pyrolysis
| Sample |
Mn at% |
Ti at% |
Bi at% |
SSA m2 g−1 |
d BET nm |
Major crystal phase |
E g eV |
| Values were calculated assuming spherical particles. Densities determined using Rietveld analysis. Theoretically calculated densities. |
| β-Bi2O3 |
0 |
0 |
100 |
32 |
20a |
β |
2.3 |
| 2%Ti–Bi2O3 |
0 |
2 |
98 |
41 |
16b |
β + δ |
2.4 |
| 4%Ti–Bi2O3 |
0 |
4 |
96 |
45 |
15b |
β + δ |
2.6 |
| 5%Ti–Bi2O3 |
0 |
5 |
95 |
— |
— |
β + δ |
2.6 |
| 6%Ti–Bi2O3 |
0 |
6 |
94 |
49 |
14b |
β + δ |
2.7 |
| 8%Ti–Bi2O3 |
0 |
8 |
92 |
50 |
13b |
δ |
2.7 |
| 10%Ti–Bi2O3 |
0 |
10 |
90 |
45 |
15a |
δ |
2.8 |
| 5%Mn–Bi2O3 |
5 |
0 |
95 |
46 |
15b |
β |
— |
| 10%Mn–Bi2O3 |
10 |
0 |
90 |
45 |
16a |
δ |
1.9 |
| 1%Mn–1%Ti–Bi2O3 |
1 |
1 |
98 |
— |
— |
β + δ |
— |
| 2.5%Mn–2.5%Ti–Bi2O3 |
2.5 |
2.5 |
95 |
44 |
15a |
δ |
— |
| 5%Mn–5%Ti–Bi2O3 |
5 |
5 |
90 |
46 |
15a |
δ |
1.6 |
Instruments and characterization
Transmission electron microscopy (TEM) was carried out using a FEI Titan 80/300 ST electron microscope equipped with a corrector for spherical aberration of the objective lens and a Gatan imaging filter (GIF) for electron energy loss spectroscopy (EELS). Samples for TEM were prepared by dispersing the particles in acetone and dripping the solution on Cu grids covered with a thin amorphous carbon film. The Bi2O3 particle size was determined from TEM by measuring at least 100 particles per sample. The Mn oxidation state was determined using an EELS method reported by Cavé et al.25 A power law background was fitted to a region before the Mn L2,3 edge and then subtracted from the signal yielding the Mn L2,3 edge (ESI,† Fig. S1). The double arctan background was fitted to the Mn L2,3 edge and the intensity between the background in the L2 and the L3 peak was integrated within 4 eV windows. Room temperature XRD patterns were measured using a Philips PW1800 diffractometer equipped with Cu Kα radiation produced at 40 kV and 30 mA. A secondary monochromator with a classical point detector and an automatic divergence slit fixing the beam spot on the sample to a length of 2 mm was used. High-temperature XRD measurements were performed using a PANalytical X'Pert MPD Pro diffractometer equipped with secondarily Ni-filtered Cu Kα radiation (45 kV and 40 mA), an Anton Paar HTK1200N heating chamber and an X'Celerator detector. The binding energies were measured with X-ray photoelectron spectroscopy (XPS, Physical Electronics, PHI-5802) equipped with a monochromated Al Kα X-ray source at 11.75 eV pass energy and were referenced with the C 1s peak at 284.7 eV. H2 temperature programmed reduction (H2-TPR) was measured with an AutoChem 2950 HP Chemisorption Analyzer (Micromeritics) and connected MicroStar Mass Spectrometer (Micromeritics). About 20 mg of as-synthesized sample were placed in a quartz tube, cooled to 0 °C under Ar flow with the aid of a CryoCooler (Micromeritics), and heated to 600 °C at 10 °C min−1 under 50 mL min−1 of 5% H2/Ar flow.
Temporal analysis of products
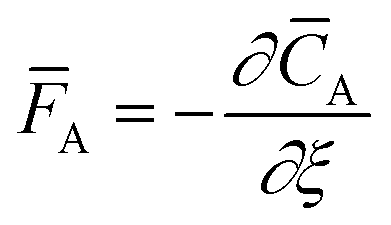
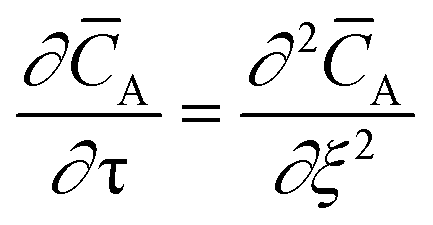
The temporal analysis of products (TAP) was measured with a TAP-2 reactor (Mithra Technologies, Inc.). The powder samples were pressed at 180 kg cm−2, ground and sieved to a fraction of 125–400 μm. From the as-prepared pellets 100 mg were placed in a quartz reactor (inner diameter 3.8 mm) between two layers of quartz beads with 125–200 μm diameter. A thermocouple inside the catalyst zone was used for the temperature control. Prior to the experiments the samples were pretreated with 20 mL min−1 He at 250 °C for 1 h, after which the reactor was evacuated (<8 × 10⁻⁸ torr). Small and ultrashort pulses of 66.7% 18O2 in Ar were exposed to the sample while the reactor outlet gases were monitored using a mass spectrometer (m/z = 40, 32, 34, and 36 for Ar, 16O2, 16O18O, and 18O2, respectively). The Knudsen diffusion regime was validated by varying the O2/Ar pulse size and fitting the Ar signal to the dimensionless exit flow ![[F with combining macron]](https://www.rsc.org/images/entities/i_char_0046_0304.gif) A based on the dimensionless diffusion equation:26
A based on the dimensionless diffusion equation:26| |
 | (1) |
| |
 | (2) |
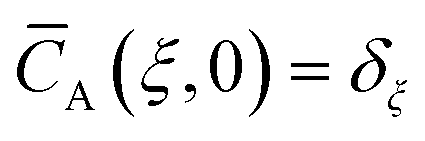
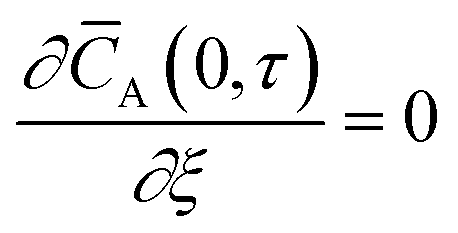
Initial and boundary conditions:
| |
 | (3) |
| |
 | (4) |
| |
 | (5) |
with
![[C with combining macron]](https://www.rsc.org/images/entities/i_char_0043_0304.gif) A
A and ξ being the dimensionless concentration and axial coordinate, respectively, and the delta function
δξ. The dimensionless time
τ is defined as:
26| |
 | (6) |
with the time
t, effective Knudsen diffusivity
DeA, fractional voidage of the reactor bed
εb and reactor length
L. Within the catalyst zone, gas adsorption and desorption was considered using the reversible adsorption equation:
26| |
 | (7) |
with the dimensionless surface coverage
![[small theta, Greek, macron]](https://www.rsc.org/images/entities/i_char_e0c9.gif) A
A and the adsorption and desorption rate constants
![[k with combining macron]](https://www.rsc.org/images/entities/i_char_006b_0304.gif) a
a and
d.
Eqn (2) and
(7) were converted to ordinary differential equations by the method of lines and solved with the initial and boundary conditions (3)–(5) with the ode15s solver in Matlab. The constants
DeA·
εb−1·
L−2 in
eqn (6) and
a and
d in
eqn (7) were determined by varying their value independently until the best fit between the solution of
eqn (1) and the experimental peak shape was achieved. Experiments without any catalyst (
i.e., only with quartz beads) were conducted to quantify the Ar to
18O
2 peak area ratio for 100% O
2 exiting the reactor (
i.e., no O
2 consumed; referred to as “Inlet O
2” in the manuscript) and was used to identify possible consumptions of oxygen during the experiments.
Results and discussion
Particle morphology and structural characterization
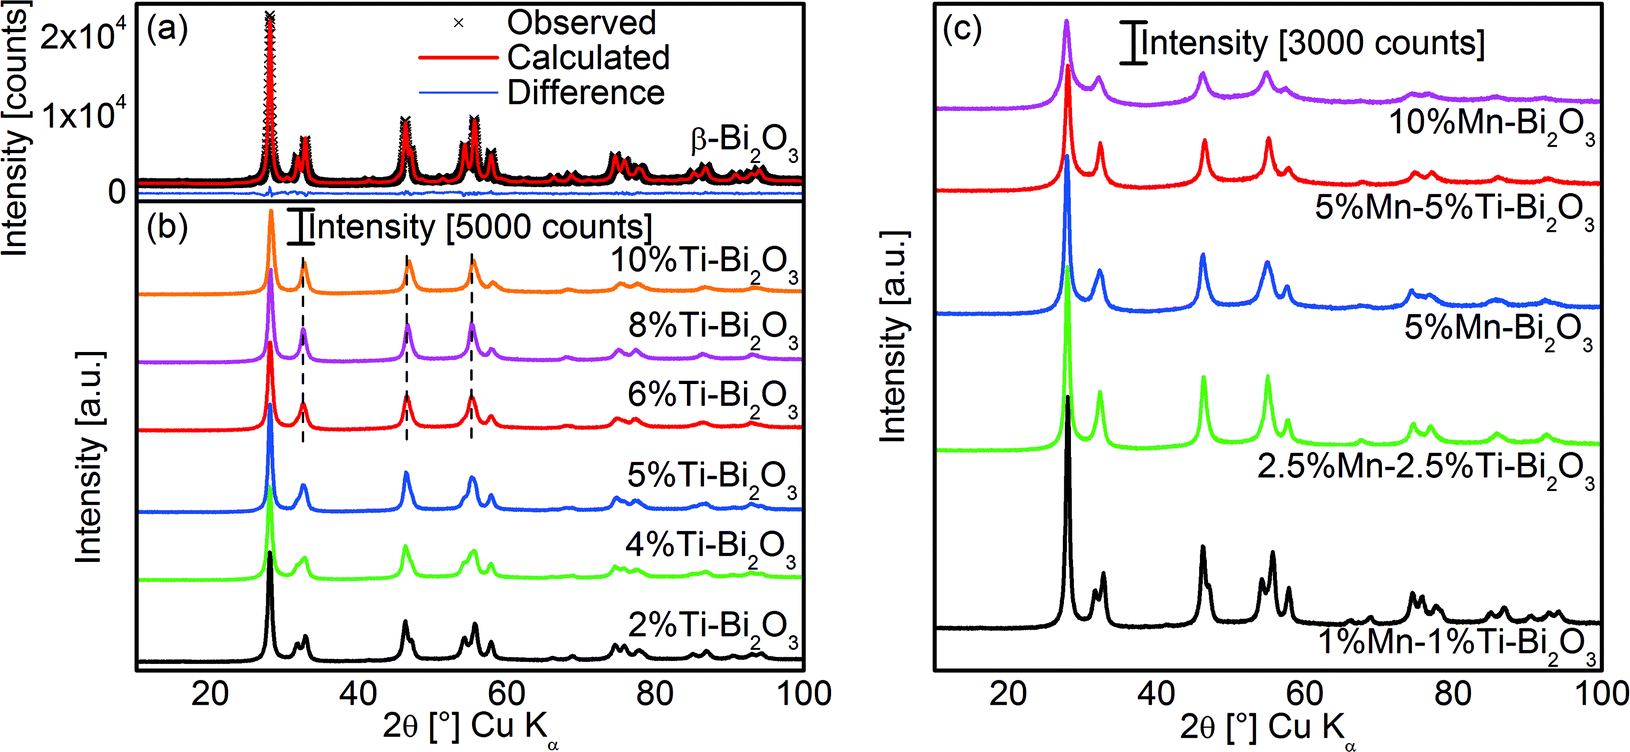
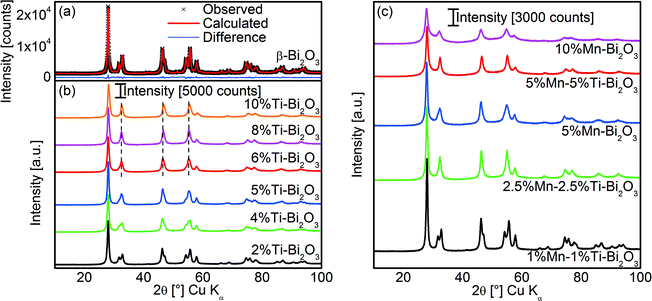
Flame spray pyrolysis (FSP) of the organometallic precursor consisting of bismuth neodecanoate in xylene resulted in tetragonal β-Bi2O3 as shown from the XRD pattern and Rietveld analysis in Fig. 1a. This is consistent with an earlier work using dissolved bismuth nitrate in acetic acid as the liquid precursor.27 As mentioned earlier, β-Bi2O3 is a metastable phase formed during the cooling from high temperatures.6 In the case of xylene-based precursor, the flame temperature could be as high as 2130 °C at the ignition point before being rapidly quenched at approximately 170 °C cm−1 within the flame to ∼800 °C at the tip of the flame.24 Along the flame axis, combustion of the liquid metal precursor resulted in a metal/metal oxide vapor that was quickly followed by the sequential aerosol particle formation processes of nucleation, coalescence, aggregation and agglomeration.28
 |
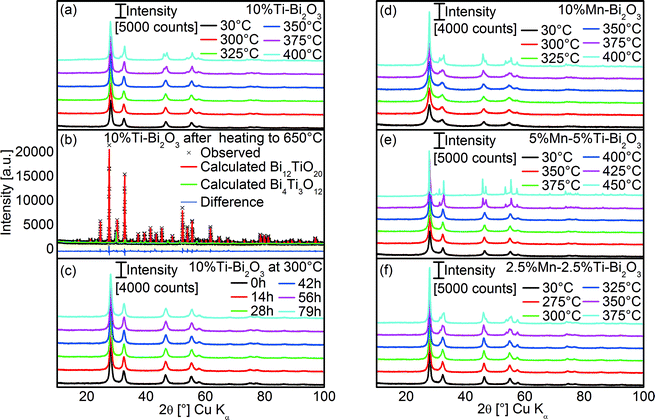
| | Fig. 1 (a) The Rietveld refinement fit of the XRD pattern of flame-prepared pristine β-Bi2O3 and (b) the corresponding patterns with increasing amounts of Ti dopant. (c) The XRD patterns of flame-prepared Bi2O3 doped with different amounts of Mn and that co-doped with Ti. | |
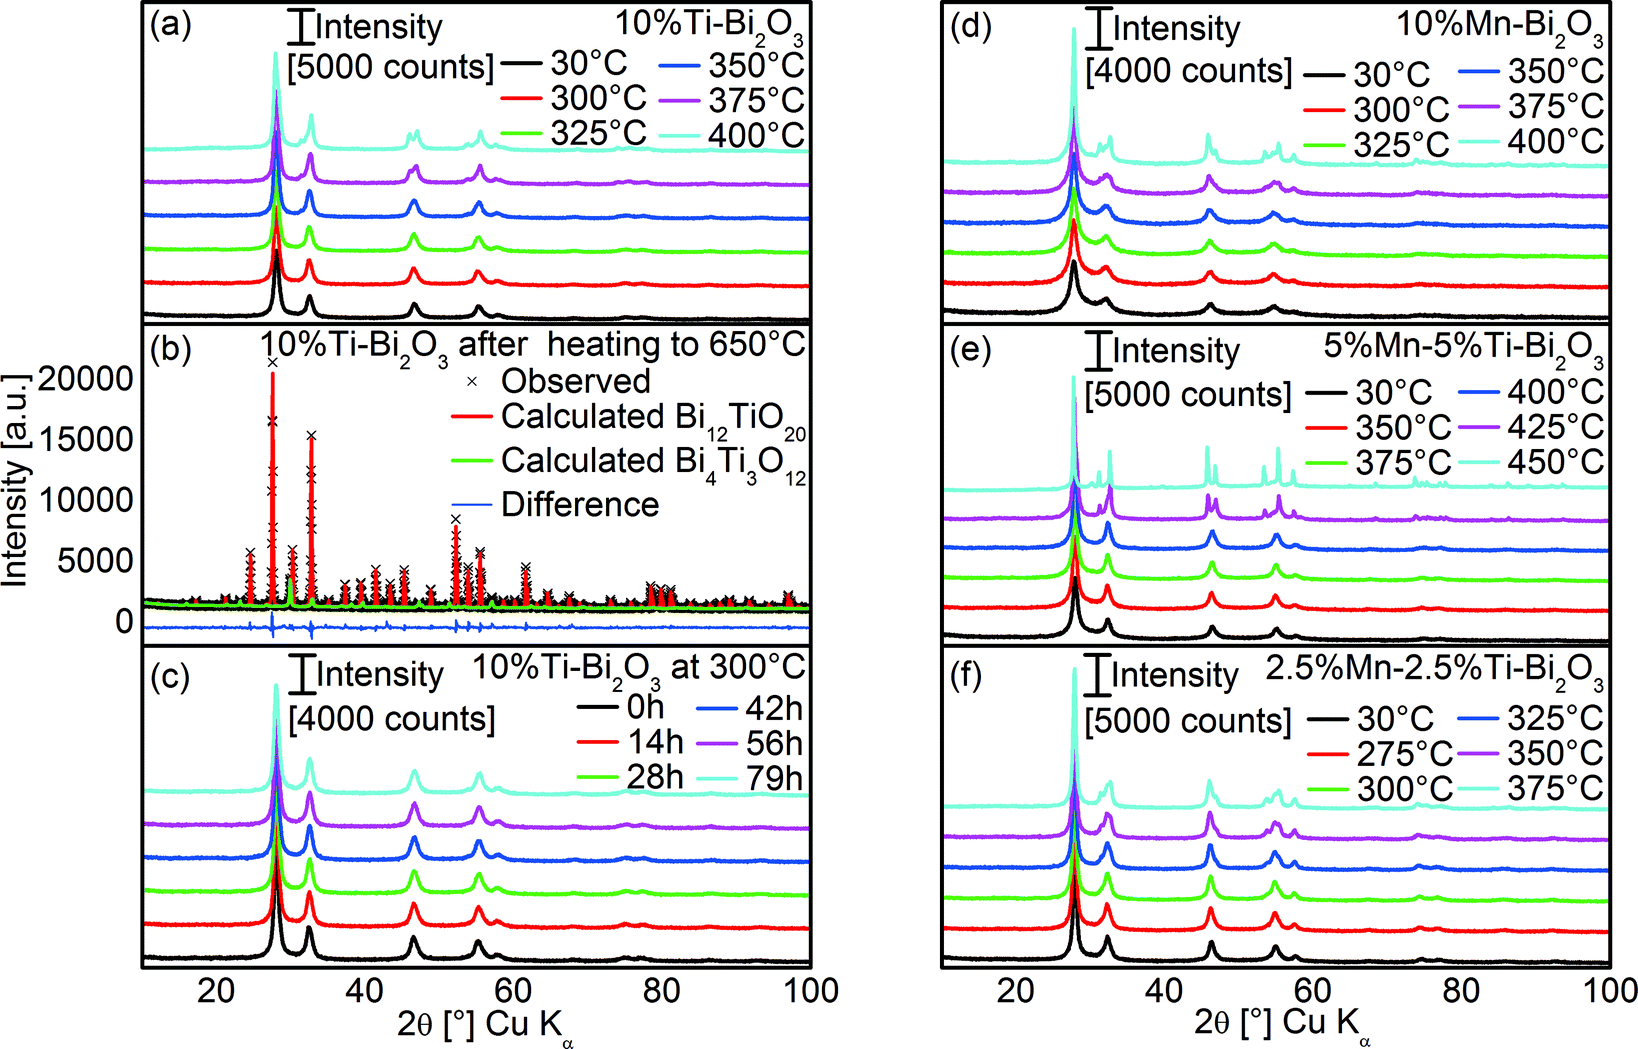
The doping of Bi2O3 was carried out by co-dissolving titanium isopropoxide and/or manganese 2-ethylhexanoate in the original precursor formulation. As shown in Fig. 1b, the doping of Ti resulted in the gradual transformation of β-Bi2O3 to δ-Bi2O3 as evident from the merging of diffraction peaks at 32°, 46.5°, 55° and 75°. Essentially, pure δ-Bi2O3 was obtained at 8 at% Ti. Here, the doping of Ti stabilized the δ-Bi2O3 phase during rapid flame particle formation and suppressed the transformation to β-Bi2O3 during the cooling process. A further increase to 10 at% Ti shifted the diffraction peaks towards higher Bragg angles as a result of the shrinkage in lattice parameters from the substitutional replacement of hexacoordinated Bi3+ (ionic radius 0.103 nm)29 with the smaller Ti4+ ions (ionic radius 0.0605 nm; see XPS below for Ti oxidation state).29 Depending on the preparation conditions and Ti content, other reports on techniques without rapid quenching/cooling resulted in ternary phases such as Bi12TiO20, and Bi4Ti3O12 or β-Bi2O3.30,31 In the case of FSP, the small amount of Ti coupled with the short residence time in the flame prevented the crystallization of ternary oxides. More importantly, the combination of doping and rapid quenching resulted in room temperature stable δ-Bi2O3 phase.
The studies of in situ flame doping were extended to that of a lower valency dopant, namely Mn2+. As shown in Fig. 1c, the doping with 5 at% Mn resulted in the mixture of β- and δ-Bi2O3, while at 10 at% dopant, the latter structure was fully preserved. As a result of the similar ionic radii of hexacoordinated Bi3+ (0.103 nm)29 and Mn2+ (0.083 or 0.067 nm for high and low spins, respectively; see below, EELS and XPS discussion on Mn valency)29 no changes in the XRD peak positions were observed. With the aim of achieving even lower amounts of dopant, the synergetic effect of Ti4+–Mn2+ co-doping was explored. At 1 at% Ti and 1 at% Mn, the δ-Bi2O3 phase was only partially stabilized, but with increasing equimolar dopant concentrations to 2.5 and 5 at%, full preservation of δ-Bi2O3 was achieved (Fig. 1c). The synergetic effect is believed to be at least in part due to the minimization of aliovalency since the net valency of +3 was preserved (matching the Bi3+ in Bi2O3). This suppresses the alteration of the number of δ-Bi2O3 oxygen vacancies (i.e., increase for Mn2+ and decrease for Ti4+) that otherwise promotes crystal phase transformation.2,32
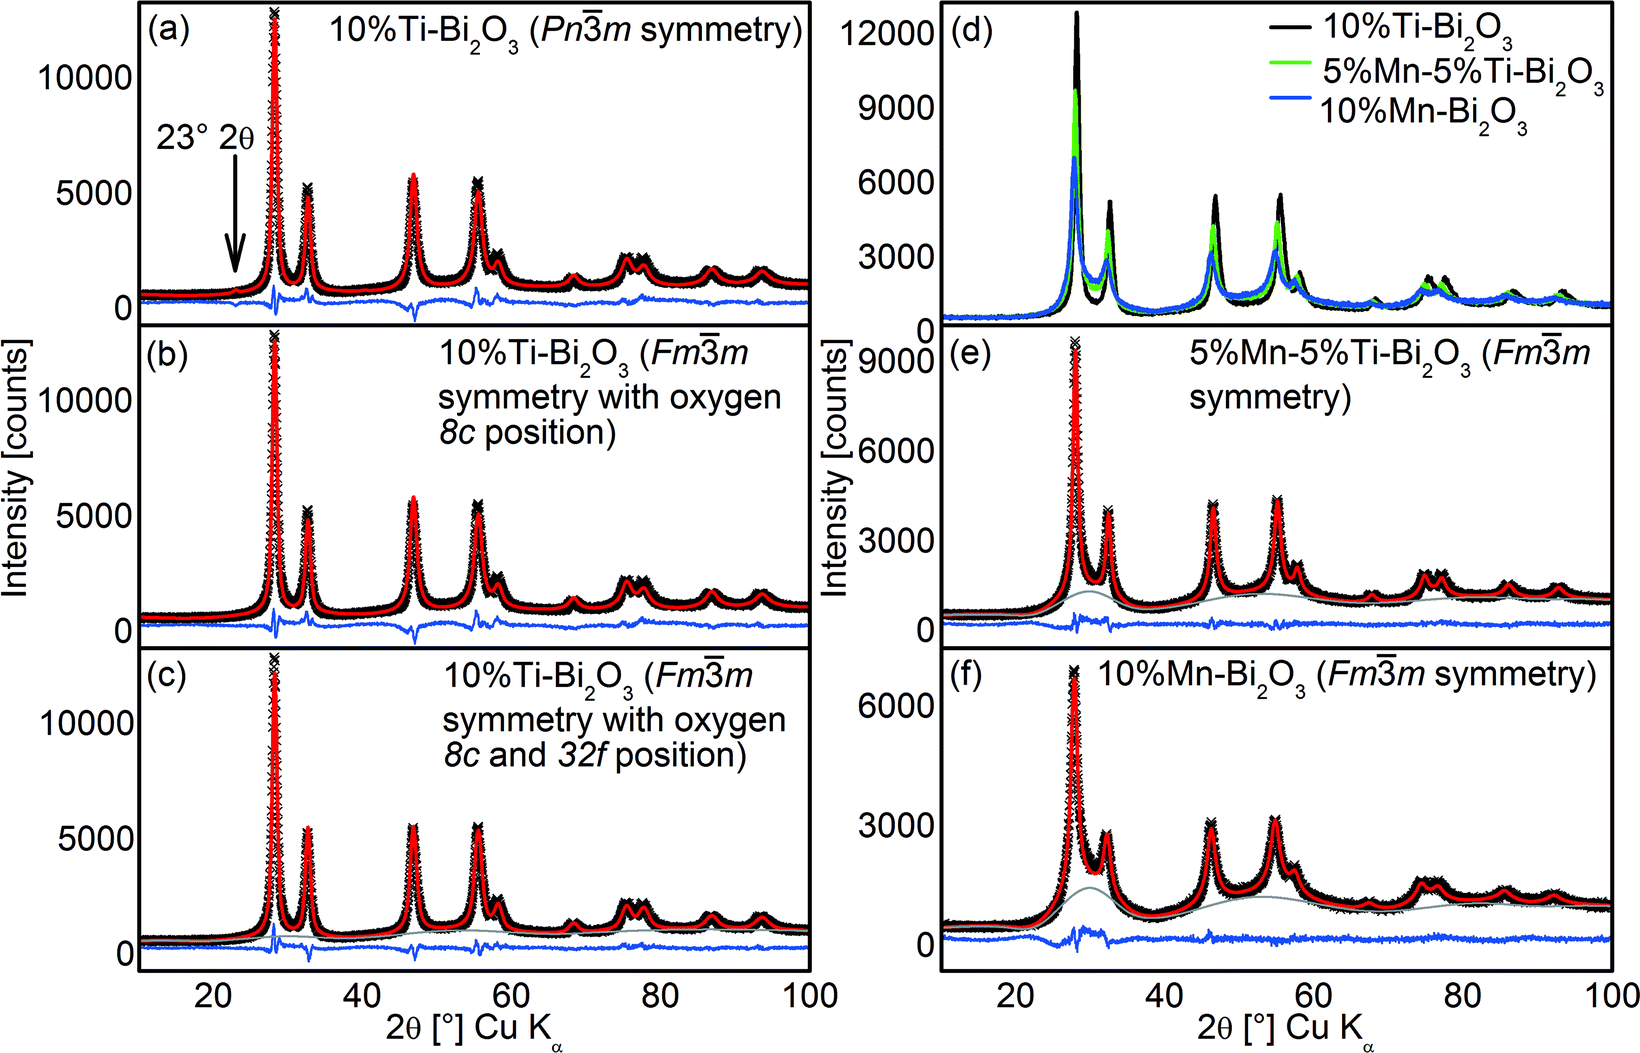
To gain more insights on the crystal structures of the doped δ-Bi2O3, Rietveld analysis of the XRD patterns was carried out with the consideration of three different δ-Bi2O3 models: (a) the Pnm space group with fully occupied six-fold Wyckoff positions 6d (Inorganic Crystal Structure Database, ICSD 37367)33 and two Fmm models with (b) 6 oxygen atoms on the eight-fold Wyckoff positions 8c (ICSD 61647)34 and (c) 6 oxygen atoms on two closely neighbored Wyckoff positions 8c and 32f (ICSD 98144).35 As shown in Fig. 2a, the Pnm symmetry could not adequately describe the flame-synthesized δ-Bi2O3 given the absence of δ-Bi2O3 [011] at 23° 2θ in the FSP-made material. The two Fmm models encompass the same set of reflections but a better description was observed by the model with the oxygen atoms adjacent to 8c and 32f Wyckoff positions (RBragg = 2.97% and Rp′ = 9.44%; Fig. 2c) compared to the alternative model (RBragg = 5.37% and Rp′ = 12.53%; Fig. 2b). The resultant Rietveld-refinement parameters and R-values are listed in Table 2. The crystal structure reported for δ-Bi2O3 at 780 °C differs from the present room temperature material only in the lattice parameter and the partial replacement of Bi by Ti, affirming the successful synthesis of the high-temperature phase with the FSP process. The Rietveld analyses were extended to 5%Mn–5%Ti–Bi2O3 (Fig. 2e) and 10%Mn–Bi2O3 (Fig. 2f), showing excellent agreement between the above Fmm model and the measured diffraction pattern (Table 2). Broad humps in the baseline of samples containing Mn dopants were traced to the aggregation of MnOx clusters, which will be substantiated from XPS and the optical absorbance (shown below). Further to the XRD analyses, the crystallite sizes for 10%Ti–Bi2O3 (12 ± 3 nm), 5%Mn–5%Ti–Bi2O3 (10 ± 2 nm) and 10%Mn–Bi2O3 (8 ± 2 nm) were estimated from the Scherrer equation. These crystallite sizes were consistently smaller than the surface area-equivalent diameter of dBET (Table 1), indicating the presence of sinter necks between the Bi2O3 crystallite particles. The estimated dBET is consistent with that determined by TEM particle counting of β-Bi2O3 (26 ± 9 nm), 2.5%Mn–2.5%Ti–Bi2O3 (15 ± 5 nm), 5%Mn–5%Ti–Bi2O3 (15 ± 6 nm), 5%Ti–Bi2O3 (15 ± 6 nm) and 8%Ti–Bi2O3 (14 ± 5 nm) (Fig. 3). As further illustrated in Fig. 3f–o, the high-resolution TEM images show aggregates of single crystalline particles with lattice spacings belonging to the β-Bi2O3 (021) or δ-Bi2O3 (111) planes.
 |
| | Fig. 2 The Rietveld refinement fits of the XRD pattern of 10%Ti–Bi2O3 using (a) the Pnm symmetry and two Fmm symmetries with (b) ∼6 oxygen ions on the 8c Wyckoff positions and (c) ∼6 oxygen ions on 8c and 32f Wyckoff positions. (d) Direct comparison of the overlaying XRD patterns of 10%Ti–Bi2O3, 5%Mn–5%Ti–Bi2O3 and 10%Mn–Bi2O3 samples. Rietveld refinement fits of the (e) 5%Mn–5%Ti–Bi2O3 and (f) 2.5%Mn–2.5%Ti–Bi2O3 samples. Measured data = black crosses, calculated pattern = red line, difference between measured and calculated pattern = blue line. | |
Table 2 Parameters and R-values obtained from Rietveld refinements for the samples with pure δ-phase
| Sample |
Atom |
Ox |
xyz |
B iso |
SOFa |
R Bragg % |
R wp % |
R p % |
R p′ % |
a Å |
Cryst. sizec nm |
Cryst. microstrainc % |
| SOF = site occupation factor. R Bragg = ∑|Io − Ic|/∑Io, Rwp = √(∑w(yo − yc)2/∑wyo2), Rp = ∑|yo − yc|/∑yo, Rp′ = ∑|yo − yc|/∑|yo − yb|, with integrated intensity I, step intensity y, w = yo−0.5, observation o, calculation c and background b. Crystallite size (via Scherrer equation) and microstrain calculated from phase-specific peak broadening. |
| 10%Ti–Bi2O3 |
Bi1 |
3+ |
0 0 0 |
3.35(5) |
0.01875 |
3.0 |
5.4 |
4.3 |
9.4 |
5.4984(6) |
12(3) |
2.4(2) |
| Ti1 |
4+ |
0 0 0 |
3.35(5) |
0.00208 |
| O1 |
2− |
¼ ¼ ¼ |
3.35(5) |
0.00959 |
| O2 |
2− |
0.324(1) x x |
3.35(5) |
0.02373 |
| 5%Mn–5%Ti–Bi2O3 |
Bi1 |
3+ |
0 0 0 |
3.53(6) |
0.01875 |
2.0 |
4.8 |
3.7 |
11.1 |
5.5338(7) |
10(2) |
1.3(2) |
| Ti1 |
4+ |
0 0 0 |
3.53(6) |
0.00104 |
| Mn1 |
2+ |
0 0 0 |
3.53(6) |
0.00104 |
| O1 |
2− |
¼ ¼ ¼ |
3.53(6) |
0.009 |
| O2 |
2− |
0.331(1) x x |
3.53(6) |
0.02225 |
| 10%Mn–Bi2O3 |
Bi1 |
3+ |
0 0 0 |
2.8(3) |
0.01875 |
2.0 |
5.2 |
3.8 |
12.5 |
5.563(2) |
8(2) |
2.4(3) |
| Mn1 |
2+ |
0 0 0 |
2.8(3) |
0.00208 |
| O1 |
2− |
¼ ¼ ¼ |
2.8(3) |
0.0087 |
| O2 |
2− |
0.304(1) x x |
2.8(3) |
0.02151 |
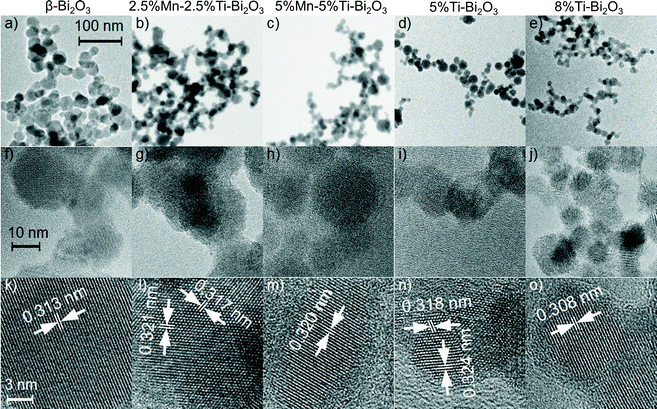 |
| | Fig. 3 Low-resolution bright field images, high-resolution images and the corresponding lattice spacing, respectively of (a, f, k) pristine β-Bi2O3, (b, g, l) 2.5%Ti–2.5%Mn–Bi2O3, (c, h, m) 5%Ti–5%Mn–Bi2O3, (d, i, n) 5%Ti–Bi2O3 and (e, j, o) 8%Ti–Bi2O3 nanoparticles. | |
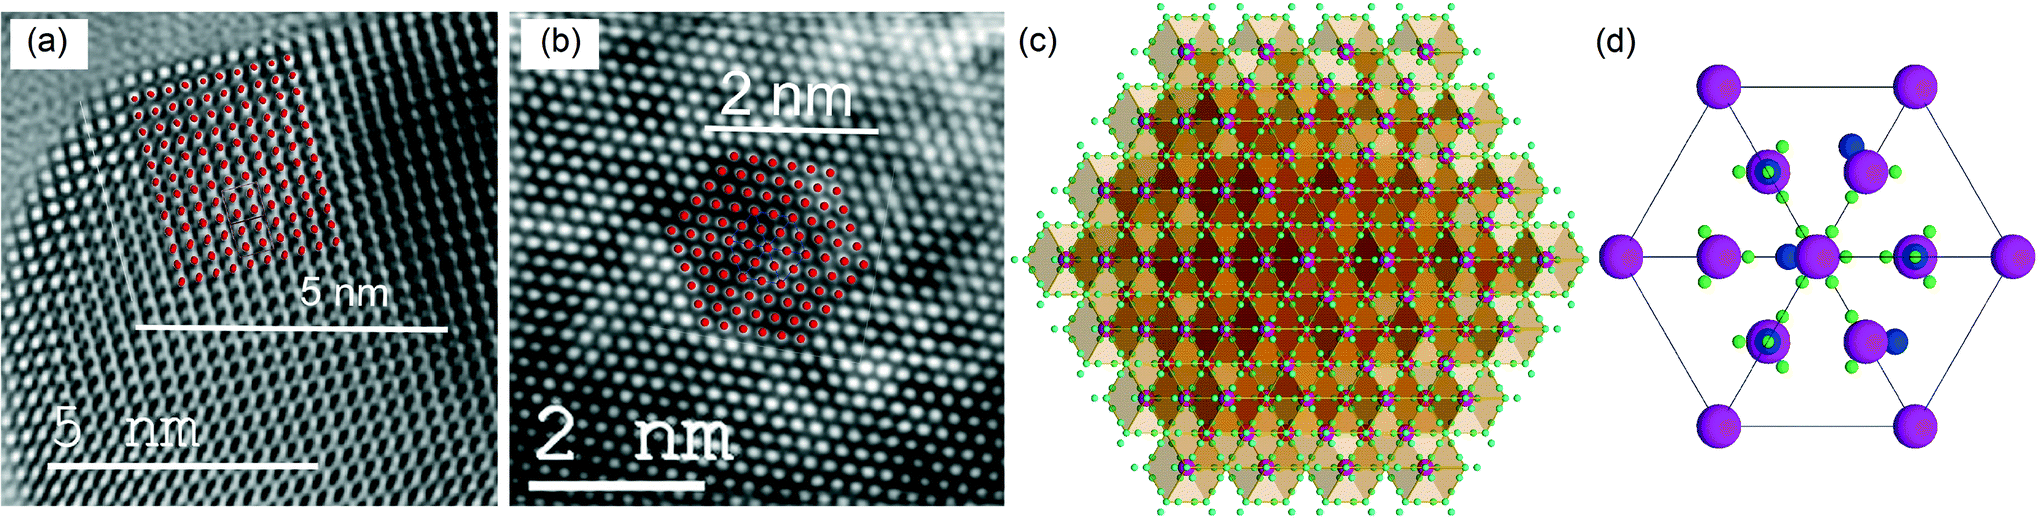
To analyze the details of the crystal structures of β- and δ-Bi2O3, their atom arrangement was studied based on the Rietveld refinement results shown in Fig. 1a and 2c. The Bi atom arrangement can be visualized by superimposing the β-Bi2O3 structure parallel to [110] and the δ-Bi2O3 structure in the [111] direction on high-resolution TEM images with only the metal atoms shown as high-density centers (Fig. 4a and b, respectively). Further analyzing the O atom arrangement reveals that each of the 8c sites is evenly surrounded by four of the 32f sites (Fig. 4c and d). Due to the physical constraints (ionic radius of O2− is 1.35 to 1.4 Å depending on its coordination),29 only one site within each cf-cluster (i.e., one central c enclosed by four f-positions) can be occupied by oxygen. However, the additional 32f positions significantly reduce the required hopping distance between adjacent cf-clusters (Fig. 5). For the Fmm structure with exclusive 8c Wyckoff positions only c → c transitions with a hopping distance of 2.75 Å would be possible. Notably, some ab initio and oxygen diffusion simulations were based on such simplified structures,36 possibly leading to inaccuracies. In contrast, c → f/f → c transitions within one cf-cluster only require overcoming 0.71 Å and the f → f hopping distance between adjacent cf-clusters is only 1.94 Å (Fig. 5). As the oxygen ion mobility in solid oxides is based on the hopping of O to adjacent vacant sites,7,8 this reduced distance could perhaps explain the energetically favorable oxygen transport path that gives rise to the excellent oxygen conductivity reported for δ-Bi2O3.5 A recent first-principles molecular dynamics study confirmed the importance of the 32f sites and led to excellent agreement between calculated and measured oxygen conductivities.8 In contrast to δ-Bi2O3, the distance between two neighboring oxygen positions in β-Bi2O3 is >2.44 Å. Thus, even if oxygen vacancies would be present in the β-Bi2O3, e.g. by removing oxygen from the particle surface through H2 reduction or ultra-high vacuum (see below), the oxygen ion mobility in the β-phase is expected to be significantly lower than that in the δ-phase.
 |
| | Fig. 4 High-resolution TEM images (bottom scale bars) of (a) β-Bi2O3 and (b) 5%Ti–Bi2O3 with superimposed Bi atoms in β-Bi2O3 in the [110] direction (with 10% scaling) and δ-Bi2O3 in the [111] projection (top scale bars). (c) δ-Bi2O3 crystal structure in the [111] direction with partially occupied oxygen positions (small greenish-blue spheres) and fully occupied mixed Bi/Ti/Mn positions (large magenta spheres). (d) One enlarged unit cell with a specific arrangement of six occupied oxygen positions (middle sized blue spheres), 32 vacancies (small green spheres) and the fully occupied Bi/Ti/Mn positions (large magenta spheres). | |
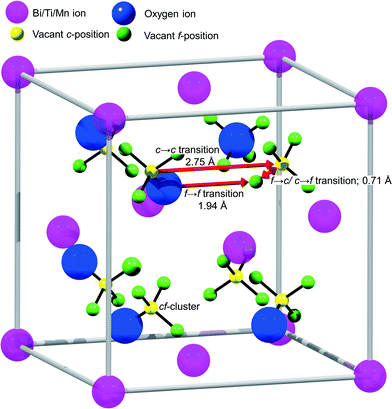 |
| | Fig. 5 Scheme of the proposed oxygen transport mechanism in δ-Bi2O3. The additional 32f Wyckoff positions reduce the hopping distance between adjacent cf-clusters by 30%. | |
Metal oxidation states and optical properties
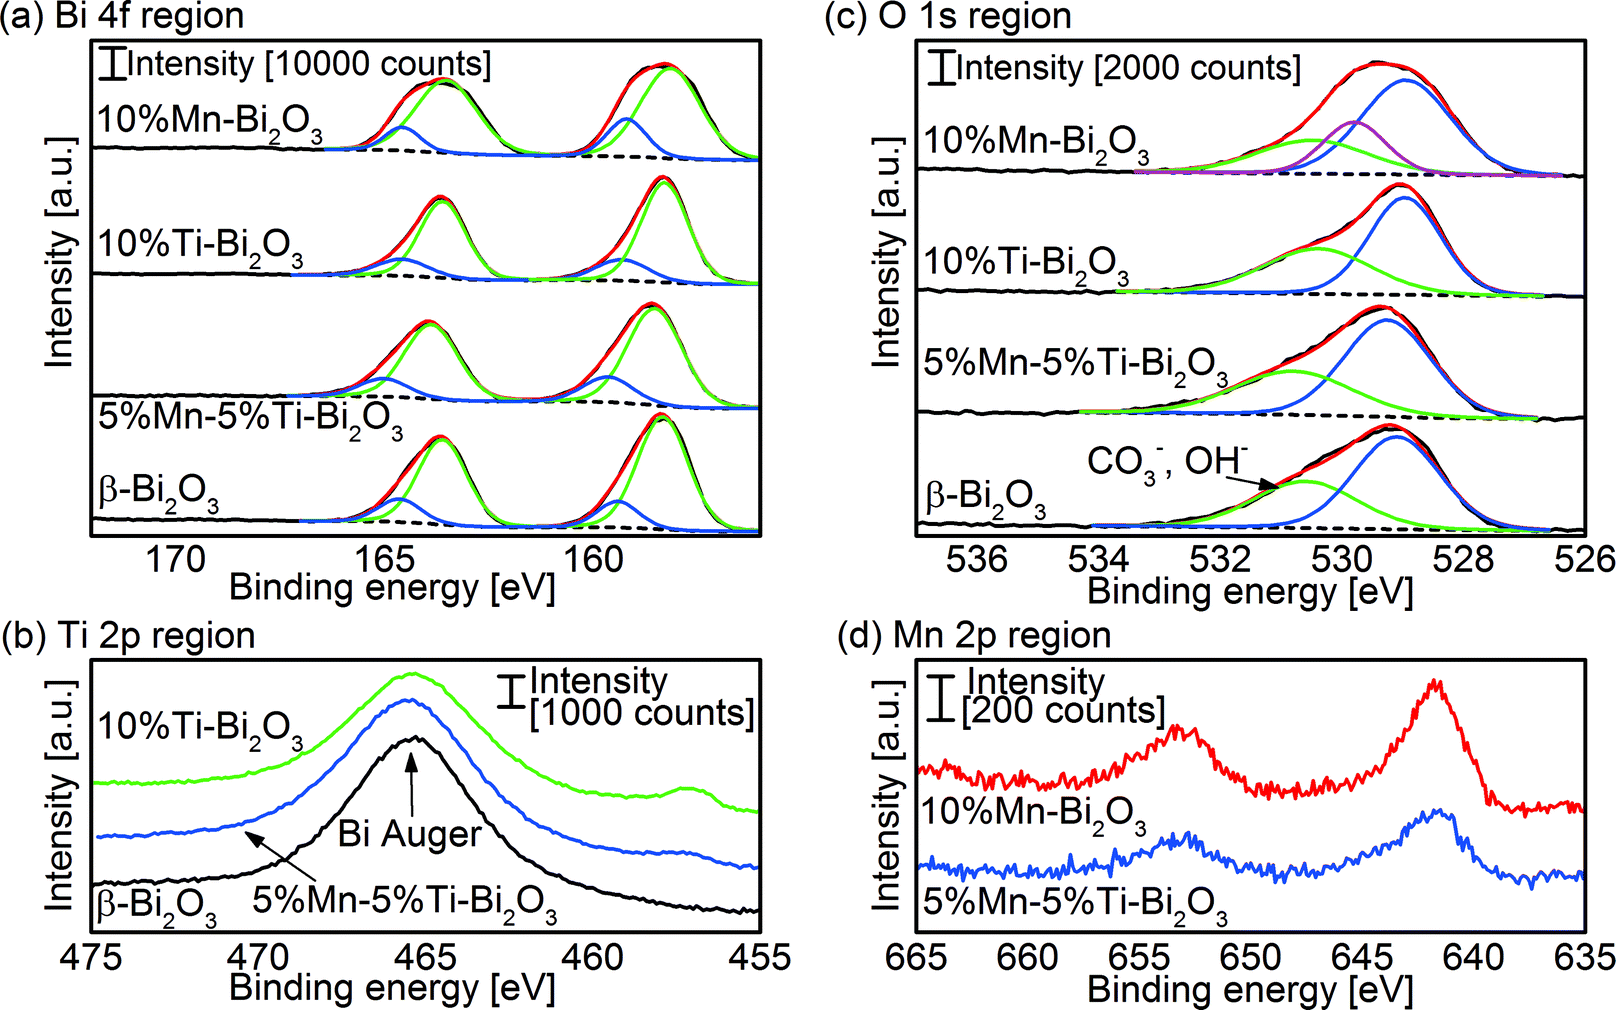
XPS analysis was applied to investigate the metal oxidation states and hence gain information on the number of oxygen vacancies in the flame-made δ-Bi2O3. A peak deconvolution of the Bi 4f signal in Fig. 6a revealed the typical Bi3+ in Bi2O3 (peak binding energies: Bi 4f5/2 158.3 eV, and Bi 4f7/2 163.6 eV).37,38 Additional peaks at 159.3 and 164.6 eV were measured, which can be attributed to either Bi3+ in Bi2O2CO3 (ref. 39) or that adjacent to oxygen vacancies.40 Bi2O3 is prone to forming carbonate on the surface when exposed to CO2 such as that in air41 or from the combustion process in FSP. Nevertheless, the bulk content of the carbonate species in the present study is negligibly small and below the detection limits of the XRD and HRTEM. The peak deconvolutions of the O 1s core levels (Fig. 6c) show the lattice O2− in Bi2O3 (peak binding energy 529.2 eV) and a broad shoulder centered ∼530.9 eV belonging to the surface adsorbed O2 and hydroxyl/carbonate species.37,39 Note that in the case of high Mn-doping (10 at% Mn), an additional peak centered at 259.8 eV was required to fit the relatively broad O 1s spectra. The peak can be traced to the O2− of MnO,42 indicating the formation of MnOx clusters and/or its segregation on the surface. Quantification of the surface elements found the Mn/Bi atomic ratio of 0.052 for the 5%Mn–5%Ti–Bi2O3 and 0.075 for 10%Mn–Bi2O3 compared to the nominal bulk values of 0.053 and 0.110, respectively. In other words, the clustering of MnOx (instead of homogeneous dispersion of the dopant) may have taken place at high Mn concentration. Fig. 6d shows the Mn 2p3/2 spectra of the doped Bi2O3 with peak binding energies centered at 641.6 eV. Attempting to determine the valencies of the Mn dopant is rather challenging given the close proximity of Mn2+ (binding energy 640.9–641.60 eV) and Mn3+ (binding energy 641.32–641.9 eV).42,43 Instead, the Mn oxidation state was determined with electron energy loss spectroscopy (EELS; Fig. S1†). A Mn L2,3 ratio of 3.7 ± 0.3 was calculated for both the 2.5%Mn–2.5%Ti–Bi2O3 and the 5%Mn–5%Ti–Bi2O3 samples, inferring the presence of Mn2+.44 The Ti 2p3/2 peak binding energy at 457 eV is in agreement with reported values of Ti4+ in bismuth titanates (Fig. 6b).40 From these results, it is deduced that the Mn and Ti dopants in Bi2O3 exist in the +2 and +4 states, respectively. Therefore, the general formula of the Mn/Ti stabilized δ-Bi2O3 is Bi3+2−x−yTi4+xMn2+yO3+x/2−y/2. Introducing both dopants equimolarly preserves the net valency of the host matrix (i.e., Bi3+).
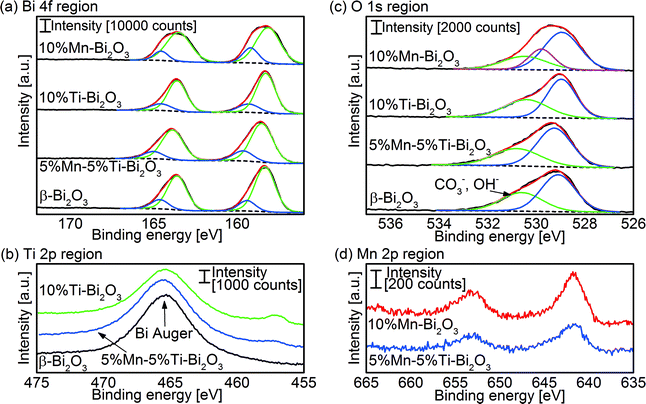 |
| | Fig. 6 XPS peak deconvolution of the (a) Bi 4f, (b) Ti 2p and (c) O 1s regions of as-prepared pristine Bi2O3 and that doped with Mn and/or Ti. Also shown is (d) the Mn 2p region of 10%Mn–Bi2O3 and 5%Mn–5%Ti–Bi2O3. | |
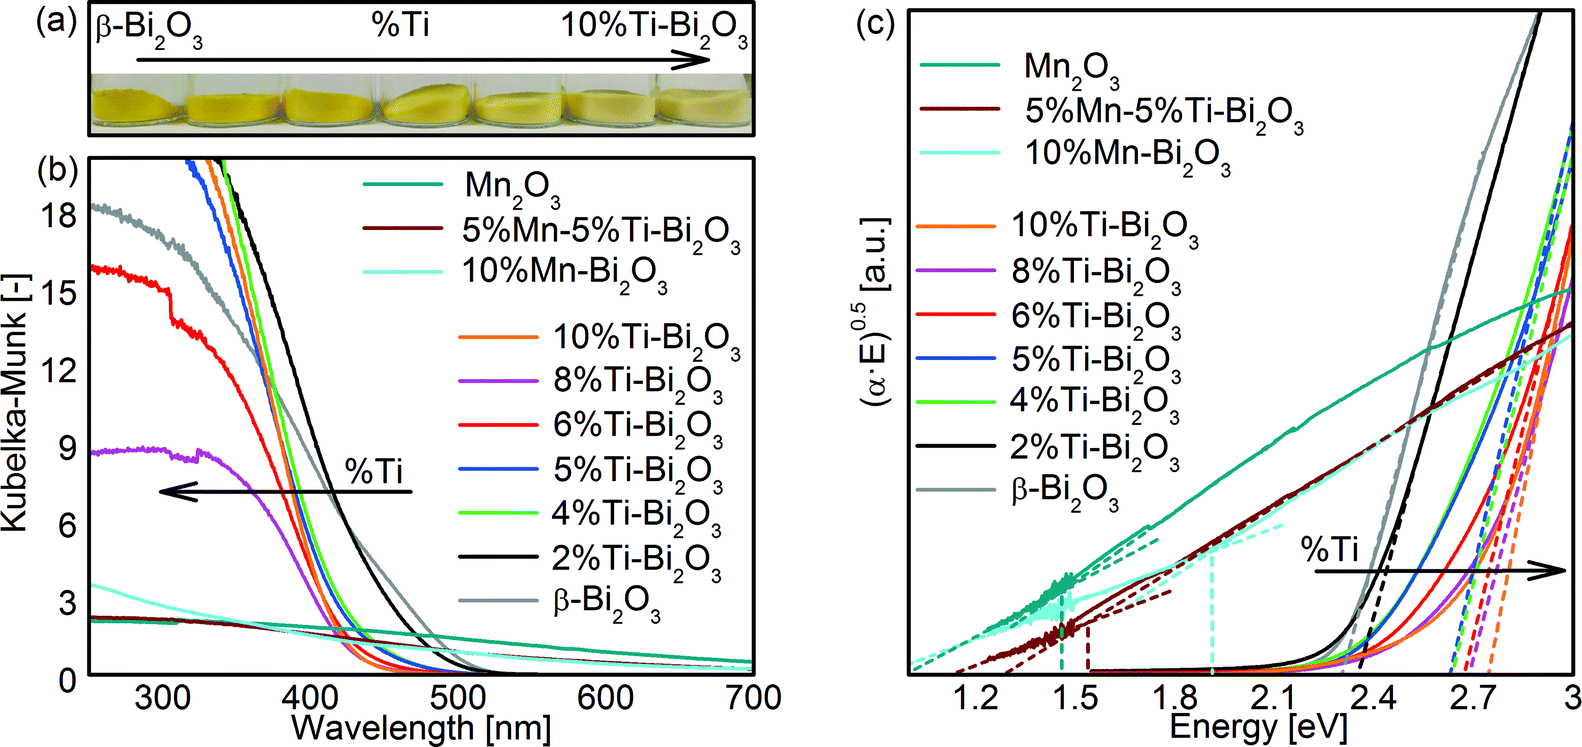
The optical bandgaps of the Bi2O3 samples were obtained with UV/vis diffuse-reflectance measurements (Fig. 7). Pristine β-Bi2O3 is defined by a bandgap value (Eg) of 2.3 eV as deduced from the Tauc plot (Fig. 7c and Table 1) assuming an allowed indirect electron transition, consistent with the reported values (2.1–2.6 eV).31,45 Doping of Ti from 0 to 10 at% resulted in a gradual blueshift (see color change in Fig. 7a) in the bandgap from 2.3 to 2.8 eV, respectively. This can be attributed in part to the transformation of β- to δ-Bi2O3 (2.79 eV for indirect and 3.1 eV for direct electron transitions).46 For the Mn-containing samples, the measured absorption thresholds of 1.6 eV for 5%Mn–5%Ti–Bi2O3 and 1.9 eV for 10%Mn–Bi2O3 are likely to be dominated by the d–d transition of MnOx species47 and hence prevented the meaningful extraction of bandgap values of the doped Bi2O3. Nevertheless, the clustering of MnOx corroborates the earlier observations by XRD (Fig. 2d) and XPS (Fig. 6).
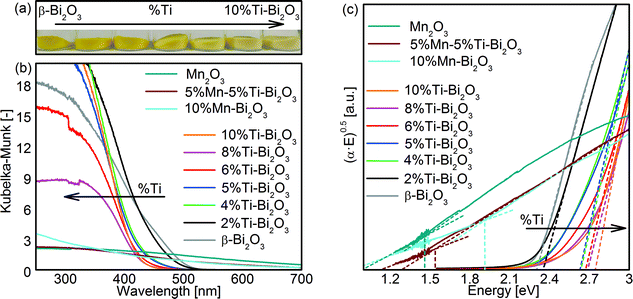 |
| | Fig. 7 (a) Photograph of as-prepared pristine Bi2O3 powder and that gradually doped with 2, 4, 5, 6, 8 and 10 at% Ti and (b) the corresponding UV-vis absorbance of the powders measured in Kubelka–Munk (KM) function. The KM absorbance of as-prepared Mn2O3, 5%Mn–5%Ti–Bi2O3 and 10%Mn–Bi2O3 is also included. (c) The Tauc plot of all the powder samples for estimation of optical bandgap, assuming allowed indirect transition. | |
Thermal stability of δ-Bi2O3
To assess the thermal stability of the as prepared δ-Bi2O3, high temperature XRD (HT-XRD) measurements were carried out. As shown in Fig. 8a, the δ-Bi2O3 phase with 10 at% Ti was effectively preserved up to 325 °C, above which additional diffraction peaks at 31.5° and 54° 2θ emerged, indicating β-Bi2O3. Rietveld refinement of the XRD pattern (at 30 °C) after completion of the HT-XRD scanning up to 650 °C (Rp = 4.5%, Rp′ = 17.8%, Fig. 8b) suggested the formation of 84.5 ± 1.4% Bi12TiO20 (RBragg = 5.0%, PDF 34-0097)48 along with 15.5 ± 0.4% Bi4Ti3O12 (RBragg = 17.1%, PDF 01-089-7501).49 Prolonged heat treatment at 300 °C for up to 79 h did not show any transformation of the 10%Ti–Bi2O3, highlighting its long-term stability (Fig. 8c). Doping with 10 at% Mn slightly enhanced the stability up to 350 °C, above which β-Bi2O3 started forming (Fig. 8d). Similar to the 10%Ti–Bi2O3 sample, the phase transformation was irreversible and predominantly Bi12MnO20 was formed at 650 °C (PDF 01-082-1024).
 |
| | Fig. 8 (a) HT-XRD patterns of 10%Ti–Bi2O3 measured as a function of heating temperature and (b) corresponding Rietveld refinement fit of the sample at 30 °C after HT-XRD of up to 650 °C. (c) The HT-XRD patterns of 10%Ti–Bi2O3 measured at 300 °C as a function of heating time. Also shown are the HT-XRD patterns of (d) 10%Mn–Bi2O3, (e) 5%Mn–5%Ti–Bi2O3 and (f) 2.5%Mn–2.5%Ti–Bi2O3 measured as a function of heating temperature. | |
The equimolar co-doping of Mn and Ti with 5 at% each further increased the temperature stability of the δ-phase to 400 °C (Fig. 8e). This reaffirms the hypothesis that the minimization of aliovalency through co-doping of Ti4+ and Mn2+ increases the thermal stability of the metastable δ-Bi2O3 phase. Sufficient amounts of co-dopants are, however, required to preserve the δ-phase at higher temperatures which is illustrated by the reduced stability with lower amounts of equimolar Mn and Ti of 2.5 at% (Fig. 8f).
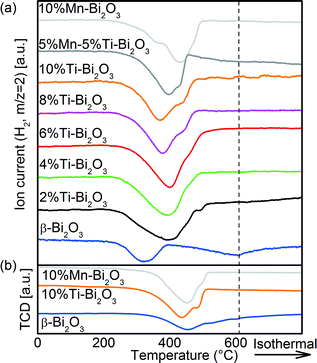
Temperature-programmed reduction with H2 (H2-TPR) was carried out to quantify the oxygen removal from (and mobility in) the Bi2O3 samples. As shown in Fig. 9a, the first surface reduction hump of pristine β-Bi2O3 is centered at 322 °C,50 equivalent to 2.3 mmol g−1 H2 consumed. This corresponds to 36% of the oxygen available in the sample as 6.4 mmol g−1 H2 would be required for the complete reduction of Bi2O3. More specifically, the reduction corresponds to the outer 1.4 nm shell of the 20 nm β-Bi2O3 particles. Thus oxygen from the β-Bi2O3 surface is removed easily but due to the limited oxygen mobility within the bulk, the removed oxygen is not replenished. This is most likely linked to the comparably large distance between adjacent oxygen positions of >2.44 Å and the lack of bulk oxygen vacancies as discussed above. At higher reduction temperatures, the broad reduction of the β-Bi2O3 bulk between 400 and 600 °C accounts for a further 3.0 mmol g−1 H2 consumption, and thus 83% of the available oxygen was consumed below 600 °C. Doping with 2 at% Ti resulted in the merging of surface and bulk reduction (6.8 mmol g−1) with a peak maximum at 400 °C and a minor peak at 488 °C (0.1 mmol g−1). The significant increase in H2 consumption is a result of enhanced oxygen mobility and indicates continuous replenishment of the consumed surface oxygen. With further increase in Ti content, the bulk Bi2O3 reduction peak shifts towards lower temperatures (from 400 °C for 2%Ti–Bi2O3 to 372 °C for 10%Ti–Bi2O3) inferring an increase in oxygen mobility. The addition of 10 at% Mn resulted in a distinct surface reduction at 369 °C and a bulk reduction peak at 433 °C. Again, approximately 100% of the available oxygen was consumed (6.7 mmol g−1), demonstrating the enhanced oxygen mobility compared to partially reducible β-Bi2O3. The ease in replenishing the removed surface oxygen in δ-Bi2O3 is hereby associated to the low transition distance between adjacent cf-clusters of 1.94 Å due to the 32f Wyckoff positions in the Fmm crystal structure (Fig. 5). Minor CO2 desorption was detected for all samples during the H2-TPRs (Fig. S2†), corroborating the formation of small amounts of surface carbonates seen earlier from XPS (Fig. 6a). Further H2-TPRs were conducted after a 1 h Ar pretreatment at 450 °C (Fig. 9b) to alter the crystal structure while leaving the chemical composition unchanged (Fig. 8). The temperatures required for surface reduction increased from 230 °C to 280 °C after the Ar pretreatment and also the peak temperature increased (e.g., 370 °C to 440 °C for 10%Ti–Bi2O3). Hence, the enhanced oxygen mobility in Fig. 9a is caused by the δ-phase and not simply the chemical composition of the samples (i.e., the addition of Ti and/or Mn).
 |
| | Fig. 9 H2-TPR spectra of the pristine and doped Bi2O3 samples synthesized with FSP: (a) as-synthesized samples and (b) after a 1 h Ar pretreatment at 450 °C. | |
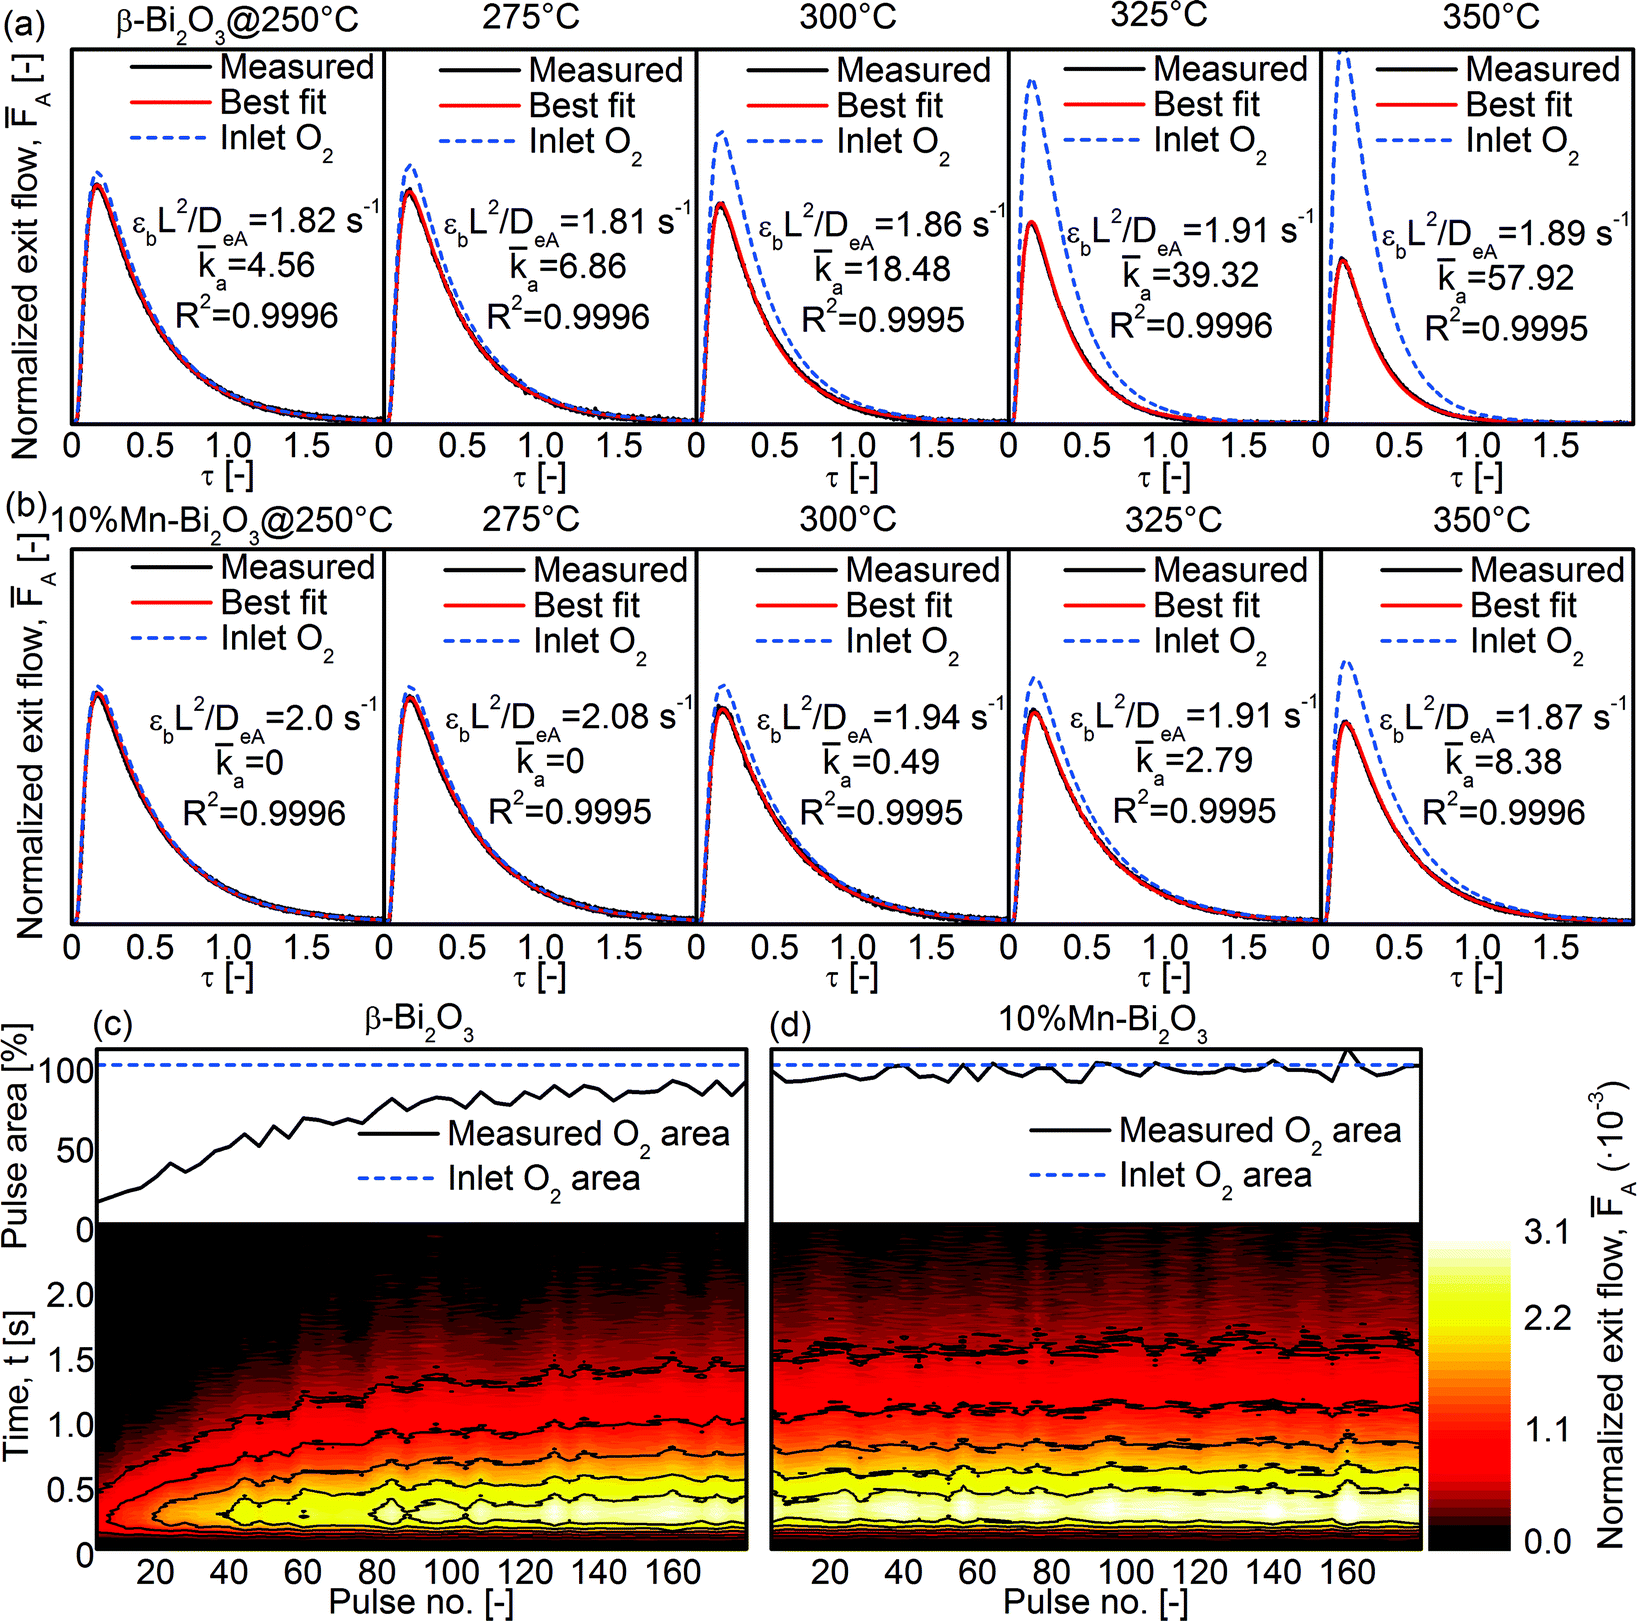
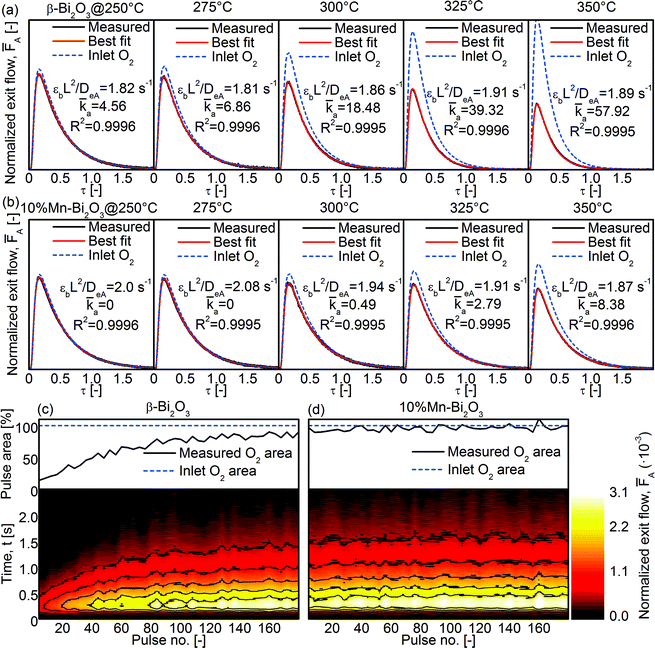
To study the ability of the Bi2O3 for heterogeneous oxygen exchange, temporal analysis of products (TAP) was conducted using gas pulses consisting of 66.7% 18O2 isotope in Ar (Fig. 10). The average of 20 pulses was fitted to the analytical equations (see Experimental section) to determine the dimensionless adsorption and desorption rate constants (a and d, respectively) and the effective Knudsen diffusivity of oxygen (DeA). As shown in Fig. 10a, the a of pristine β-Bi2O3 increased from 4.6 at 250 °C to 57.9 at 350 °C while d remained 0. A release of 16O (i.e., 16O18O or 16O2; not shown) was not detected and the 18O2 peak area increased with increasing number of pulses (Fig. 10c). Given the low-temperature reducibility of β-Bi2O3 (Fig. 9a), some of the surface may have been reduced under the ultra-high vacuum and elevated temperatures, and this accounts for the consumption of 18O2 during TAP measurements (Fig. 10c, top). Essentially, the 18O2 peak areas converge towards that of the Inlet O2 area (corresponding to 100% O2 exiting the reactor; see Experimental section) as the vacancy sites are fully saturated (Fig. 10c, top). Because 10%Mn–Bi2O3 is less reducible at low temperatures (despite the overall higher reducibility at high temperatures) the difference between measured and expected O2 area (compare Measured and Inlet O2 in Fig. 10a) is much smaller for 10%Mn–Bi2O3 than for β-Bi2O3. No 16O release was detected and d remained 0 in the whole temperature range. From the measurements, it is concluded that the cationic doping in Bi2O3 stabilized not only the δ-phase with its numerous oxygen vacancies but also the surface lattice oxygen in Bi2O3. Such stabilization of lattice oxygen is in agreement with the decrease in heterogeneous oxygen exchange with increasing cation concentrations reported in the literature.6,9,16,51 It is believed that this can be overcome by introducing co-catalysts such as Pt on the surface of δ-Bi2O3 to assist in the dissociative adsorption of molecular O2 and further its interfacial exchange. In that way, the beneficial effect of O mobility (as reflected by its bulk reducibility) can be fully exploited.
 |
| | Fig. 10 TAP-2 isotopic 18O2 pulse shape at 250–350 °C for the (a) β-Bi2O3 and (b) 10%Mn–Bi2O3 samples. Also shown are the measured 18O2 peak area (top) and the corresponding contour plots of the 18O2 peaks (bottom) for the (c) β-Bi2O3 and (d) 10%Mn–Bi2O3 samples at 350 °C. | |
Conclusions
Flame spray pyrolysis (FSP) is a technique for effectively stabilizing nano-sized δ-Bi2O3 down to room temperature with remarkably low dopant concentrations. This extraordinarily low cation concentration is expected to be beneficial for the oxygen ion conductivity. Extensive characterization revealed that 5 at% (2.5% Mn + 2.5% Ti) was sufficient for almost pure δ-phase nanoparticles, while 10 at% Ti, 10 at% Mn as well as 5 at% Mn + 5 at% Ti all resulted in pure δ-Bi2O3. Adding a mixture of two cations (i.e., Ti and Mn) during FSP hereby lowered the required amount for δ-Bi2O3 stabilization and caused an increase in thermal stability. H2 temperature programmed reduction and temporal analysis of products indicated enhanced bulk oxygen mobility for the as-synthesized δ-Bi2O3 while β-Bi2O3 was superior in surface reducibility. In the present study, materials are already applicable at a temperature range of 100–325 °C and further optimization by, e.g., different cation combinations depending on the desired applications, is feasible. The single-step synthesis and versatility of the FSP technique is expected to set the foundation for the development of novel bismuth-based solid oxygen conductors.
Acknowledgements
JAHD thanks the support of the Research Grant Council (RGC) of Hong Kong for awarding the Hong Kong PhD Fellowship Scheme. The work is supported by the RGC through the General Research Fund (Project 11302714). MGH and AU thank MINECO for support through Severo Ochoa Excellence Accreditation 2014-2018 (SEV-2013-0319). SP and LM gratefully acknowledge the financial support of the Deutsch Forschungsgemeinschaft (DFG) within the SPP 1613 (MA 3333/6-1) and the Priority Program “Partikel im Kontakt -Mikromechanik, Mikroprozessdynamik und Partikelkollektiv” (SPP 1486) under grants MA 3333/3.”
References
- M. Yan, F. Chen, J. Zhang and M. Anpo, J. Phys. Chem. B, 2005, 109, 8673–8678 CrossRef PubMed.
- Y. K. Kho, W. Y. Teoh, L. Mädler and R. Amal, Chem. Eng. Sci., 2011, 66, 2409–2416 CrossRef.
-
(a) J. H. Shim, C.-C. Chao, H. Huang and F. B. Prinz, Chem. Mater., 2007, 19, 3850–3854 CrossRef;
(b) S. Sanna, V. Esposito, A. Tebano, S. Licoccia, E. Traversa and G. Balestrino, Small, 2010, 6, 1863–1867 CrossRef CAS PubMed.
-
(a) L. Malavasi, C. A. J. Fisher and M. S. Islam, Chem. Soc. Rev., 2010, 39, 4370–4387 RSC;
(b) A. Orera and P. R. Slater, Chem. Mater., 2010, 22, 675–690 CrossRef CAS.
-
(a) E. D. Wachsman and K. T. Lee, Science, 2011, 334, 935–939 CrossRef CAS PubMed;
(b) R. Punn, A. M. Feteira, D. C. Sinclair and C. Greaves, J. Am. Chem. Soc., 2006, 128, 15386–15387 CrossRef CAS PubMed.
- M. Drache, P. Roussel and J.-P. Wignacourt, Chem. Rev., 2007, 107, 80–96 CrossRef CAS PubMed.
-
(a) R. Pornprasertsuk, P. Ramanarayanan, C. B. Musgrave and F. B. Prinz, J. Appl. Phys., 2005, 98, 103513 CrossRef;
(b) P. S. Manning, J. D. Sirman, R. A. De Souza and J. A. Kilner, Solid State Ionics, 1997, 100, 1–10 CrossRef CAS.
- A. Seko, Y. Koyama, A. Matsumoto and I. Tanaka, J. Phys.: Condens. Matter, 2012, 24, 475402 CrossRef PubMed.
- J. C. Boivin and G. Mairesse, Chem. Mater., 1998, 10, 2870–2888 CrossRef CAS.
- J. A. Switzer, M. G. Shumsky and E. W. Bohannan, Science, 1999, 284, 293–296 CrossRef CAS PubMed.
- H. A. Harwig, Z. Anorg. Allg. Chem., 1978, 444, 151–166 CrossRef CAS.
-
(a) A. Helfen, S. Merkourakis, G. Wang, M. G. Walls, E. Roy, K. Yu-Zhang and Y. Leprince-Wang, Solid State Ionics, 2005, 176, 629–633 CrossRef CAS;
(b) K. Laurent, G. Y. Wang, S. Tusseau-Nenez and Y. Leprince-Wang, Solid State Ionics, 2008, 178, 1735–1739 CrossRef CAS.
- H. T. Fan, S. S. Pan, X. M. Teng, C. Ye and G. H. Li, J. Phys. D: Appl. Phys., 2006, 39, 1939–1943 CrossRef CAS.
- T. Takeyama, N. Takahashi, T. Nakamura and S. Itoh, J. Cryst. Growth, 2005, 275, 460–466 CrossRef CAS.
- X. Y. Chen, Z. J. Zhang and S. W. Lee, J. Solid State Chem., 2008, 181, 166–174 CrossRef CAS.
- D. W. Jung, K. L. Duncan and E. D. Wachsman, Acta Mater., 2010, 58, 355–363 CrossRef CAS.
- K. T. Lee, A. A. Lidie, H. S. Yoon and E. D. Wachsman, Angew. Chem., Int. Ed., 2014, 53, 13463–13467 CrossRef CAS PubMed.
- S. Sanna, V. Esposito, J. W. Andreasen, J. Hjelm, W. Zhang, T. Kasama, S. B. Simonsen, M. Christensen, S. Linderoth and N. Pryds, Nat. Mater., 2015, 14, 500–504 CrossRef CAS PubMed.
- A. J. Jacobson, Chem. Mater., 2010, 22, 660–674 CrossRef CAS.
- G. Meng, C. Chen, X. Han, P. Yang and D. Peng, Solid State Ionics, 1988, 28–30, 533–538 CrossRef.
- A. Watanabe, M. Drache, J. P. Wignacourt, P. Conflant and J. C. Boivin, Solid State Ionics, 1993, 67, 25–28 CrossRef CAS.
-
(a) S. Pokhrel, A. E. Nel and L. Mädler, Acc. Chem. Res., 2013, 46, 632–641 CrossRef CAS PubMed;
(b) S. Pokhrel, J. Birkenstock, M. Schowalter, A. Rosenauer and L. Mädler, Cryst. Growth Des., 2010, 10, 632–639 CrossRef CAS;
(c) J. A. Kemmler, S. Pokhrel, L. Mädler, U. Weimar and N. Barsan, Nanotechnology, 2013, 24, 442001 CrossRef CAS PubMed;
(d) W. Y. Teoh, R. Amal and L. Mädler, Nanoscale, 2010, 2, 1324–1347 RSC;
(e) R. Strobel and S. E. Pratsinis, J. Mater. Chem., 2007, 17, 4743–4756 RSC.
-
(a) J. A. Kemmler, S. Pokhrel, J. Birkenstock, M. Schowalter, A. Rosenauer, N. Bârsan, U. Weimar and L. Mädler, Sens. Actuators, B, 2012, 161, 740–747 CrossRef CAS;
(b) J. Xiao, A. Kuc, S. Pokhrel, M. Schowalter, S. Parlapalli, A. Rosenauer, T. Frauenheim, L. Mädler, L. G. M. Pettersson and T. Heine, Small, 2011, 7, 2879–2886 CrossRef CAS PubMed;
(c) J. Xiao, A. Kuc, S. Pokhrel, L. Mädler, R. Pöttgen, F. Winter, T. Frauenheim and T. Heine, Chem. – Eur. J., 2013, 19, 3287–3291 CrossRef CAS PubMed.
- L. Mädler, H. K. Kammler, R. Mueller and S. E. Pratsinis, J. Aerosol Sci., 2002, 33, 369–389 CrossRef.
- L. Cavé, T. Al, D. Loomer, S. Cogswell and L. Weaver, Micron, 2006, 37, 301–309 CrossRef PubMed.
- J. T. Gleaves, G. S. Yablonskii, P. Phanawadee and Y. Schuurman, Appl. Catal., A, 1997, 160, 55–88 CrossRef CAS.
- L. Mädler and S. E. Pratsinis, J. Am. Ceram. Soc., 2002, 85, 1713–1718 CrossRef.
- S. E. Pratsinis, Prog. Energy Combust. Sci., 1998, 24, 197–219 CrossRef CAS.
- R. D. Shannon, Acta Crystallogr., Sect. A: Cryst. Phys., Diffr., Theor. Gen. Crystallogr., 1976, 32, 751–767 CrossRef.
- D. Poleti, L. Karanović, M. Zdujić and C. Jovalekić, J. Serb. Chem. Soc., 2012, 77, 1091–1096 CrossRef CAS.
- Y. Wang, Y. Wen, H. Ding and Y. Shan, J. Mater. Sci., 2010, 45, 1385–1392 CrossRef CAS.
- H. Kato and A. Kudo, J. Phys. Chem. B, 2002, 106, 5029–5034 CrossRef CAS.
- A. A. Zav'yalova and R. M. Imamov, J. Struct. Chem., 1973, 13, 811–814 CrossRef.
- F. Hund, Z. Anorg. Allg. Chem., 1964, 333, 248–255 CrossRef CAS.
- M. Yashima and D. Ishimura, Chem. Phys. Lett., 2003, 378, 395–399 CrossRef CAS.
-
(a) G. Zhong, Y. Wang, Z. Dai, J. Wang and Z. Zeng, Phys. Status Solidi B, 2009, 246, 97–101 CrossRef CAS;
(b) G. Zhong, J. Wang and Z. Zeng, Phys. Status Solidi B, 2008, 245, 2737–2742 CrossRef CAS.
-
(a) D. Barreca, F. Morazzoni, G. A. Rizzi, R. Scotti and E. Tondello, Phys. Chem. Chem. Phys., 2001, 3, 1743–1749 RSC;
(b) H. Cheng, B. Huang, J. Lu, Z. Wang, B. Xu, X. Qin, X. Zhang and Y. Dai, Phys. Chem. Chem. Phys., 2010, 12, 15468–15475 RSC.
- M. Liu, L. Zhang, K. Wang and Z. Zheng, CrystEngComm, 2011, 13, 5460–5466 RSC.
- Q. Li, H. Liu, F. Dong and M. Fu, J. Colloid Interface Sci., 2013, 408, 33–42 CrossRef CAS PubMed.
- C. Zaldo, C. Coya, J. L. G. Fierro, K. Polgár, L. Kovács and Z. Szaller, J. Phys. Chem. Solids, 1996, 57, 1667–1672 CrossRef CAS.
-
(a) I. Djerdj, A. Haensch, D. Koziej, S. Pokhrel, N. Barsan, U. Weimar and M. Niederberger, Chem. Mater., 2009, 21, 5375–5381 CrossRef CAS;
(b) L. Huang, G. Li, T. Yan, J. Zheng and L. Li, New J. Chem., 2011, 35, 197–203 RSC.
-
(a) A. A. Audi and P. M. A. Sherwood, Surf. Interface Anal., 2002, 3, 274–282 CrossRef;
(b) J. S. Foord, R. B. Jackman and G. C. Allen, Philos. Mag. A, 1984, 49, 657–663 CrossRef CAS.
- A. S. Ivanova, E. M. Slavinskaya, V. V. Mokrinskii, I. A. Polukhina, S. V. Tsybulya, I. P. Prosvirin, V. I. Bukhtiyarov, V. A. Rogov, V. I. Zaikovskii and A. S. Noskov, J. Catal., 2004, 221, 213–224 CrossRef CAS.
- H. K. Schmid and W. Mader, Micron, 2006, 37, 426–432 CrossRef CAS PubMed.
- V. Dolocan and F. Iova, Phys. Status Solidi A, 1981, 64, 755–759 CrossRef CAS.
-
(a) L. Zhou, W. Wang, H. Xu, S. Sun and M. Shang, Chem. – Eur. J., 2009, 15, 1776–1782 CrossRef CAS PubMed;
(b) H. A. Zayed, Fizika (Alma-Ata), 1995, 4, 45–53 CAS.
-
(a) M. Tepluchin, D. K. Pham, M. Casapu, L. Mädler, S. Kureti and J.-D. Grunwaldt, Catal. Sci. Technol., 2015, 5, 455–464 RSC;
(b) N. Stamatis, K. Goundani, J. Vakros, K. Bourikas and C. Kordulis, Appl. Catal., A, 2007, 325, 322–327 CrossRef CAS;
(c) S. Velu, N. Shah, T. M. Jyothi and S. Sivasanker, Microporous Mesoporous Mater., 1999, 33, 61–75 CrossRef CAS.
- NBS Monogr. 25, PDF #34-0097, 1983, vol. 20, p. 21 Search PubMed.
- C. H. Hervoches and P. Lightfoot, Chem. Mater., 1999, 11, 3359–3364 CrossRef CAS.
- R. Irmawati, M. N. N. Nasriah, Y. H. Taufiq-Yap and S. B. A. Hamid, Catal. Today, 2004, 93–95, 701–709 CrossRef CAS.
- A. M. Azad, S. Larose and S. A. Akbar, J. Mater. Sci., 1994, 29, 4135–4151 CrossRef CAS.
Footnote |
| † Electronic supplementary information (ESI) available: EELS spectra of the L2,3 edge of Mn or Ti for selected δ-Bi2O3 samples and corresponding L2/L3 peak fitting for determining the Mn oxidation state; ion currents of m/z = 44 (CO2) for the H2-TPR experiments presented in Fig. 9. See DOI: 10.1039/c5ce02430g |
|
| This journal is © The Royal Society of Chemistry 2016 |
Click here to see how this site uses Cookies. View our privacy policy here. 
 Open Access Article
 This Open Access Article is licensed under a
  d,
Wey Yang Teoha and
Lutz Mädler*b
d,
Wey Yang Teoha and
Lutz Mädler*b