
 Open Access Article
 This Open Access Article is licensed under a Creative Commons Attribution-Non Commercial 3.0 Unported Licence
Single-crystal structure determination from microcrystalline powders (∼5 μm) by an orientation attachment mountable on an in-house X-ray diffractometer†
Chiaki
Tsuboi
a,
Kazuaki
Aburaya
b,
Fumiko
Kimura
a,
Masataka
Maeyama
b and
Tsunehisa
Kimura
*a
aDivision of Forest and Biomaterials Science, Kyoto University, Sakyo-ku, Kyoto 606-8502, Japan. E-mail: tkimura@kais.kyoto-u.ac.jp; Fax: +81 75 753 6300; Tel: +81 75 753 6246
bRigaku Corporation, 3-9-12 Matsubara-cho, Akishima, Tokyo 196-8666, Japan
First published on 19th January 2016
Abstract
An X-ray attachment that can realize single-crystal X-ray diffraction patterns from microcrystalline powders is proposed. Single-crystal diffraction data are acquired in situ and analyzed using conventional computer software to determine the crystal structure of the microcrystals. The performance of the attachment is demonstrated using L-alanine microcrystals (∼5 μm).
The demand for single-crystal analyses has been increasing because the elucidation of molecular structures in crystalline states is of primary importance to understand and improve the functions and performance of solid materials in their final products. Single-crystal X-ray1 and neutron diffraction techniques2,3 are the most straightforward means to determine molecular structures if large single crystals are available. However, many materials are only available as microcrystalline powders that are unsuitable for characterization by these techniques. In such cases, powder diffraction is useful. The powder diffraction method has been rapidly and intensively developed recently.4–12 However, it has substantial difficulties that the overlap of peaks is inevitable. Also, it strongly relies on model structure and computational optimization.
The overlap of peaks may be largely reduced if microcrystals are textured or partially oriented. Shape anisotropy of crystals was utilized for this purpose and single-crystal-like diffraction was successfully obtained to determine the crystal sturucture.13–15 Liquid-crystals of a fibrous protein were magnetically oriented to obtain the fiber diffraction pattern for crystal structure determination.16,17
We previously proposed an approach to determine crystal structures from microcrystalline powders based on the three-dimensional (3D) magnetic orientation of microcrystals. This approach can be applied to biaxial crystals, including orthorhombic, monoclinic, and triclinic crystals, whose magnetic susceptibility tensor χ has three different principal values, χ1, χ2, and χ3 (χ1 > χ2 > χ3). By applying frequency-modulated rotating magnetic fields to a suspension of microcrystals, the microcrystals are aligned three-dimensionally.18,19 The χ1 and χ3 axes are referred to as easy and hard magnetization axes, respectively. The easy axis aligns parallel to the applied static field, while the hard axis aligns parallel to the rotating axis of the magnetic field. The combination of these two magnetic fields can produce 3D alignment of microcrystals. In actual experiments, the suspension is rotated in static magnetic fields instead of applying rotating magnetic fields.
In our approach, microcrystals suspended in a liquid medium are rotated with the rotating speed being changed regularly under a static magnetic field to achieve 3D alignment, and then the liquid medium is consolidated to fix the alignment of the microcrystals. The obtained composite, which is called a magnetically oriented microcrystal array (MOMA), produces X-ray diffraction (XRD) spots equivalent to those from a corresponding large single crystal. We have performed single-crystal X-ray analyses of MOMAs of inorganic, organic and protein microcrystal samples, and successfully solved their crystal structures.20 However, it requires high magnetic fields (∼10 T) that are supplied by superconducting magnets in order to prepare MOMAs.
In this work, we design a compact orientation attachment, comprising a magnetic unit and shutter that can be mounted on an in-house X-ray diffractometer to obtain single-crystal XRD images from magnetically oriented microcrystal suspensions (referred to as MOMSs). In situ diffraction measurements from magnetically oriented suspensions are reported.21–23 A schematic and photograph of the attachment are shown in Fig. 1. The directions of the impinging X-ray beam, magnetic field B, and rotation axis of the capillary containing the suspension are defined as parallel to the x, y, and z directions, respectively. The rotation angle of the capillary with respect to the x axis is denoted by angle α that changes over time as α = ωt. ω is ωs when 0° < α < 90° and 180° < α < 270° and ωq when 90° < α < 180° and 270° < α < 360° (Fig. 2).
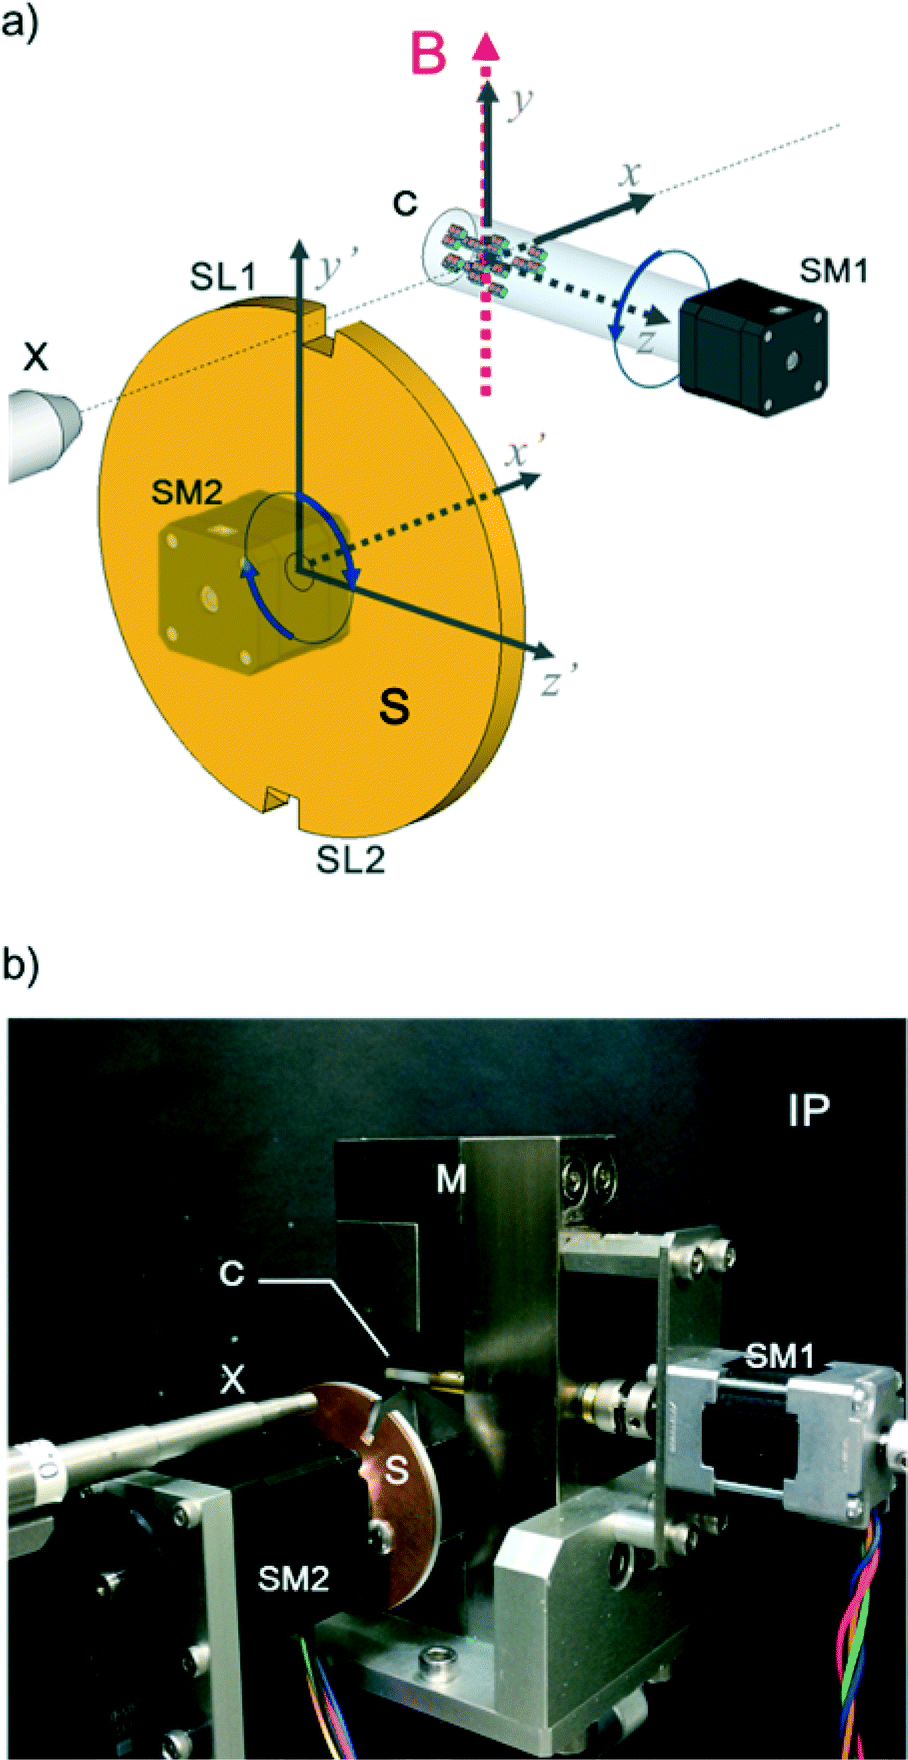 | ||
| Fig. 1 (a) Schematic of the experimental setup. A glass capillary (C) containing a microcrystalline suspension rotates in a frequency-modulated manner by using a stepping motor (SM1) about the laboratory z axis under a static magnetic field (B). The x and y axes coincide with the directions of the impinging X-ray from a collimator (X) and the static magnetic field (B), respectively. The x′, y′, and z′ axes, which are parallel to the x, y, and z axes, respectively, are the coordinates defined for the shutter (S) that has two slits (SL1 and SL2). The shutter is rotated synchronously with the capillary using a stepping motor (SM2). (b) Photograph of the orientation attachment mounted on an in-house X-ray diffractometer, where χϕ goniometers are removed. This photograph shows a glass capillary (C), an X-ray collimator (X), stepping motors (SM1 and SM2), a shutter with a diameter of 44 mm (S), and a pair of neodymium magnets (M) generating ca. 1 T at the capillary. An imaging plate (IP) is at the back. | ||
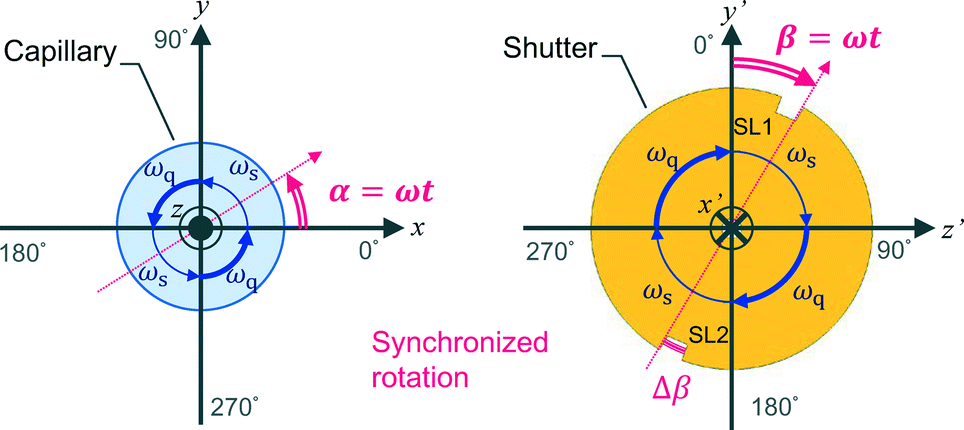 | ||
| Fig. 2 Schematics of the rotation of the capillary and shutter. The xyz and x′ y′ z′ coordinates are the same as in Fig. 1. The rotation angles α = ωt of the capillary and β = ωt of the shutter are defined with respect to the x and y′ axes, respectively. The rotation speed is ω = ωs when 0° < α, β < 90° and 180° < α, β < 270°, and ω = ωq when 90° < α, β < 180° and 270° < α, β < 360°. | ||
With the rotation of the capillary, the microcrystals align three-dimensionally. This alignment is synchronous with the capillary rotation and is only maintained while the capillary rotation is continued. Because the speed of the conventional oscillation is much slower than that of the rotation, conventional measurement on the rotating capillary only reveals a fiber pattern. To collect the XRD images at a designated oscillation angle, we need to introduce a shutter device. The rotation angle of a disk-shaped shutter with respect to the y′-axis is denoted by β = ωt; its rotation is synchronized with that of the capillary. There is a pair of slits, SL1 and SL2, with a slit angle of Δβ, separated by 180° on the edge of the shutter. The angle Δβ corresponds to the widths of the ω-oscillation scan angle in conventional single-crystal measurement. The X-ray is allowed to impinge on the capillary only when the X-ray beam comes across the slits. Because a MOMS has a two-fold rotation symmetry about the capillary rotation axis,22 the diffraction images taken through SL1 and SL2 are equivalent. The default starting position of the slits is at β = 0 when the capillary position is α = 0 (see Fig. 1a). By shifting the starting position of the slits, the microcrystals are impinged by X-rays from different angles ω with respect to the X-ray beam. A set of collected diffraction data corresponds to that obtained from ω-oscillation scans in conventional single-crystal data acquisition. As a result, the obtained full data set can be analyzed by conventional computer software for single-crystal analyses.
Sample preparation of a suspension of L-alanine microcrystals, in situ X-ray measurement of the resulting MOMS, and subsequent single-crystal analyses are summarized in the ESI.† We used two kinds of suspensions, one containing 20–45 μm microcrystals and the other less than 5 μm (shown in Fig. 3). Single-crystal diffraction from microcrystals less than 10 μm in size is hard to measure using in-house diffractometers. It is even sometimes difficult to obtain single-crystal diffraction patterns from microcrystals with a size of 5 μm at conventional beam lines in synchrotron facilities. L-Alanine single crystals belong to the orthorhombic crystal system (space group: P212121). The relationships between the magnetization and crystallographic axes for L-alanine crystals are known to be χ1 ∥ c![[*]](https://www.rsc.org/images/entities/char_e103.gif) , χ2 ∥ a, χ3 ∥ b.24
, χ2 ∥ a, χ3 ∥ b.24
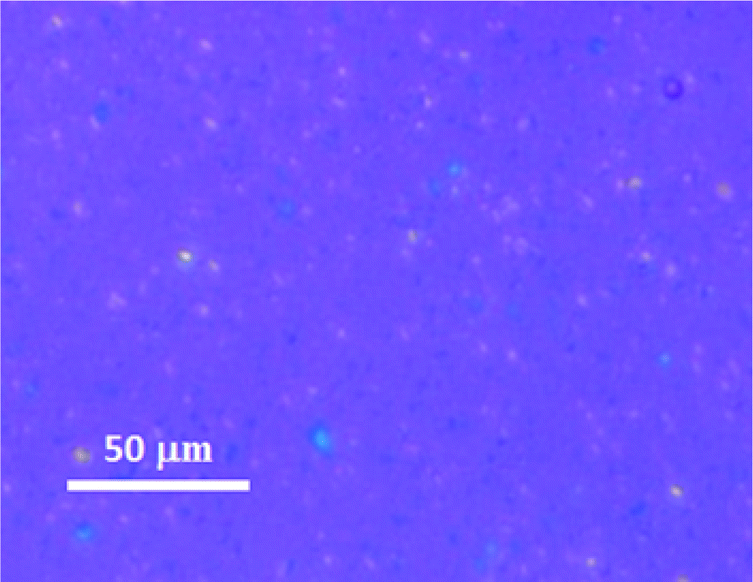 | ||
| Fig. 3 Polarized optical micrograph of L-alanine microcrystals. | ||
When a suspension is rotated about the z axis, the reciprocal b axis aligns parallel to the z axis, while the reciprocal a and c axes are in the xy plane, rotating in synchronization with the rotation of the suspending liquid medium.21 Typical in situ diffraction images obtained for an L-alanine MOMS (20–45 μm) are presented in Fig. 4, where Fig. 4a–c are the diffraction images captured for 30°< α < 40°, 80° < α < 90°, and 140° < α < 150°, respectively. The diffraction spots are asymmetrically distributed about the capillary rotation axis (horizontal) and the three diffraction images exhibit different patterns. Fig. 4d is a diffraction image taken without the shutter. In this case, the diffraction spots are distributed symmetrically about the sample rotation axis (horizontal), which is similar to a fiber diffraction pattern. The diffraction images obtained for 5 μm microcrystals are shown in Fig. 5. Here the diffraction spots are broader than those for 20–45 μm microcrystals because smaller microcrystals exhibit larger fluctuations in orientation. However, this quality of diffraction is sufficient for the subsequent analyses.
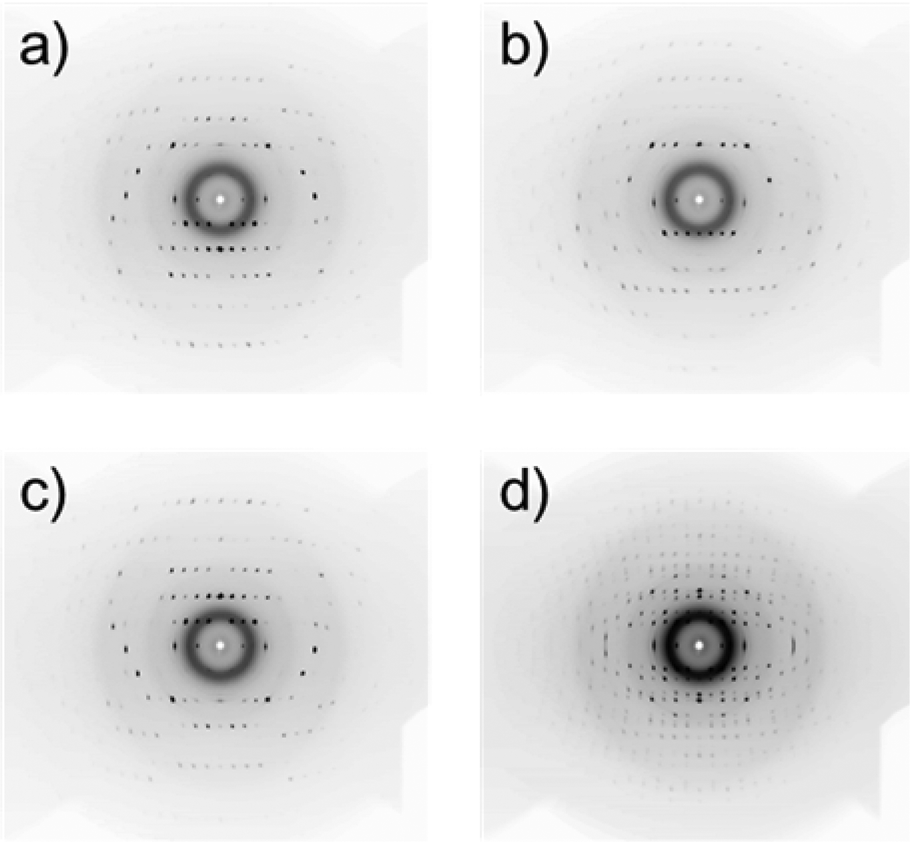 | ||
| Fig. 4 Polarized X-ray diffraction patterns of an L-alanine MOMS (particle size: 20–45 mm) taken at various angles of αs defined in Fig. 2, including (a) 30° < α < 40, (b) 80° < α < 90°, and (c) 140° < α < 150°. (d) A diffraction pattern taken without the shutter. | ||
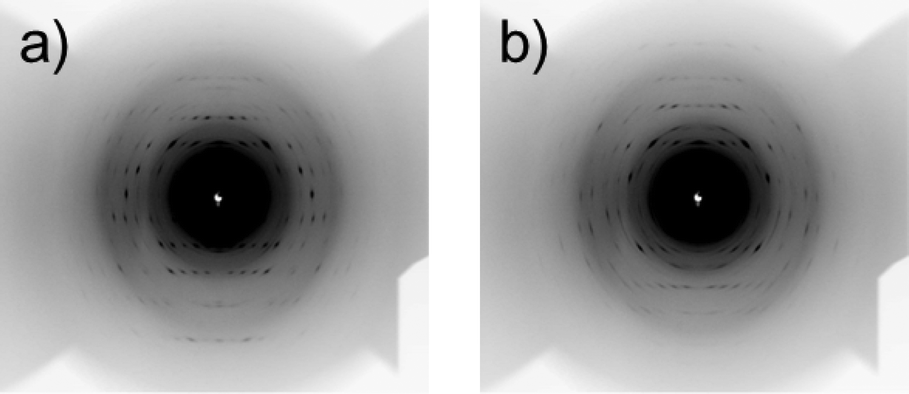 | ||
| Fig. 5 X-ray diffraction patterns of an L-alanine MOMS (particle size: <5 mm) taken under (a) 30° < α < 40° and (b) 80° < α < 90°. | ||
Crystallographic data determined using the MOMSs prepared from microcrystalline powders of 20–45 μm and <5 μm size are summarized in Table 1. They show good agreement with that reported in the literature.25
| Sample | L-Alanine MOMS (20–45 μm) | L-Alanine MOMS (<5 μm) | L-Alanine25 LALNIN53 |
|---|---|---|---|
| Crystal system | Orthorhombic | Orthorhombic | Orthorhombic |
| Space group | P212121 | P212121 | P212121 |
| Temperature (K) | 296 | 296 | 295(1) |
| a (Å) | 6.031(2) | 6.0350(17) | 6.035(1) |
| b (Å) | 12.318(4) | 12.316(3) | 12.361(3) |
| c (Å) | 5.779(2) | 5.7772 | 5.7762(9) |
| V (Å3) | 429.3(3) | 429.4(2) | 430.86(1) |
| Z | 4 | 4 | 4 |
| 2θmax | 51.9(Mo Kα) | 51.3(Mo Kα) | 52.74(Mo Kα) |
| Independent reflections | 3240(680) | 3242(684) | 3183(883) |
| Completeness | 0.845 | 0.851 | 1.00 |
| R int | 0.0315 | 0.0923 | 0.0427 |
| R 1 [F2 > 2σ(F2)] | 0.0421 | 0.0991 | 0.0378 |
| wR [all data] | 0.1012 | 0.3083 | 0.0736 |
| GOF | 1.106 | 1.060 | 1.044 |
| CCDC no. | 1055776 | 1429401 | 756484 |
The data completeness for both samples was about 85%, which is not very high because the diffraction was only collected about the sample rotating axis parallel to the χ3 ∥ b axis of L-alanine. By tilting the rotation axis of the capillary in the horizontal plane, the remaining XRD spots will be collected and the completeness will be increased. The structures determined are shown graphically in Fig. 6. Both of them are in good agreement with that determined from a single crystal reported in the literature.25
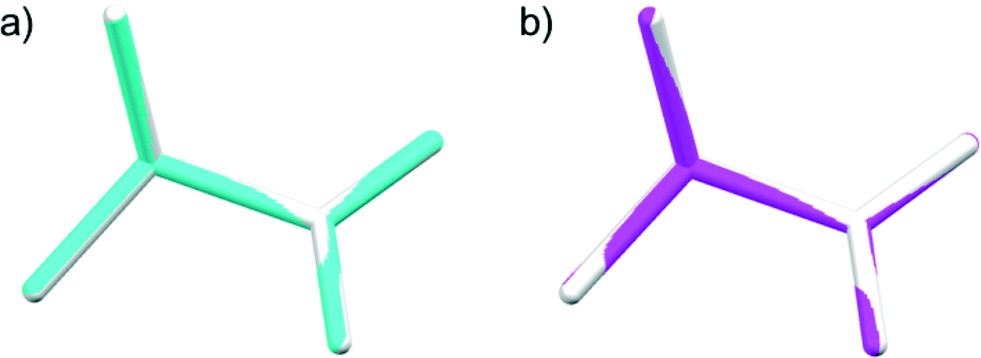 | ||
| Fig. 6 The structures determined by MOMS prepared from microcrystalline powders of a) 20–45 μm (blue) and b) <5 μm (pink) size are compared with the structure (white) reported previously.25 The root-mean-square deviations are 0.0037 Å and 0.0130 Å for a) and b), respectively. | ||
The crystal size limitation of this measurement can be estimated to be of submicron order as follows. The degree of orientation depends on the size of the microcrystals. Higher degrees of orientation can be achieved when the anisotropic magnetic energy markedly exceeds the thermal energy; that is, (2μ0)−1χaVB2 ≫ kBT, where kB is the Boltzmann constant, μ0 is the magnetic permeability of vacuum, T is absolute temperature, V is the volume of the microcrystal, and χa is χ1 – χ2 or χ2 – χ3, whichever is smaller. The larger the magnetic energy, the higher the degree of orientation. Inserting typical values of T = 300 K, B = 1T, χa = 10−7 (this value can be smaller or larger depending on the material), we obtain V ≫ 0.1 μm3, indicating that microcrystals of a few hundred nanometers in diameter can exhibit considerable orientation.
The crystallinity of the microcrystals also affects the degree of orientation through the value of χa. For example, if the mosaicity of the microcrystal is high, or a single particle is polycrystalline, χa becomes small, resulting in a low degree of orientation.
Conclusions
In this study, we demonstrated that single-crystal XRD analysis is possible from a microcrystalline powder by using an orientation attachment mounted on an in-house X-ray diffractometer. Single-crystal analysis of L-alanine microcrystals using this setup was performed, demonstrating that the determined crystal structure was in excellent agreement with that reported in the literature. This attachment allows the structure determination of microcrystals of 20 μm down to less than 5 μm in size only with in-house X-ray diffractometers, without a synchrotron X-ray source or the use of a powder diffraction method. This experimental circumstance will greatly facilitate the crystal structure determination required in various areas including chemistry, materials science, structural biology, pharmaceutics, etc.Acknowledgements
This work was financially supported by a Grant-in-Aid for Scientific Research (B) (No. 24 350 119 to T. K.) from JSPS.Notes and references
- L. Ooi, Principles of X-ray Crystalography, Oxford University Press, New York, 2010, pp. 112–122 Search PubMed.
- M. P. Blakeley, P. Langan, N. Niimura and A. Podjarny, Curr. Opin. Struct. Biol., 2008, 18, 593 CrossRef CAS PubMed.
- M. Adachi, T. Ohhara, K. Kurihara, T. Tamada, E. Honjo, N. Okazaki, S. Arai, Y. Shoyama, K. Kimura, H. Matsumura, S. Sugiyama, H. Adachi, K. Takano, Y. Mori, K. Hidaka, T. Kimura, Y. Hayashi, Y. Kiso and R. Kuroki, Proc. Natl. Acad. Sci. U. S. A., 2009, 106, 4641 CrossRef CAS PubMed.
- C. Giacovazzo, Acta Crystallogr., Sect. A: Found. Crystallogr., 1996, 52, 331 CrossRef.
- Structure Determination from Powder Diffraction Data, IUCr Monographs on Crystallography 13, ed. W. I. F. David, K. Shankland, L. B. McCusker and C. Baerlocher, Oxford University Press, Oxford, 2002 Search PubMed.
- K. D. Harris and E. Y. Cheung, Chem. Soc. Rev., 2004, 33, 526 RSC.
- G. Oszlányi and A. Süto, Acta Crystallogr., Sect. A: Found. Crystallogr., 2008, 64, 123 CrossRef PubMed.
- W. I. F. David and K. Shankland, Acta Crystallogr., Sect. A: Found. Crystallogr., 2008, 64, 52 CrossRef CAS PubMed.
- K. Fujii, M. T. Young and K. D. M. Harris, J. Struct. Biol., 2011, 174, 461 CrossRef CAS PubMed.
- K. Shankland, M. J. Spillman, E. A. Kabova, D. S. Edgeley and N. Shankland, Acta Crystallogr., Sect. C: Cryst. Struct. Commun., 2013, 69, 1251 CAS.
- A. Altomare, C. Cuocci, C. Giacovazzo, A. Moliterni, R. Rizzi, N. Corriero and A. Falcicchio, J. Appl. Crystallogr., 2013, 46, 1231 CrossRef CAS.
- P. A. Williams, C. E. Hughes and K. D. M. Harris, Angew. Chem., Int. Ed., 2015, 54, 3973 CrossRef CAS PubMed.
- W. Lasocha and H. Schenk, J. Appl. Crystallogr., 1997, 30, 561 CrossRef CAS.
- T. Wessels, C. Baerlocher and L. B. McCusker, Science, 1999, 284, 477 CrossRef CAS PubMed.
- J. Grässlin, L. B. McCusker, C. Baerlocher, F. Gozzo, B. Schmitt and L. Lutterotti, J. Appl. Crystallogr., 2013, 46, 173 CrossRef.
- T. Oda, K. Makino, I. Yamashita, K. Namba and Y. Maéda, Biophys. J., 1998, 75, 2672 CrossRef CAS PubMed.
- T. Oda, M. Iwasa, T. Aihara, Y. Maéda and A. Narita, Nature, 2009, 457, 441 CrossRef CAS PubMed.
- J. Y. Genoud, M. Staines, A. Mawdsley, V. Manojlovic and W. Quinton, Supercond. Sci. Technol., 1999, 12, 663 CrossRef CAS.
- T. Kimura and M. Yoshino, Langmuir, 2005, 21, 4805 CrossRef CAS PubMed.
- F. Kimura, W. Oshima, H. Matsumoto, H. Uekusa, K. Aburaya, M. Maeyama and T. Kimura, CrystEngComm, 2014, 16, 6630 RSC . References therein.
- M. J. Glucksman, R. D. Hay and L. Makowski, Science, 1986, 231, 1273–1276 CAS.
- N. Terada, H. S. Suzuki, T. S. Suzuki, H. Kitazawa, Y. Sakka, K. Kaneko and N. Metoki, Appl. Phys. Lett., 2008, 92, 112507 CrossRef.
- K. Matsumoto, F. Kimura, S. Tsukui and T. Kimura, Cryst. Growth Des., 2011, 11, 945 CAS.
- F. Kimura, T. Kimura, K. Matsumoto and N. Metoki, Cryst. Growth Des., 2010, 10, 48 CAS.
- V. S. Minkov, Y. A. Chesalov and E. V. Boldyreva, J. Struct. Chem., 2010, 51, 1052 CrossRef CAS . “CCDC Refcode: LALNIN53”.
Footnote |
| † Electronic supplementary information (ESI) available: Experimental details. CCDC 1055776 and 1429401. For ESI and crystallographic data in CIF or other electronic format see DOI: 10.1039/c5ce02307f |
| This journal is © The Royal Society of Chemistry 2016 |