
 Open Access Article
 This Open Access Article is licensed under a
 Creative Commons Attribution 3.0 Unported Licence
Alteration of texture and polymorph of phenytoin within thin films and its impact on dissolution
Christian
Röthel
abc,
Heike M. A.
Ehmann
d,
Ramona
Baumgartner
ae,
Daniela
Reischl
a and
Oliver
Werzer
*ab
aInstitute of Pharmaceutical Science, Department of Pharmaceutical Technology, University of Graz, 8010 Graz, Austria. E-mail: oliver.werzer@uni-graz.at
bBioTechMed – Graz, Austria
cInstitute for Solid State Physics, Graz University of Technology, 8010 Graz, Austria
dGraz University of Technology, Institute for Chemistry and Technology of Materials, Graz, Austria
eResearch Center Pharmaceutical Engineering GmbH, 8010 Graz, Austria
First published on 22nd December 2015
Abstract
Molecular order within a unit cell as well as with respect to a surface in general, has a decisive impact on the dissolution properties of drug molecules. In this work, a model system is investigated; the drug phenytoin (5,5-diphenylhydantoin) is spin coated onto silica surfaces. Amorphous films results which are then treated at different temperatures. This induces specific orientations (textures) of the unit cell and polymorphic form, thus alterations of organic molecule arrangement with respect to the surface result. Atomic force microscopy measurements reveal extended flat structures at low annealing temperatures (70 °C) while at 90 °C needles start to develop. Spherulites are observed at 100 °C and at 150 °C these spherulites transfer into elongated structures. The morphological differences are also reflected in distinct crystallographic properties as observed by specular X-ray diffraction and grazing incidence X-ray diffraction. A solely 001 texture of the bulk phase is present after annealing at 70 °C while treating at 150 °C results in a 010 texture of the phenytoin crystals. At intermediate temperatures, an additional 012 orientation of the bulk phase is present as well as fractions of a surface mediated phase are evident. Dissolution experiments on the different samples display strong deviations on the drug release into the dissolution media, which is discussed in terms of morphologies and crystalline properties.
Introduction
Complex multicomponent systems are currently one of the main routes for the development of new dosage forms to overcome the limiting factor of poor aqueous solubility. Strategies may focus on the formation of water-soluble inclusion complexes, self-(micro)emulsifying drug delivery systems,1,2 solid dispersions3,4 and solid solutions3 or nano-suspensions.5–8 These excellent new approaches are promising to achieve better dissolution properties. The numerous interactions within such many component systems involves the danger of undesired and/or unpredictable changes during production or storage. A very prominent example is ritonavir, which in some cases eventually shows a polymorphic phase transition on storage.9,10 While such changes are undesired upon storage, changes in the polymorphic form often alters the dissolution properties. For instance, specific selections of polymorphic forms may assist in fast bioavailability while another may be hardly soluble at all.11Crystal growth of drug molecules is often performed in bulk solutions.12 This enables different parameters to be set including temperature or degree of saturation. In some cases these crystallization approaches fails in their capability to induce specific polymorphs. A way to generate altered molecular arrangements is the introduction of environmental/geometrical constrains. Such constrains might be simply achieved by crystallization in the proximity of a solid surface.13–15 Surfaces minimize the entropy of a system and thus faster nucleation results. Furthermore, solid surface – drug molecule interactions may change the free energy of crystals, as the contact area contributes differently to the overall energy balance.16 Polymorphic forms which are not or only hardly accessible may be facilitated. One of the most prominent examples of distinct polymorphism near surfaces is pentacene on silica17 which assembles in the so called thin film phase. Another example that shows a surface dependent phase behaviour, is dioctylterthiophene.18 This material shows a monolayer phase in the interface region, a thin film phase for multilayers and a single crystal (bulk) phase for film growth far off the substrate surface. A pharmaceutical relevant molecule, phenytoin, forms a surface mediated polymorph.19 Besides the polymorphism, solid surfaces provide opportunities for certain morphologies forming.20–23 Variation in the morphology, especially the crystal size affects strongly the dissolution behaviour.
The route of preparation has, similar to the surface, a strong impact on the polymorph forming.18 For instance, spin coating is a well-established method for thin film preparation. The fast processing, typically a couple of seconds, induces likely structures and morphologies which are distinct from any bulk experiment. Often, surface mediated structures are observed.18 In some cases, the processing is fast so that the molecules assemble into a disfavoured amorphous phase.22,24 While such a state facilitates dissolution, long time stability often lack. Having an amorphous state at hand, manipulation via mechanical stress, thermal treatment or solvent vapour annealing might be explored to find/adjust new polymorphs and/or morphologies.20,22,25
In this study, the model drug phenytoin (5,5-diphenylhydantoin) is investigated within thin films. Recent reports of our groups showed that a versatile variation of the film forming properties can be employed.20–23 Drop casting and spin coating from one class of solvents results mainly in the bulk phase, but as the process parameters are varied the morphology strongly alters.21 Using tetrahydrofuran as solvent, drop casting induces a surface mediated/induced polymorph with faster dissolution capabilities.19 Fast vacuum deposition of phenytoin results in amorphous films, but these films could be transformed into crystalline forms via mechanical stress, solvent vapour annealing or after elongated time periodes.22 In this study, phenytoin is deposited via spin coating from an acetonitrile solution. This results, equally to the physical vapour deposition in amorphous thin films. These initially featureless films are than studied for their properties as high temperature had been applied. The crystalline properties are investigated by atomic force microscopy and X-ray diffraction experiments. Dissolution tests correlate the structural/morphological findings with the ability of these samples to release differently phenytoin into the surrounding media.
Materials and methods
Phenytoin purchased from Sigma-Aldrich (Germany, pharm. grade) was used without further treatment. An acetonitrile (spectroscopic grade from Fluka, Germany) solution containing 10 mg ml−1 phenytoin was prepared at slightly elevated temperatures of 40 °C and stirred prior use. Substrate surfaces were conventional single crystal silicon wafers (Siegert Wafers, Germany) with a thermal grown oxide layer of 150 nm providing a glass like surface character with isotropic surface properties. 2.5 × 2.5 cm2 sized pieces were undusted, sonicated in ethanol, sonicated in a 0.1 M NaOH solution and rinsed with Milli-Q water. These clean and highly hydrophilic surfaces were finally dried under a nitrogen stream.Sample preparation was performed in a two step process. Firstly, the solution was spin casted with a standard spin coating device onto the substrates with a spin speed of 17 rps for 30 seconds. This results in films of homogenous conformity without any crystalline feature, i.e. the film is amorphous after the spin coating process. Heat treatment in an oven induced crystallization in this study, with each films being exposed to a distinct temperature under ambient gas atmosphere (crystallization may eventually occur at ambient temperature at longer time scales,20,22 but this was of no interest for this study). Therefore, the temperature in the oven was pre-set to the desired temperature. Amorphous samples were placed then directly onto a metal plate located in the oven so that the sample reached fast the treatment temperature due to improved thermal contact. Each sample was hold for 2 hours in the oven to complete crystallization. Afterwards, temperature quenching to room temperature was performed by taking samples from the oven and placing them onto a plate temperate at ambient conditions.
The film morphologies results derive from FlexAFM atomic force microscope measurements equipped with an Easyscan 2 controller (all from Nanosurf, Switzerland). Scans were performed in non-contact mode using a TAP – 190 cantilever (Budgetsensors, Romania) with a nominal resonance frequency of 190 kHz. A scan rate of 0.5 s per line was used for all measurements. The experimental data were processed and evaluated using the software package Gwyddion.26
Crystallographic information was obtained via X-ray diffraction experiments. For specular measurements, i.e. for determination of the crystals contact planes,27 angular θ/2Θ scans with a Siemens D500 in Bragg–Brentano configuration were performed. A copper sealed tube provided X-rays which were guided through slits and monochromatized (wavelength λ = 0.154 nm) on the secondary side using a graphite crystal prior the scintillation detector. Data are depicted in scattering vector notation which derives from angular data via qz = 4πsin(θ)/λ. For crystallographic information, which are off the specular direction, grazing incidence X-ray diffraction (GIXD) measurements were performed on the Austrian SAXS beamline at ELETTRA.28 The experiment used a monochromatic beam of 0.154 nm which was guided through optical elements and finally narrowed/defined by slits. The samples were mounted on a moveable stage for alignment. Cancellation of direct X-rays resulted from a beam stop located directly after the sample. The diffracted signal was collected by a 2-dimensional 1M Pilatus detector which was about 17 cm off the sample surface centre. A movement of the detector was not performed, which results in some blind areas within the experiment. As sufficient amount of Bragg spots were present in the “non-blind” areas, this is of no importance for the evaluation and conclusion within this work. Data were processed using the X-ray utilities library,29 self written matlab code and/or the software package PyGID.30
The time dependent drug release from the substrate surface was investigated via non-standard dissolution experiments. Typically, standard dissolution experiments make use of an USP apparatus.31 Due to the small amount of phenytoin present at the surface another approach was more handy as only relative differences between the samples were of interest. Our test consisted of glass containers of about 4 cm diameter which were fixed and shook at 150 rpm on a horizontal shaker (IKA RS 10, IKA Werke GmbH & Co. KG, Germany). Amounts of 10 ml Milli-Q water were used for each sample. Note, this small amount was sufficient to guarantee sink conditions for this experiment; bulk phenytoin has a maximum solubility in Milli-Q water of about 40 μg ml−1. The amount of dissolved phenytoin was quantized with a Nanophotometer® (Implen, Munich, Germany) and standard cuvettes (Hellma, Germany). Withdrawn samples were placed back into the corresponding vessel after quantification so that the amount of media in each vessel remained unaffected. Values provided in this manuscript, are mean values of three individual samples; error bars are given as standard deviation, but for most of the data points these error bars are smaller than the data marker, meaning the reproducible significance for each kind of sample is given.
Results
Morphology
Phenytoin sample preparation via spin coating from an acetonitrile solution results in a film which is amorphous. This follows from the fact that no morphological feature is noticeable, neither in AFM measurements nor in optical microscopy. Similarly, X-ray diffraction experiments do not show any sign of a Bragg peak, which together with a broad amorphous hump supports the assumption that this state is amorphous (data not shown). In this study, defined heat treatments are applied to individual samples and the impact on the crystalline properties is investigated. Films heat treated at 70 °C, 90 °C, 100 °C and 150 °C, respectively, change into a crystalline state within two hours (other temperatures were also tested, but for sake of simplicity only temperatures at which significant changes occur are presented). Corresponding AFM height images of the resulting films are depicted in Fig. 1. While these scans show 100 × 100 μm2 areas these snapshots are representative for the entire surface area, i.e. the structural behaviour is alike all over the respective samples. At the lowest heating temperature of 70 °C, the featureless amorphous film transited into a slightly disrupted film. The disrupted structures connect with adjacent ones forming a network of phenytoin at the silica surface. These network structures have an average height of 57 nm which is slightly larger compared to the as-prepared sample which has about 48 nm (determined by X-ray reflectivity). As there are some vacant areas, this means the amount of material is unchanged on the transition into this type of structure. This follows from the fact that the film height multiplied by the coverage is proportional to the amount of material if roughly the same density is assumed.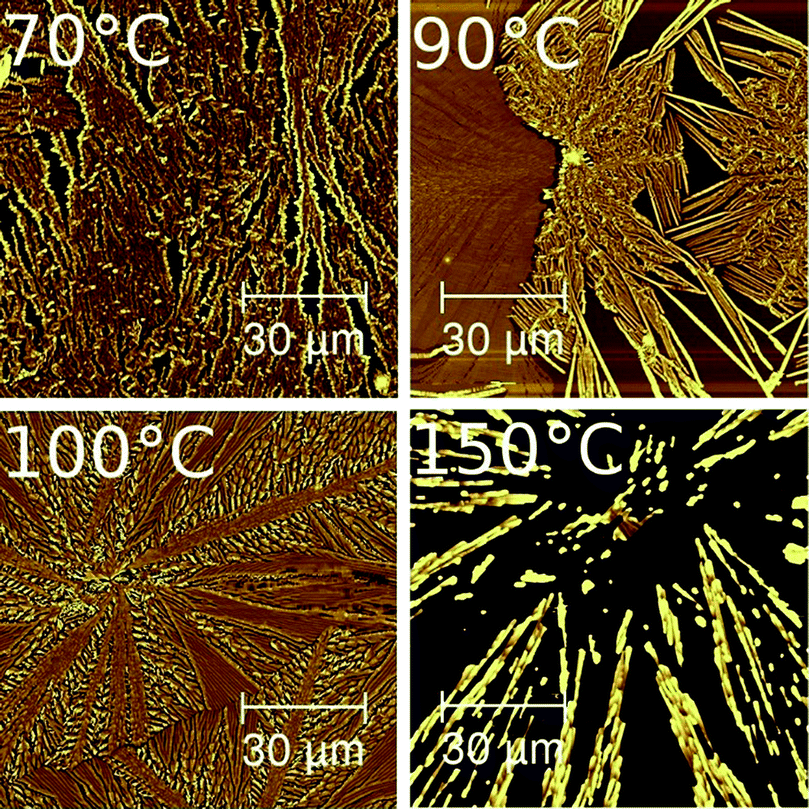 | ||
| Fig. 1 AFM height images of individual phenytoin thin films after heat treatment at various temperatures for two hours, respectively, in an oven. | ||
Increasing the oven temperature to 90 °C impact the sample properties. The AFM image reveals two distinct morphologies (see Fig. 1). In some areas, a fully closed phenytoin film (1/3 of the image at the left hand side) is present. The height is 30 nm while the lateral extension exceeds the image size of 100 μm. In contrast, other areas within the very same sample (scan) show a needle like morphology. A poor homogeneity of these needles is present; short needles of low height are present next to large needles. The dimension of the large needles extends 30 μm in length, up to 100 nm in width and 220 nm in height. While detailed evaluation maybe error prone due to poor statistic of such a limited sized AFM image, it is roughly the same amount of each morphology present.
Using a heating temperature of 100 °C, deviates the morphology compared to the previous two samples. From common centres, flat areas develop which run hundreds of μm along the surface (cf.Fig. 1). These structures are radial symmetric with respect to their respective centres which is typically denoted as spherulitic type growth. Adjacent spherulites separate by about 200 μm apart from each other. Within the AFM image of the 100 °C sample another spherulite (or domain) is located in the lower right hand corner with a clear border being present running through the image (see Fig. 1). In between these flat areas, structures with some vacant areas exist. These smaller structures apparently connect to the large structures thus growth of the smaller structure might facilitate the smaller structures. This indicates that controlled crystal growth takes place from the centre down to the small branches.
At the highest temperature tested, i.e. 150 °C, a spherulitic like structure is still present. However, compared to the previous samples, these structures seem to be strongly disrupted and large areas vacant of phenytoin exist. Needles align so that they point toward a common centre. The length is several hundreds of μm while the heights of up to 360 nm can be identified. This is significant higher compared to the previous structures observed after annealing at 100 °C. The height and the radial symmetric behaviour present may allow following that these structures form after spherulits type growth had developed. At the time span at such a high temperature, molecular diffusion of phenytoin facilitates minimization of silica contacts resulting in the apparent structures.
Specular X-ray diffraction
The specular X-ray diffraction scans depicted in Fig. 2 show the crystallographic behaviour for the various samples. These samples are those already depicted in Fig. 1, i.e. the measurements were taken at the exact same samples. At the lowest temperature treated, i.e. 70 °C, the X-ray scan shows one peak at qz = 8.1 nm−1 which correspond to the 002 peak of the phenytoin bulk phase with an orthorhombic unit cell of a = 6.2 Å, b = 13.6 Å, and c = 15.5 Å.32 As these films are thin, higher order peaks are not accessible due to the low diffraction power of phenytoin especially along this crystal direction. Typically, a specular scan is able to identify net planes lying parallel to the substrate surface, i.e. the most common contact planes with a surface. As only one peak is present, this suggests that the sample has a preferential texture with the 001 net plane being in contact with the silica surface.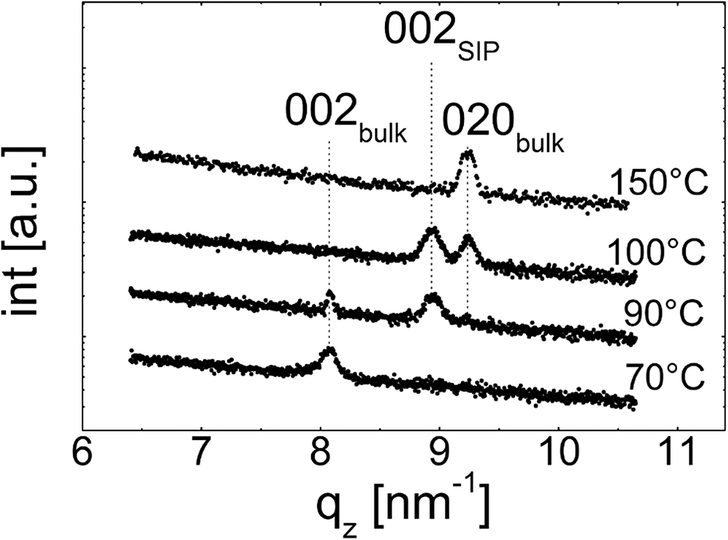 | ||
| Fig. 2 Specular X-ray diffraction scans of phenytoin samples heat treated at various temperatures. | ||
Increasing the heat treatment temperature to 90 °C does not only change the morphology of phenytoin film but also results in a change of the crystallographic properties. The 002 peak of the bulk phase is still present at 8.1 nm−1 (cf.Fig. 2). Another peak located at qz = 9.0 nm−1 is evident. This peak corresponds to another polymorph of phenytoin and represent the 002 peak of this “surface mediated phase”. The unit cell of this second phase is again orthorhombic with a = 6.1 Å, b = 12.2 Å, and c = 14.0 Å.17 This phase is, at least currently, only observed in the vicinity of a surface, which might justify a classification as a so called surface induced/mediated phase.
After heat treatment at 100 °C the 002 peak of the bulk at qz = 8.1 nm−1 is vanished (cf.Fig. 2). The peak belonging to the surface induced polymorph at qz = 9.0 nm−1 is present. In addition, this is accompanied by another peak located at qz = 9.24 nm−1. From the peak position follows that it belongs to the bulk polymorph. Other than previously, this peak represent the 020 peak of the bulk phase reflecting a change from a 001 to a 010 contact plane.
Treating a sample at 150 °C results in the surface mediated phase being vanished and only the 002 peak of the bulk phase remains in the specular scan. From this follows that the formation of the thin film phase is limited to a narrow temperature range. This is in well agreement with previous reports showing a monotropic phase transition is taking place at around 120 °C.19
Grazing incidence diffraction
To gain additional information on the crystalline properties with respect to the surface, grazing incidence X-ray diffraction experiment were performed. Typically, a specular scan is sufficient to gain such information, but as the diffraction power of phenytoin is low, the interpretation of specular data may be error prone. In GIXD measurements net planes which are nearly perpendicular to the surface are measured by employing a shallow incidence angle.27 Examples of such measurements for the various samples, represented in reciprocal space maps, are depicted in Fig. 3. For the sample prepared at 70 °C various high intensity features, which are visualized as brighter colours, are noted. A high intensity is typically a result of the X-ray beam and the crystal fulfilling the Laue condition, i.e. diffraction conditions are met and thus represents specific Bragg reflections. For this sample the most intense Bragg features are at qz = 8.1 nm−1 and qp = 0 nm−1 as well as at qz = 16.2 nm−1 and qp = 0 nm−1. This coordinates correspond to the 002 and 004 peaks, which were already identified in the specular scan (strictly speaking, within a GIXD experiment only one spot is exactly specular thus this peak information derives from a position slightly off the specular direction and an extrapolation along constant q). The peaks show smearing along rings of constant q, which is a measure of mosaicity within crystalline samples; for this sample a mosaic spread of about 30° is determined. This shows that a textural order is present, but due to the large mosaic spread this texture may be classified as poorly defined. High quality textured crystals of small molecules typical show mosaic spreads of lower 1°.17 Besides these specular peaks there are many other Bragg spots. For instance, at around (qz, qp) = (0.0 , 9.24) nm−1 or (4.0, 11.0) nm−1 the 020 and 111 reflections are evident. The pattern result from one crystal phase and one texture; 70 °C treatment results in solely the bulk phase in a 001 texture.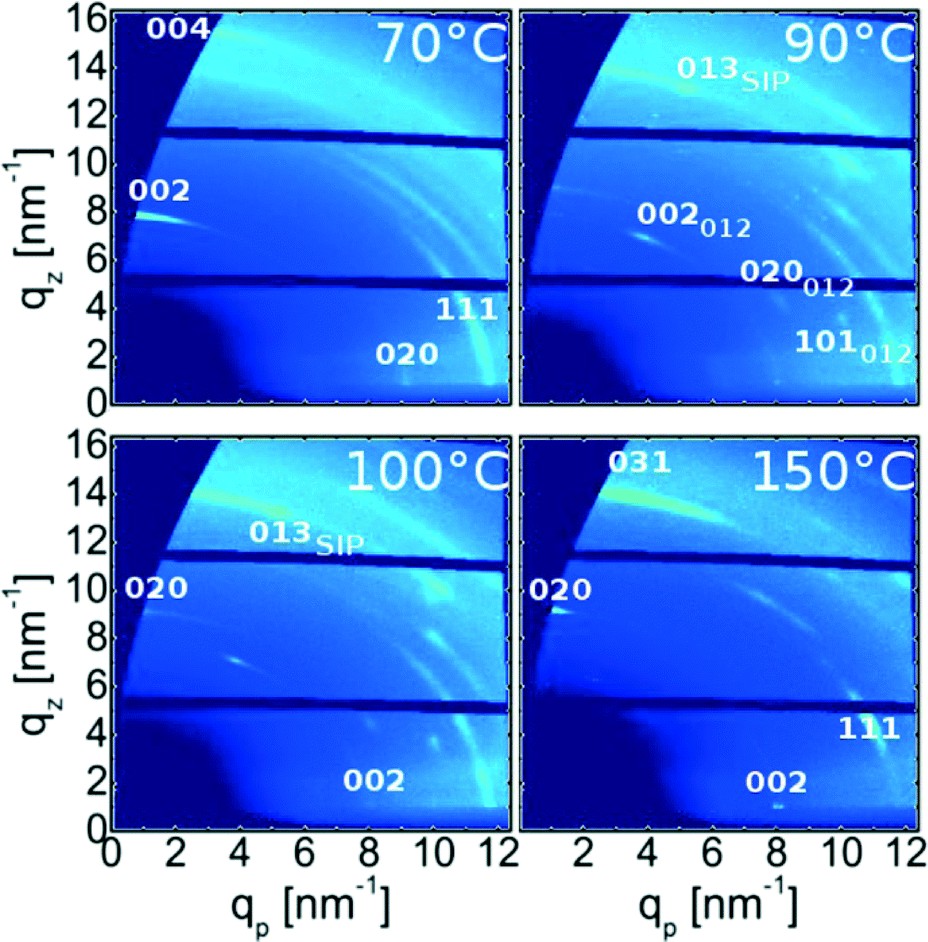 | ||
| Fig. 3 Grazing incidence X-ray diffraction patterns of various samples heat-treated at defined temperatures. Adjacent patterns share axis for sake of comparability. | ||
For the sample treated at 90 °C an alterations in the GIXD pattern results (cf.Fig. 3). While some peaks, corresponding to the bulk phase in a 001 texture, are still present additional explanations are required to understand other Bragg spots eminent in the pattern. The first couple of peaks originate from bulk phase adapting a 012 orientation/texture so that 002, 020 and 101 peaks locate in the lower region of the space map. The peak at qz = 13.51 nm−1 and qp = 5.14 nm−1 derives from phenytoin crystals in the surface mediated polymorph together with 001 texture thus making the reflection the 031 peak. This agrees with specular X-ray diffraction results. Other peaks of this phase are missing and are a result from poor statistics; large domains allow only a small number of crystals fulfilling the reflection conditions (Laue conditions) at a certain azimuthal angle. Anyway, the specular peak and the peak at qz = 13.51 nm−1 and qp = 5.14 nm−1 are very significant and explain only via the surface mediated phase.
After annealing at 100 °C the sample contains a complex GIXD pattern. Starting with peaks corresponding to the thin film phase, these are equivalent to the previous, i.e. these result from surface mediated phenytoin with a 001 contact plane. Some peaks derive from bulk phenytoin in a 012 texture which is the same as above. On the other hand, some fractions of bulk phase crystals show a “flipping” of the crystallites from the 001 into a 010 texture. This is apparent via the 002 peak which changed position from co-planar (qp = 0 nm−1) to in-plane (qz = 0 nm−1). Consequently, the 020 peak changed from in-plane to co-planar which means it “flipped” towards out-of plane.
150 °C treatment results in GIXD pattern reducing to peaks from bulk phase which have solely a 010 texture. Other peaks, which would indicate the presence of other textures or polymorphs, are absent. This means the sample is monomorphic, similar to those treated at 70 °C but with the contact plane being flipped/rotated. Furthermore, the mosaic spread, i.e. the smearing of the intensity along the Laue ring, reduces compared to samples annealed with at 70 °C and with solely 001 texture. This means that the order after heat treatment is better defined.
Dissolution testing
The release of phenytoin molecules located at the substrate surface into the dissolution media is evaluated as function of time. Milli-Q water was chosen, thus complex surface interactions are minimized, i.e. the information gained are mostly effected by the crystal morphology and polymorph rather than the solvent - substrate surface interactions. In Fig. 4a the drug release over time is depicted for all samples. In Fig. 4b the same data are plotted on smaller axes to highlight also slight differences. All film samples had fast drug release at the beginning of the experiment releasing 80% of the total phenytoin after 10 minutes. After this “burst” a more moderate release followed. For phenytoin samples prepared at 70 °C and 150 °C the total release requires more than 120 minutes; only after 24h 100% were detected. The other two samples, prepared at 90 °C and 100 °C, respectively, released all phenytoin after 120 min.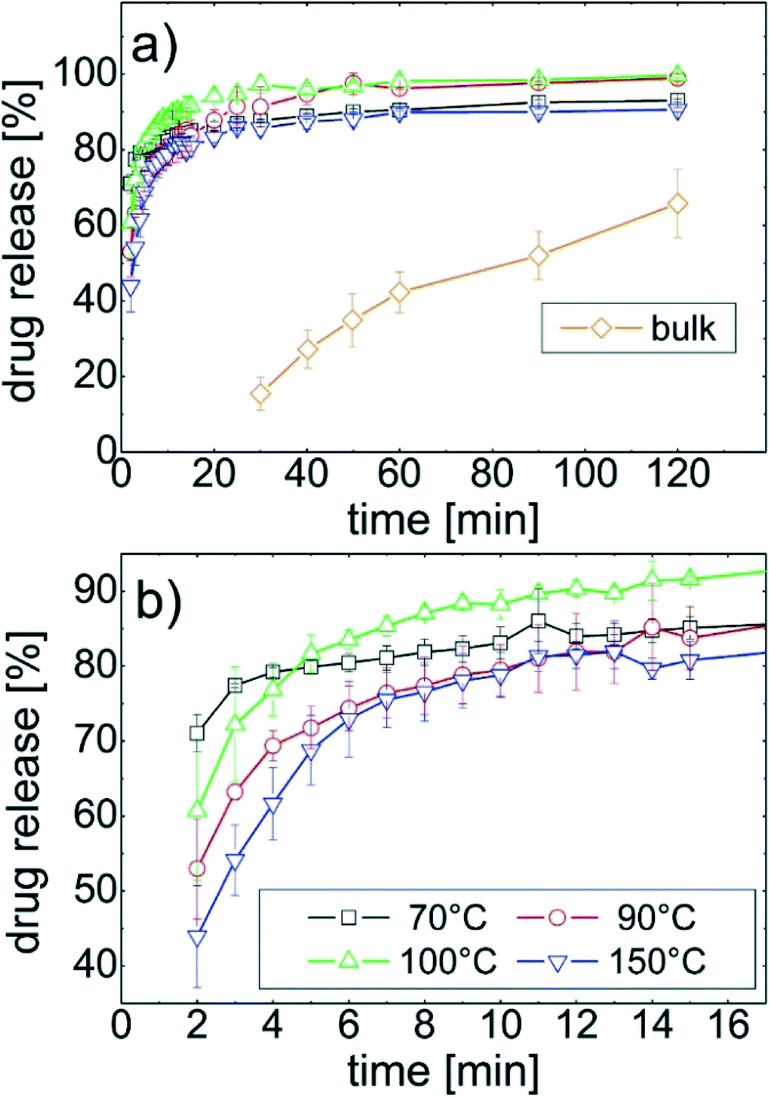 | ||
| Fig. 4 Drug release as function of time for samples prepared at various temperatures (a) (the bulk powder shows not significant value before 30 minutes). The same data zoomed for the initial release region (b). | ||
A more detail inspection, especially at the early dissolution stage reveal some differences (cf.Fig. 4b). After 2 minutes immersion, the 70 °C sample released more than 75% of the drug while the 150 °C sample only released 45%. As time progresses, the 70 °C sample had the largest dissolution rate decrease while the others seem to have a similar behaviour, i.e. the trajectory of the dissolution curves are alike. Nevertheless, after 15 minutes, the 100 °C sample released significantly more phenytoin compared to the others.
In contrast, the release from the bulk powder is slow. It takes 30 minutes to even be able to quantify some dissolved phenytoin. Another 90 minutes were required to end up with 60% of the drug release. This means thin films have a superior dissolution profile for application that demand fast dissolution while retarded release is accessible from the “pure” powder.
Discussion
The deposition of phenytoin via spin coating from an acetonitrile solution results in homogenous films which are amorphous. Amorphous films of phenytoin results from fast vacuum deposition.20,22 By using spin coating, like demonstrated here, the time requirements and the experimental effort minimize. Some recent results do not show the formation amorphous films via spin coating; ethanol, acetone or tetrahydrofuran are inappropriate to achieve amorphous films. This is surprising, as for instance tetrahydrofuran evaporates fast typically aiding amorphous film formation. Acetonitrile might remain in the films after spin coating preventing crystal formation. Additionally, the three rings in the chemical structure of phenytoin are highly flexible in the solution, which on solvent change likely confine differently and thus facilitates amorphous assembling on spin coating.In general, the amorphous state of phenytoin transfers into a crystalline state over long time periods at ambient conditions,20 solvent annealing20 or mechanical stress applicable via AFM22 but was of now interest in this study. Within this study treatments at distinct temperatures demonstrate their ability to induce tremendous effects on crystallization. At moderate temperatures of 70 °C phenytoin crystallizes in a flat morphology which hosted some vacant positions, i.e. it is only slightly disrupted. The crystalline film thickness compares to the amorphous film. This suggests only a slight deviating assembling from the amorphous state, i.e. molecular movement along far distances are absent thus crystal growth results from molecules in close vicinity. X-ray experiments (Fig. 2 and 3) show that phenytoin, annealed at 70 °C, results in solely bulk phase crystallites. The molecular packing of this situation is depicted in Fig. 5. H-bonding groups of adjacent molecules face each other, while their phenyl rings incline to the opponent. At 70 °C annealing temperature a 001 texture results. This means H-bonding sites and non-polar regions of the crystal alternatively arrange near the silica surface, thus van der Waals interactions and H-bonds with the substrate can form. However, the order is poorly defined as a large mosaic spread suggests. Effects like poor solid – solid compatibility, defects, slow molecular diffusion amongst others might account for this observations.
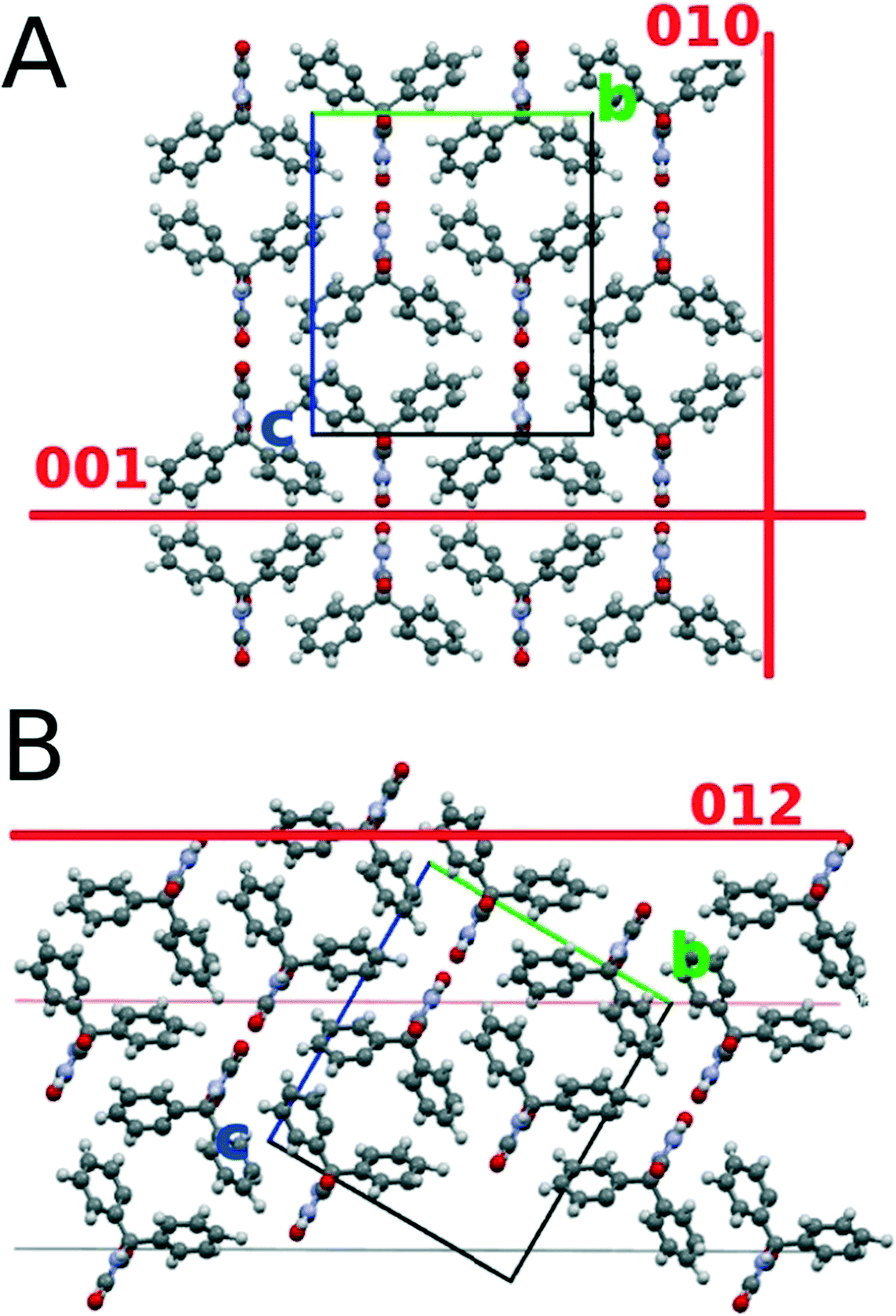 | ||
| Fig. 5 Arrangement of the phenytoin molecules within the unit cell of the bulk polymorph viewed along the unit cell a-axis. (A) the (001) and the (010) contact planes are indicated while (B) indicates the phenytoin contact for a (012) contact plane. The unit cell axis are indicated by green and blue lines. | ||
Sample treatment at 90 °C results in the sample showing similarities and differences compared to the previous sample annealed at 70 °C. Beside the crystal 001 contact plane, some fractions of “bulk like” phenytoin in the sample starts to develop a 012 contact plane. The molecular packing with respect to a surface is illustrated in Fig. 5B. The 012 results in mostly H-bonding sites being in contact with the silica surface, while apolar regions of the molecules deplete the substrate surface. Within this sample, a second polymorph is found. The polymorph is evident in the specular X-ray diffraction and GIXD experiments. Previously an orthorhombic unit cell of this new phase was found which is distinct from the bulk phase.17 A full structure solution of this phase is, however, lacking, i.e. the molecular packing in the unit cell is unknown. Due to the similarities of the unit cell dimension, the arrangement of the molecules is expected to be similar as well; molecules are likely only slightly shifted/rotated compared to the conformation in the bulk phase. It might be worse noting, even small deviation in packing often induce tremendous physical and chemical property changes of compounds in the solid state.17,33 This very polymorph was recently found in other experiments; for instance solvent vapour of toluene20 or spin coating from THF solution19 resulted in the formation of this phase. All results coincide in the fact that solid surfaces were required to induce/mediate the formation of this particular assembling. At this stage, phenytoin in this polymorphic form was not observed to form within bulk solution experiments. This further supports the fact that this phase is induced/mediated by the substrate. Often, such phases results from the kinetic being alterations.18 As various different techniques of distinct kinetics are capable of producing this polymorph,19,20 the confinement at the substrate seem to be the decisive factor.
Samples prepared at 90 °C reveal crystalline flat extended areas and needles. The X-ray experiments provide integral information, i.e. good statistic over the entire sample, detailed information from individual crystals are inaccessible. Thus correlations of individual crystal shapes and the textures/polymorphs cannot be given and require the usage of other experimental methods.
At 100 °C, the bulk crystallizes so that the texture flips from 001 into 010. Some phenytoin remains, similar to the 90 °C sample, with a 012 contact plane as well as phenytoin in the thin film phase polymorph is present. The 010 contact plane means a depletion of the H-bonding sites of phenytoin at the silica surface (see Fig. 5A); mainly the apolar regions of phenytoin are in vicinity to the surface. Also the morphology changes at this temperature. Spherulitic structures appear all over the sample surface. The larger, flat and elongated structures are accompanied by smaller structures.
An annealing temperature of 150 °C results in solely “bulk” crystals in a 010 texture. This means only apolar regions of the phenytoin molecules contact the surface (cf.Fig. 5A). The morphology are elongated structures. An alignment is evident so that all adjacent needles point towards a common centre. This suggests that initially spherulitic growth took place, which in a subsequent step “melts” and transfers into the apparent morphology. Previous experiments show a phase transition on heating, whereby a temperature of about 120 °C is required to initiate a transition from the surface mediated polymorph into the bulk.19 This explains well the observations of a single polymorph being present after treating at 150 °C. Furthermore, the disappearance of the smaller dendritic arm being present at 100 °C might allow to suggest that this structures are phenytoin in its thin film form.
The samples have a big variety of morphological and crystallographic properties which in general implies variations in the dissolution profile. In fact, distinct dissolution behaviour is observed. Firstly, independent on the heating temperature, the drug release time from thin films is significantly shorter compared to drug release from bulk powders. This demonstrates, that by applying thin films a strong alteration of the drug release is accessible allowing overcoming the limiting poorly aqueous solubility for phenytoin but likely also for others.
The usage of different temperature treatments is demonstrated to change the dissolution behaviour. The 70 °C sample initial bursts phenytoin with 70% released quickly. This distinguish from the 150 °C sample which released 43% in the same time frame. Both these samples consisted solely of bulk phenytoin but with one having a 001 texture and the other a 010 texture. In addition, the morphology remarkably differs with elongated flat areas after 70 °C treatment and crystalline needles after 150 °C heat exposure. From the Whitney–Noyes equation it is known, that faster release is a consequence from larger surface area, which is evident for the 70 °C sample. The boundary layer, i.e. the assembling of the water molecules next to the API varies at different facets, which typically supports/hinders dissolution.34,35 For the 001 texture the crystal surface may also show mostly 001 facets. This enables H-bonds formation at the water – drug interface facilitating dissolution.
While these facts explain these two samples containing solely the bulk polymorph, this is not as easily applicable to the others. Each sample has a different morphology, which per se changes dissolution profiles. Similarly, the change in the crystal orientation and the polymorphic form impacts drug dissolution. The dissolution profile trajectories seems to consist of segments of slightly different behaviour, which suggest different morphologies within samples are involved. Especially the 90 °C sample dissolved slowly at the beginning, but 40 min later a similar dissolution level as the 100 °C sample is reached. The amount of fast dissolving phenytoin fraction in the sample might be smaller compared to others but as time progresses this sample catches up.
Conclusion
The experiments show how a simple spin coating process and an oven can be used to generate phenytoin samples on solid surfaces with well defined properties. Furthermore, due to the initial amorphous state, various morphologies and crystalline structures are accessible, which also affects the dissolution; very fast, slightly retarded or strongly retarded releases is achieved. While the different dissolution behaviour is evident, the understanding of the underlying mechanism remains poor due. Except, samples prepared at 70 °C and 150 °C, which consist solely of the bulk polymorph and only deviate in their contact plane (texture), the difference in H-bonding sites might account for their differences. For the others, different morphologies being noted together with the complicated crystallographic characteristic requires other methods to gain more information and to identify correlations. Anyway, the outcome of this work motivates the usage of such an approach also for other systems, which might profit from dissolution manipulation, especially for such drugs of low aqueous solubility like phenytoin is.Acknowledgements
The work was funded by the Austrian Science Fund (FWF): [P25541-N19]. The authors want to thank the NAWI Graz for support. Elettra Sincrotrone is acknowledged for providing synchrotron radiation at the Austrian SAXS beamline. Heinz Amenitsch, we gratefully thank for the excellent support during the beamtime at the Austrian SAXS beamline at Elettra.References
- R. Neslihan Gursoy and S. Benita, Biomed. Pharmacother., 2004, 58, 173–182 CrossRef CAS PubMed.
- C. W. Pouton, Eur. J. Pharm. Sci., 2000, 11, S93–S98 CrossRef CAS PubMed.
- C. Leuner and J. Dressman, Eur. J. Pharm. Biopharm., 2000, 50, 47–60 CrossRef CAS PubMed.
- S. Schrank, B. Kann, E. Saurugger, H. Ehmann, O. Werzer, M. Windbergs, B. J. Glasser, A. Zimmer, J. Khinast and E. Roblegg, Mol. Pharmacol., 2014, 11, 599–609 CrossRef CAS PubMed.
- C. W. Pouton, Eur. J. Pharm. Sci., 2006, 29, 278–287 CrossRef CAS PubMed.
- B. E. Rabinow, Nat. Rev. Drug Discovery, 2004, 3, 785–796 CrossRef CAS PubMed.
- J. Khinast, R. Baumgartner and E. Roblegg, AAPS PharmSciTech, 2013, 14, 601–604 CrossRef CAS PubMed.
- R. Baumgartner, A. Eitzlmayr, N. Matsko, C. Tetyczka, J. Khinast and E. Roblegg, Int. J. Pharm., 2014, 477, 1–11 CrossRef CAS PubMed.
- J. Bauer, S. Spanton, R. Henry, J. Quick, W. Dziki, W. Porter and J. Morris, Pharm. Res., 2001, 18, 859–866 CrossRef CAS.
- D. K. Bucar, R. W. Lancaster and J. Bernstein, Angew. Chem., Int. Ed., 2015, 54, 6972–6993 CrossRef CAS PubMed.
- M. Pudipeddi and A. T. Serajuddin, J. Pharm. Sci., 2005, 94, 929–939 CrossRef CAS PubMed.
- Y. Gao, J. Wang, Y. Wang, Q. Yin, B. Glennon, J. Zhong, J. Ouyang, X. Huang and H. Hao, Curr. Pharm. Des., 2015, 21, 3131–3139 CrossRef CAS PubMed.
- Y. Diao, T. Harada, A. S. Myerson, T. A. Hatton and B. L. Trout, Nat. Mater., 2011, 10, 867–871 CrossRef CAS PubMed.
- P. DiMartino, P. Conflant, M. Drache, J. P. Huvenne and A. M. GuyotHermann, J. Therm. Anal., 1997, 48, 447–458 CrossRef CAS.
- M. Beiner, G. T. Rengarajan, S. Pankaj, D. Enke and M. Steinhart, Nano Lett., 2007, 7, 1381–1385 CrossRef CAS PubMed.
- Y. Diao, A. S. Myerson, T. A. Hatton and B. L. Trout, Langmuir, 2011, 27, 5324–5334 CrossRef CAS.
- H. Yoshida, K. Inaba and N. Sato, Appl. Phys. Lett., 2007, 90, 181930 CrossRef.
- B. Wedl, R. Resel, G. Leising, B. Kunert, I. Salzmann, M. Oehzelt, N. Koch, A. Vollmer, S. Duhm, O. Werzer, G. Gbabode, M. Sferrazza and Y. H. Geerts, RSC Adv., 2012, 2, 4404–4414 RSC.
- D. Reischl, C. Rothel, P. Christian, E. Roblegg, H. M. Ehmann, I. Salzmann and O. Werzer, Cryst. Growth Des., 2015, 15, 4687–4693 CAS.
- H. M. Ehmann, R. Baumgartner, B. Kunert, A. Zimmer, E. Roblegg and O. Werzer, J. Phys. Chem. C Nanomater. Interfaces, 2014, 118, 12855–12861 CrossRef CAS PubMed.
- H. M. Ehmann, R. Baumgartner, D. Reischl, E. Roblegg, A. Zimmer, R. Resel and O. Werzer, Cryst. Growth Des., 2015, 15, 326–332 CAS.
- H. M. A. Ehmann, T. Kellner and O. Werzer, CrystEngComm, 2014, 16, 4950–4954 RSC.
- O. Werzer, R. Baumgartner, M. Zawodzki and E. Roblegg, Mol. Pharmacol., 2014, 11, 610–616 CrossRef CAS PubMed.
- H. M. Ehmann, S. Winter, T. Griesser, R. Keimel, S. Schrank, A. Zimmer and O. Werzer, Pharm. Res., 2014, 31, 2708–2715 CrossRef CAS PubMed.
- H. M. Ehmann, A. Zimmer, E. Roblegg and O. Werzer, Cryst. Growth Des., 2014, 14, 1386–1391 CAS.
- D. Nečas and P. Klapetek, Cent. Eur. J. Phys., 2012, 10, 181–188 Search PubMed.
- M. Birkholz, Thin Film Analysis by X-ray Scattering, Wiley-VCH, Weinheim, 2006 Search PubMed.
- S. Bernstorff, H. Amenitsch and P. Laggner, J. Synchrotron Radiat., 1998, 5, 1215–1221 CrossRef CAS PubMed.
- D. Kriegner, E. Wintersberger and J. Stangl, J. Appl. Crystallogr., 2013, 46, 1162–1170 CrossRef CAS.
- A. Moser, O. Werzer, H.-G. Flesch, M. Koini, D.-M. Smilgies, D. Nabok, P. Puschnig, C. Ambrosch-Draxl, M. Schiek, H.-G. Rubahn and R. Resel, Eur. Phys. J.: Spec. Top., 2009, 167, 59–65 CrossRef.
- M. Gibson, Pharmaceutical preformulation and formulation: a practical guide from candidate drug selection to commercial dosage form, CRC Press, 2009 Search PubMed.
- A. Camerman and N. Camerman, Acta Crystallogr., Sect. B: Struct. Crystallogr. Cryst. Chem., 1971, 27, 2205–2211 CrossRef CAS.
- D. Nabok, P. Puschnig, C. Ambrosch-Draxl, O. Werzer, R. Resel and D. Smilgies, Phys. Rev. B: Condens. Matter Mater. Phys., 2007, 76, 235322 CrossRef.
- R. B. Hammond, K. Pencheva and K. J. Roberts, Cryst. Growth Des., 2006, 6, 1324–1334 CAS.
- R. Ho, D. A. Wilson and J. Y. Y. Heng, Cryst. Growth Des., 2009, 9, 4907–4911 CAS.
| This journal is © The Royal Society of Chemistry 2016 |