
 Open Access Article
 This Open Access Article is licensed under a
 Creative Commons Attribution 3.0 Unported Licence
Detection and characterisation of sub-critical nuclei during reactive Pd metal nucleation by X-ray absorption spectroscopy†
S.-Y.
Chang
a,
Y.
Gründer‡
ab,
S. G.
Booth
b,
L. B.
Molleta
a,
A.
Uehara§
b,
J. F. W.
Mosselmans
c,
G.
Cibin
c,
V.-T.
Pham
de,
L.
Nataf
d,
R. A. W.
Dryfe
b and
S. L. M.
Schroeder¶
*abc
aSchool of Chemical Engineering Analytical Science, University of Manchester, Manchester M13 9PL, UK. E-mail: s.l.m.schroeder@leeds.ac.uk
bSchool of Chemistry, University of Manchester, Manchester M13 9PL, UK
cDiamond Light Source Ltd., Diamond House, Harwell Science Innovation Campus, Fermi Ave, Didcot, Oxfordshire OX11 0DE, UK
dSynchrotron SOLEIL, L'Orme des Merisiers, Saint-Aubin, BP48, 91192, Gif-sur-Yvette, France
eCenter for Quantum Electronics, Institute of Physics, Vietnam Academy of Science and Technology, P.O. Box 429, Boho, 10000 Hanoi, Vietnam
First published on 3rd December 2015
Abstract
The interfacial reduction of aqueous [PdCl4]2− at the interface with an organic solution of ferrocene has been characterised by X-ray absorption fine structure (XAFS) spectroscopy. Use of a liquid–liquid interface as a model for homogeneous nucleation permits control of the thermodynamic driving force for nucleation, through variation of the [PdCl4]2− and ferrocene concentrations in the bulk of the adjacent phases. We demonstrate that this approach permits characterisation of the system under conditions of (i) no particle nucleation, (ii) fast spontaneous nucleation of stable nanoparticles and (iii) an intermediate state, in which formation of metastable Pd sub-critical nuclei takes place. Analysis of the XAFS spectra in the metastable state revealed a stochastically fluctuating equilibrium in which Pd nuclei are constantly formed and re-dissolved, as evident from oxidation state fluctuations detected by the Pd XAFS. Supersaturation was evidently sufficient to induce nanoparticle formation but insufficient for nuclei to grow beyond the critical cluster size. We were able to maintain a system in this metastable state for several hours. Such sub-critical clusters are predicted by classical nucleation theory, but have not been detected except in liquid-cell TEM imaging and scanning electrochemical microscopy studies.
1. Introduction
Insight into the electronic and structural properties of the metastable phases formed prior to spontaneous nucleation is currently the focus of considerable research activity in crystallisation science and crystal engineering.1–4 This work is performed with the ultimate aim of controlling the structure of the crystalline phases as well as the size of nanoparticulate products. Such control is currently limited by poor knowledge of the structural evolution that takes place in supersaturated solutions before nucleation and particle growth.In the process of particle formation from homogeneous solution a nucleus (or nuclei) must be formed by self-association of solute molecules and subsequently phase-separation from the bulk solution must take place.5 Classical Nucleation Theory (CNT) is usually applied as a conceptual framework for modelling these processes. CNT assumes that nucleation occurs from supersaturated solutions, leading to nuclei of a critical size whose internal structure matches that of the bulk material.6,7 It is therefore implicit in CNT that through dynamic equilibria unstable small clusters (‘sub-critical nuclei’) and other aggregates should form transiently in supersaturated solutions before the actual onset of nucleation. Likewise, supercritical nuclei may re-dissolve again7,8 and this has been in evidence for systems exhibiting oscillatory growth or dissolution.9–12 Furthermore, the structure of the nuclei initially formed may deviate significantly from the structure of the final equilibrium bulk materials.7,13 Processes such as desolvation and interaction between nuclei are also expected to influence the nucleation process and may need to be considered explicitly.7
A central research hypothesis in the field of nucleation from solution is that by following the solution structure (including solute speciation) from undersaturated to supersaturated concentrations and then to spontaneous particle formation may allow us to establish relationships between the structure of nuclei and the structure of crystallised final products.1–3,7,13–15 However, there are tremendous challenges for such experimental work, e.g., because of the complex nanoparticulate nature of the nuclei (sub-nm range), their unknown composition, low concentration and diffusive or convective movement, as well as the stochastic nature of nucleation events and the possibility that nuclei may be short-lived transient species with low concentration.2,7,16,17 These factors combine to render the prediction of the time and locus of nucleation events a major experimental challenge, especially when aiming to detect critical nuclei right at the onset of crystallisation.
Techniques applied to detect the early stages of nucleation should ideally be able to provide real time, in situ information, have high sensitivity and introduce minimal disturbance during measurements. Laboratory analytical techniques such as infra-red, Raman, NMR and UV-visible spectroscopy (especially when coupled with analytical ultracentrifugation) can in principle probe relevant molecular level information in supersaturated solutions,2 but the information provided is often too indirect to offer sufficiently incisive structural information. Bulk solution measurements also have low sensitivity to minority species present in low concentration. Nevertheless, recent studies using coupled solid and liquid state NMR,18 liquid cell TEM,9,19,20 analytical ultracentrifugation with UV-visible spectroscopy,21 small angle X-ray scattering (SAXS), and X-ray absorption fine-structure (XAFS)13,22–26 have made encouraging advances. Aside from experimental techniques, molecular dynamics simulation27,28 may also provide a promising means of studying the stability and structure of aggregates involved in the early stages of nucleation, although it is essential to correlate insights from simulation with experiment.
Here we describe an alternative approach to studying nucleation that is complementary to the experimental techniques mentioned above. Using XAFS spectroscopy we monitor nucleation at a liquid–liquid interface (the experiment is schematically illustrated in Fig. 1), thereby providing simultaneously chemical and structural information about the species present as a function of interfacial supersaturation. The interface between two immiscible liquids provides an elegant avenue to confining homogeneous nanoparticle nucleation and growth to a defined spatial region while permitting control of the thermodynamic driving force for nucleation.29–35 Spontaneous nucleation processes at the interface result in high local concentrations of particles, providing spectroscopic contrast29–35 and thereby a possibility to capture transient species involved in the early stages of nucleation.
 | ||
| Fig. 1 The liquid–liquid system used to study nucleation. The aqueous layer contains [PdCl4]2− and the organic layer (TFT) contains the reducing agent Fe(cp)2. Over time, Pd nanoparticles form at the liquid–liquid interface. Using fluorescence-yield detection we were able to follow the build-up of metallic Pd nanoparticles, determined from absorption coefficient profiles along the vertical axis, through the aqueous, interfacial and organic phases. The accumulation of Pd nanoparticles near the interface is clearly visible from a strong absorption peak due to the high density of Pd particles at the interface relative to the bulk solutions. | ||
XAFS is an excellent tool for in situ studies of local structure and speciation of transition metals in solution phases because the technique provides information on both the oxidation state of the X-ray absorbers as well as their chemical environment. For example, the number, elemental identities and distances of nearest neighbour atoms can be determined without the need for long-range order. XAFS has thus been widely applied to the study of metallic nanoparticles formed from solution and on solid supports, including Au, Ag, Pd, Pt, Rh and Cu, offering characterisation of the nanoparticulate products as well as mechanistic insights into particle formation in these systems.22
The XAFS study of interfacial Pd nucleation and nanoparticle formation at a liquid–liquid interface was performed by bringing an aqueous phase containing [PdCl4]2− into contact with an organic (ααα-trifluorotoluene, TFT) solution containing ferrocene, Fe(cp)2, which acts as the reducing agent:36
| [PdCl4]2–(aq) + 2Fe(cp)2(org) ⇌ Pd(interface) + 2[Fe(cp)2]+(org) + 4Cl–(aq) |
[PdCl4]2− is interfacially reduced by Fe(cp)2, leading to the nucleation of Pd metal nanoparticles. Since the nucleated particles are not soluble in the aqueous or organic phase, they remain concentrated at or near the interface due to adsorption.33 Our interest in this system arose from the fact that the rate of nanoparticle formation in this system was known to be slow enough33,37 to enable resolution of the transition from [PdCl4]2− to metallic Pd in situ by XAFS. Furthermore, the nucleation driving force can be controlled by changing the reactant concentrations, allowing control over the rate of nanoparticle formation from too slow to observe (no nanoparticles detected even after several days) to rapid (Pd nanoparticles visible within minutes). We can then follow the build-up of metallic Pd nanoparticles from the variation of the Pd K-edge absorption coefficient in the aqueous, interfacial and organic phases. As schematically summarised in Fig. 1, the accumulation of Pd at the interface is expected to become detectable through a strong Pd K post-edge absorption that is visible as a peak near the interface in a plot of the Pd edge step as a function of vertical distance z from the interface.
2. Experimental
Chemicals
The chemicals used were ammonium tetrachloropalladate(II) ([NH4]2PdCl4, Alfa Aesar, Premion grade, 99.998%), ααα-trifluorotoluene (TFT, Sigma Aldrich, ≥99%), ferrocene (Lancaster Synthesis [Alfa Aesar], 98%), bis(triphenyl-phosphoranylidene) ammonium chloride ([BTPPA]Cl, Sigma-Aldrich, ≥98%) and sodium tetrakis[3,5-bis(trifluoromethyl)-phenyl]borate (Na[TFPB], Alfa Aesar, ≥97%). The electrolyte [BTPPA][TFPB] was synthesised by salt metathesis of [BTPPA]Cl and Na[TFPB].38 Briefly, equimolar quantities of [BTPPA]Cl and Na[TFPB] were dissolved in a 2![[thin space (1/6-em)]](https://www.rsc.org/images/entities/char_2009.gif) :1:1 acetone:ethanol:water solution. The product was filtered under atmospheric conditions and recrystallized from 1:1 acetone:ethanol solution. Deionised water was used throughout the experiments.
:1:1 acetone:ethanol:water solution. The product was filtered under atmospheric conditions and recrystallized from 1:1 acetone:ethanol solution. Deionised water was used throughout the experiments.
Experimental set-up
We prepared the liquid–liquid system in 2 mL Eppendorf safe-lock tubes, as schematically shown in Fig. 1 by contacting equal volumes of aqueous [PdCl4]2− (with concentrations of either 1 or 5 mM) and organic TFT containing the reducing agent (4 mM Fe(cp)2). The nucleation rates were controlled by changing the [PdCl4]2− to Fe(cp)2 concentration ratio. The aqueous phase also contained 0.1 M LiCl and in the organic phase, 15 mM [BTPPA][TFPB] as background electrolytes. The open circuit potential (OCP) fluctuated over a range of ∼30 mV during the reaction due to ion transfer (ESI† A). The effect of interfacial potential on nucleation is currently under further investigation.XAFS spectra measurements and analysis
The data was obtained in fluorescence-yield mode at the quick EXAFS (QEXAFS) beamline, B18,39 at Diamond Light Source, UK, and in transmission mode at the dispersive XAFS beamline, ODE40 at Synchrotron SOLEIL, Gif-sur-Yvette, France. The synchrotron electron storage rings were operating with an energy of 3 GeV and a current of 300 mA at DIAMOND, and with 2.75 GeV and 430 mA at SOLEIL. Both B18 and ODE are bending magnet beamlines and use Si(311) crystals to provide the photon source. B18 has a flat Si(311) monochromator which scans through the energy range whereas ODE has a bent Si(311) polychromator which enables collection of the full energy range by a position sensitive CCD detector.At DIAMOND, a gas ion chamber was used to monitor the intensity I0 of the incoming monochromated X-ray beam. X-ray absorption spectra were monitored via fluorescence-yield, using a 9-element Ge solid state detector. Each spectrum was acquired over a period of approximately 3 minutes. The beam size was approximately 100 μm (height) × 250 μm (width). Using the Demeter software package41 the photon energy scale of each spectrum was calibrated to a simultaneously measured transmission spectrum of a Pd foil sample placed downstream of the liquid–liquid cell. The first derivative of the Pd K-edge metal absorption spectrum is known to have a maximum (E0) at 24360 eV.
It should be noted that for a given sample, the fluorescence-yield/I0 spatial profiles (e.g. those shown in Fig. 2) are proportional to the Pd absorption and hence the concentration profile of Pd as a function of position above and below the liquid–liquid interface. Between separate systems, however, the absolute fluorescence yield/I0 values can vary by an order of magnitude due to changes in the amplifier gain used to monitor I0 and variations in the position of the fluorescence-yield detector relative to the sample.
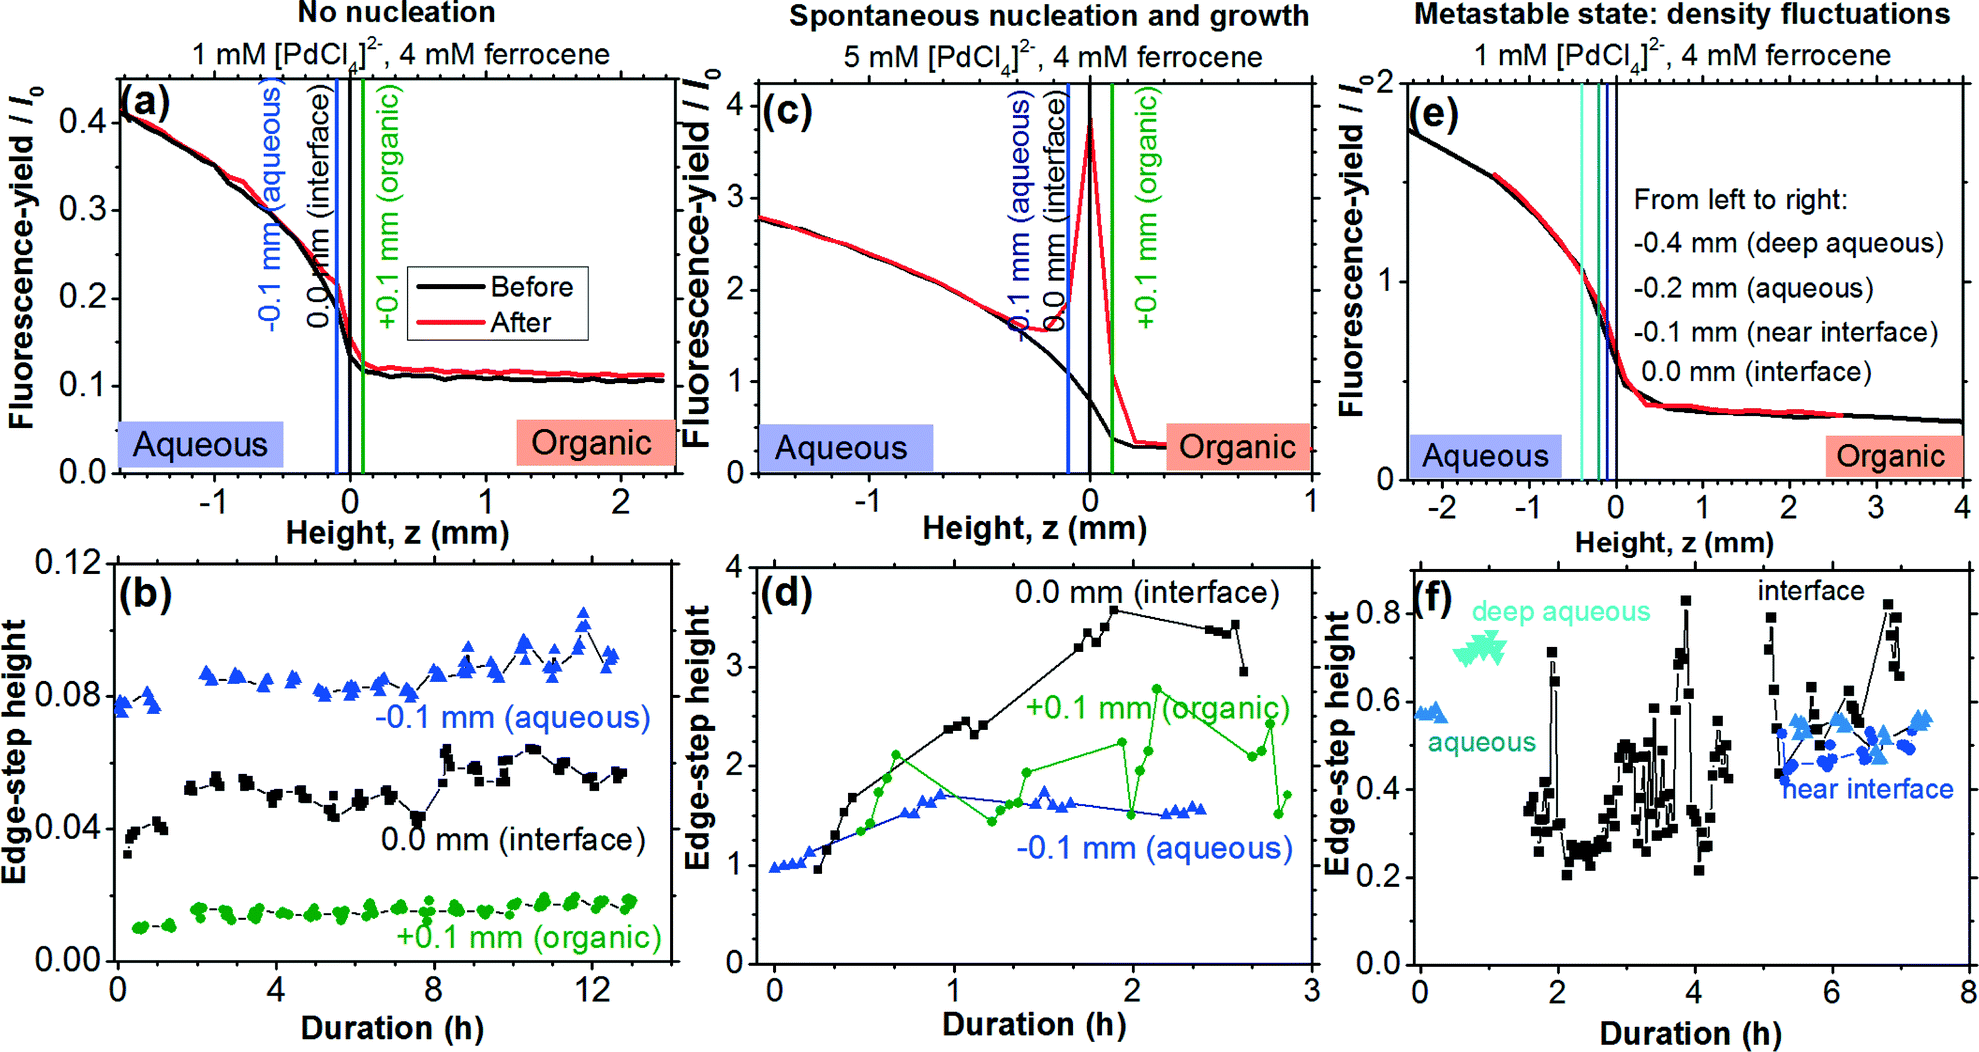 | ||
| Fig. 2 The different nucleating states. (a, b) No nucleation. (c, d) Spontaneous nucleation and growth. (e, f) The metastable state with fluctuating Pd density at the interface. Fluorescence-yield/I0 is proportional to the absorption coefficient. The height profiles in (a, c and e) were measured at E0. | ||
Dispersive XAFS measurements at SOLEIL were performed using a fluorescent scintillator screen and a Princeton Applied Research Pixis 400 CCD camera.40 The dispersive optics were set up to result in a beam size of approximately 50 μm (height) × 200 μm (width). Each measured spectrum was acquired over 100 frames with 250 ms time resolution resulting in a total collection time of 25 s. The same type of Eppendorf tube as in the DIAMOND experiments was used for these transmission experiments, but to achieve sufficiently high Pd K-edge absorption for transmission measurements the aqueous solution contained 10 mM [PdCl4]2− and 0.1 M LiCl in contact with a TFT solution containing 20 mM Fe(cp)2 and 10 mM [BTPPA][TFPB]. We note that the use of a Pd-coated mirror in the ODE beamline optics resulted in a complicated, non-linear transmission function of the spectrometer, which led to a distortion of the absorption spectrum in the X-ray absorption near-edge structure (XANES) region of the spectra.
Linear combination fitting analysis was performed to determine the Pd(0) and Pd(II) contributions to each XAFS spectrum, using Pd foil as the Pd(0) reference and aqueous [PdCl4]2− as the Pd(II) reference. The absorption edge-step heights in all spectra were determined using a script written in MATLAB2013a42 (ESI† D). The data were first smoothed using a Savitzky–Golay filtering algorithm. Using the smoothed data, the position of the edge-step was determined from the first maximum in the derivative of the spectrum (E0). The pre-edge background of the spectrum was fitted with a first order polynomial function while a second order polynomial was used to model the post-edge background. The pre-edge function was extrapolated into the post-edge region and subtracted from the experimental spectrum at E0 to quantify the edge-step height.
3. Results
Fluorescence-yield Pd K-edge X-ray absorption profiles measured at E0 as a function of vertical position relative to the liquid–liquid interface are presented in Fig. 2a, c and e. For all presented experimental results 4 mM of Fe(cp)2 was present in the organic TFT phase. It should be noted that the measured decrease in absorption across the interface is not as abrupt as one would expect because of the influence of the superimposed absorption in the meniscus, which had a curvature covering a length of ∼2 mm. Hence, for this paper, we loosely define ‘interface’ as the position of steepest change in the absorption coefficient, while ‘aqueous’ refers to the region adjacent to the bulk aqueous phase (but still influenced by the absorption in the meniscus region) and ‘organic’ refers to the region adjacent to the bulk organic phase (and also influenced by the meniscus).We note that all results presented below were independently reproduced using energy dispersive EXAFS transmission measurements. A selection of the transmission XAFS results obtained in dispersive mode are given in ESI† B. The discussion in this paper will focus on the fluorescence-yield QEXAFS data because they do not exhibit XANES distortions encountered with the dispersive XAFS beamline as mentioned in section 2.
No nucleation
In the absence of an interfacial reaction one expects a step-change in Pd absorption across the interface, reflecting the transition from absorption due to dissolved [PdCl4]2− in the aqueous phase to weak absorption in the Pd-free TFT phase.The case of a non-reacting interface is illustrated through the data in Fig. 2a, which were obtained with a 1 mM [PdCl4]2− aqueous solution in contact with the TFT phase. The time-dependent plots of the absorption Pd K-edge heights in Fig. 2b show that the Pd signal from the aqueous phase remains broadly constant at about 0.08, while a value of 0.01 characterises the organic phase. As one would expect in the absence of an interfacial reaction, the Pd absorption at the interface remains steady, at an intermediate value of about 0.045. No evidence for accumulation of Pd nucleation was detected even after 12 h of continuous XAFS monitoring (Fig. 2b).
Spontaneous nucleation and growth
Spontaneous nucleation was observed when the aqueous phase concentration of [PdCl4]2− was raised to 5 mM (Fig. 2c and d). Initially, before undergoing reaction, the absorption profile (Fig. 2c) had the same overall step function shape as the profile for the non-reacting system in Fig. 2a. There is significant absorption in the aqueous phase, an abrupt drop in absorption at the interface and weak absorption in the organic phase. As the reaction proceeds accumulation of Pd nanoparticles at the interface takes place, resulting in an intense interfacial Pd metal absorption peak at the end of the experiment. The quick build-up of stable metallic Pd nanoparticles due to spontaneous nucleation and growth is evident in the time-dependent plot of the absorption edge-step height at several locations along the meniscus (Fig. 2d).Metastable state: density fluctuations
The data in Fig. 2e and f were obtained with 1 mM aqueous [PdCl4]2−, the same experimental conditions that resulted in no nucleation in Fig. 2a and b. As shown in Fig. 2f, the Pd edge-step heights in the aqueous phase 0.4 mm, 0.2 mm and 0.1 mm away from the interface (labelled ‘deep aqueous’, ‘aqueous’, and ‘near interface’, respectively) were practically constant. The corresponding full XAFS spectra are shown in Fig. 3a and b. Superimposing all spectra reveals that no significant change is taking place as a function of time, showing that the overall Pd concentration in these regions of the aqueous phase remains essentially unchanged. However, at the interface, we observed that the Pd absorption fluctuated strongly and stochastically, with signal intensities between 0.20 and 0.83 for several hours (Fig. 2f). | ||
| Fig. 3 Further analysis of the metastable state. (a, b) Pd K-edge fluorescence-yield XAFS spectra as functions of vertical position and duration. (c) Time profile of Pd(0) ratio obtained from linear combination fitting. Solution closer to the interface has higher Pd(0) ratio showing that reaction happened at the interface. Pd(0) ratio fluctuated between 20.1% and 85.8% at the interface. (d) Edge-step height as a function of Pd(0) ratio. (e, f) Linear combination fitting of two selected XAFS spectra at the interface using Pd(0) and Pd(II) reference spectra. Fluorescence-yield/I0 is proportional to the absorption coefficient. | ||
We determined the ratio between Pd(II) and Pd(0) contributions in these rapidly changing interfacial spectra by linear combination analysis of XANES (Fig. 3c). Two examples of analysed spectra are shown in Fig. 3e and f. This examination of the balance between Pd(0) and Pd(II) revealed that the Pd intensity fluctuations (Fig. 2f) were accompanied by similarly strong variations of the oxidation state balance between Pd(II) and Pd(0) (Fig. 3c). These results show that Pd(0) metal is formed and re-dissolved in a stochastic manner, just as expected for a pre-nucleation equilibrium, and no formation of stable Pd metal particles is taking place. The latter becomes evident from the vertical absorption profile (Fig. 2e) measured at the end of the experiment; no significant accumulation of Pd particles at the interface is evident from the absorption profile. Moreover, in the deep aqueous, aqueous, and near-interfacial regions the trend is as expected; Pd metal contributions to the signal increase as the interface is approached (Fig. 3d). The Pd concentration was highest at the interface, confirming that the formation of transient metal particles is only taking place near the interface (Fig. 3c).
Through the data in Fig. 3e and f we can see that linear combination fitting using a reference spectrum of Pd foil reproduces the XANES and EXAFS regions of the experimental spectra very well, suggesting that the bulk Pd metal structure is a good model for the internal structure of transient metal species. This would imply that the size of the transiently formed Pd metal nuclei must be quite substantial. Although XAFS does not permit us to determine the actual size of these nanoparticles we can estimate the minimum size as the nanoparticles must grow to diameters beyond 3–5 nm in order to produce EXAFS amplitudes that resemble bulk Pd (Fig. S3†). We note in this context that a recent observation of Au nanoparticle9 formation by density fluctuations during the reduction of [AuCl4]− indicated a critical size of 25 ± 4 nm, which would be in line with our observations for Pd. However, the critical nucleus size is likely dependent on the chemical system as well as reaction conditions such as the temperature, concentration and reducing agent.
4. Discussion
Stochastic density fluctuation
As pointed out in the Introduction, CNT predicts a metastable pre-nucleation state with sub-critical nuclei or clusters in a dynamic equilibrium with solute monomers. Sub-critical nuclei should form stochastically, so fluctuation on microscopic length scales3 should take place as these sub-critical nuclei are not large enough to grow spontaneously. The existence of sub-critical clusters remained speculative until they were observed experimentally using scanning electrochemical microscopy (SECM) and in situ TEM (vide infra). A metastable pre-nucleation state has also previously been inferred for metal electrodeposition at a liquid–liquid interface. The initial growth rate of Pt at the liquid–liquid interface varied significantly leading to inconsistent responses which, it was proposed, were caused by the random nature of nuclei formation.43 Hindered nucleation of Au in the absence of heterogeneous sites also suggest that a metastable state was stabilised at a liquid–liquid interface.29In fact, the most interesting feature of our results is that we are able to detect the presence of Pd metal even before a stable metal product is actually formed. The liquid–liquid interface appears to have permitted us to capture and characterise the metastable state where the density of the subcritical nuclei fluctuates stochastically in a chemically driven nucleation process. This fluctuating state could be maintained for several hours without ever entering the growth stage to stable Pd nanoparticles.
The linear combination fitting analysis with a Pd foil reference spectrum suggests that relatively large Pd particles, practically bulk-like on the length scale probed by XAFS, were formed and re-dissolved to consume and re-form aqueous Pd(II) on a timescale of minutes. We note that the detection of remarkably bulk-like transient Pd(0) even without the occurrence of spontaneous nucleation (for example Fig. 3e and f) rules out the existence of significant concentrations of more complex pre-nucleation aggregates, clusters or other pre-nucleation phases involving Pd(0) species in this system. Reduction of [PdCl4]2− seems to result very quickly in the formation of substantial metal aggregates. We can of course not rule out that the [PdCl4]2− reduction to Pd(0) involves intermediates, but if these exist then their life-time is shorter than the timescales involved in forming the larger metal aggregates.
Sub-critical nuclei
Our XAFS observations of sub-critical nuclei are reminiscent of recent liquid-cell TEM results for the chemically very similar Au nanoparticle nucleation process from aqueous HAuCl4 solution.9 We detected evidence for a collective formation and re-dissolution equilibrium for Pd particles using XAS edge-step height analysis, while liquid-cell TEM visualised this equilibrium for Au nanoparticles. For the system used in this study, the reduction happened only at the liquid–liquid interface while liquid-cell TEM monitors reactions in the bulk phases, confined to a liquid film thickness of 200–500 nm. In both TEM and XAS studies the particle formation and re-dissolution process occurred on a time scale of minutes.In fact, Au nanoparticle formation from supersaturated solutions was found to fit classical nucleation and growth theory as reported in a simultaneous SAXS/wide angle X-ray scattering (WAXS)/UV-vis study.23 The dynamic equilibria in the liquid-cell TEM study are similar to those underlying oscillatory crystal growth or dissolution, which have been observed for bismuth, sodium chlorate and copper systems using liquid-cell TEM and SECM.10–12 The growing level of data in this area obtained by different techniques is reassuring, as it suggests reliability. The interfacial XAFS technique used here is another alternative means of studying metastable systems and has the flexibility to be applied to other systems aside from metallic systems as discussed below.
Information on how monomers associate and assemble during nucleation and whether the pre-crystalline structures relate to those in the crystalline products are essential in crystal engineering.1–4 A comprehensive fundamental understanding of these phenomena could enhance the predictive power of models for the physical and chemical properties of the products, such as morphology, reactivity, stability, solubility and melting temperature. These physical properties are related to the functionality of the crystals including in organic, metallic and biological systems.44
Interestingly, the existence of sub-critical nuclei in the metastable zone implies that the commonly used additives for permitting size-selective synthesis of nanoparticles influence the structure formation in the pre-nucleation region. For instance, cluster capping ligands may specifically interact with transiently formed nanoparticles of a certain size, or their action may take place through formation of co-aggregates with nascent metal particles, or perhaps even with the monomeric reactants. Understanding the structure variations in the pre-nucleation state and the interaction with additives in more depth may therefore enable the design of novel processes to control particle size and electronic structure.
Possible heterogeneous nucleation
Although we cannot state for certain that heterogeneous nucleation did not take place at all in our system, the long duration of observable metastability which per se includes a high concentration of the transient heterogeneous metal particles, suggests that nucleation of Pd on solid structures already assembled at the interface is negligible. As for the influence of the vessel walls, even under conditions where aggregated metal deposits were formed due to spontaneous nucleation, these deposits did not grow from the vessel walls but at the liquid–liquid interface.Possibility of X-ray induced artefacts
It is possible, as has been shown in other systems, for Pd to undergo variations in speciation when irradiated by an X-ray beam. Although it is difficult to quantify the magnitude of the effect of the X-ray beam on the reduction of Pd(II) alongside the contribution from ferrocene, there are a number of observations which we believe point to a minimal contribution from the beam in this study:(i) The aqueous Pd(II) concentrations remained stable even after several hours of measurements (for instance at the ‘aqueous’ and ‘deep aqueous’ positions in Fig. 2b and f).
(ii) As with the aqueous phase samples in the non-nucleating system (Fig. 2a and b) the edge-step heights were stable throughout the duration of the measurement.
Mechanical force such as stirring or shaking was not introduced during the measurements as the integrity of the liquid–liquid interface may be disrupted, which in turn would affect XAFS measurements. We would expect any Pd(0) formed by irradiation to accumulate along the beam path. In other words, if artefacts introduced by the X-ray beam were to be significant, we would expect a steady increase in Pd(0) and therefore edge step-height to increase in all of these systems independent of positions and concentrations which was not the case in the systems studied in this paper. X-ray beam artefacts seem to be insignificant compared to the actual physical and chemical effects at the liquid–liquid interfaces. It is worth mentioning though that [PdCl4]2− solution appears to be more stable under the X-ray beam than [AuCl4]− and [AuCl2]− where radiation-induced reduction has been reported previously.45,46
Metal deposition at the liquid–liquid interfaces
The interfacial XAFS data presented in Fig. 2 and 3 show that the use of a liquid–liquid system facilitates control over supersaturation and enables observation of a metastable supersaturated state and the detection of sub-critical nuclei involved in the nucleation of Pd. Although various XAFS studies have previously attempted to elucidate mechanistic scenarios for metal nucleation,13,23–26,29–31 this metastable state with density fluctuations has never been structurally characterised. The likely reason is that typically a chemically driven reactive nucleation in bulk solution takes place very rapidly due to extremely high supersaturation, causing invariably rapid spontaneous nucleation. The liquid–liquid interface employed in our study achieves low supersaturation at the interface through the mass transport limitations caused by insolubility of the reaction partners in the adjacent solvent. In other words, the system employed in this work relies on diffusion limited chemical control of the interfacial process through the variation in reactant concentrations.We have previously applied a potential bias to the liquid–liquid interface,29–31 examining reactant intermediates and behaviour in the spontaneous growth region.29–31 It is well known that the liquid–liquid interface may be polarised either internally through the use of a common ion or by external potential control applied using a potentiostat.35,47 Electrodeposition is more extensively used to study morphology and formation kinetics of metal formation in the spontaneous growth region.35,47 This paper focuses on the use of a non-electrified, chemically controlled interface as explained above, emphasising the metastable region which can be observed using time resolved XAFS, i.e. ∼3 min using QEXAFS instead of ∼30 min using conventional XAFS in our previous studies.29–31 We emphasise that this paper is the first time we have been able to observe the formation of sub-critical nuclei. Now that we are able to observe this metastable state, the combination of QEXAFS and electrochemical control at a liquid–liquid interface, whereby reactions may be “triggered” and the thermodynamic driving force for deposition varied in situ, promises to be a powerful combination for future study.
Applicability to other liquid–liquid interfaces
The technique described in this paper, i.e. using XAFS to probe the liquid–liquid interface, is by no means limited to nucleation studies or metallic systems. The technique has also been used to study solvation and orientation of bromide ions and zinc porphyrin at interfaces.48–51We have previously developed a windowless liquid–liquid droplet cell. Although initially used to study Au electrodeposition,24,25,46 the cell is also compatible with soft X-rays and could therefore be useful for a wide range of systems including organic and biological systems. Specifically, the liquid–liquid interfacial region can be used to study mass transfer, adsorption and heterogeneous reaction in thin layer material synthesis, biomembrane and solvent extraction.49,51–53
Aside from the interfacial region between two layers of immiscible solutions, liquid–liquid interfaces are also present in droplets/emulsion systems relevant for food, cosmetics, consumer products and pharmaceutical industries; thus widening the possible applications of XAFS on liquid–liquid systems. For instance, microbubbles which are potentially useful for site targeted drug carriers, can be selectively probed using scanning transmission X-ray microscopy (STXM), a simultaneous XAFS and microscopy technique.54
Conclusions
Our results show that use of the liquid–liquid interface and variation of the aqueous [PdCl4]2− concentration permits control of the thermodynamic driving force for the nucleation of stable Pd metal particles. With XAFS we were able to characterise the Pd speciation in systems that did not nucleate (low supersaturation), spontaneously nucleated (high supersaturation) and moderately supersaturated systems that remained in a pre-nucleation dynamic equilibrium state of density fluctuations. XAFS analysis clearly revealed a dynamic equilibrium involving Pd(II) and ordered bulk-like Pd(0). The growth and re-dissolution of such metastable metallic Pd particles takes place on a timescale of minutes. We have thus provided evidence of the presence of sub-critical nuclei of Pd metal before a stable metal product is actually formed, as predicted by CNT. Following reactions at a liquid–liquid interface is a promising method for mechanistic studies of nucleation, especially for chemically driven nucleation processes where control of the supersaturation is otherwise difficult to achieve.Acknowledgements
All data supporting this study are provided either in the results section of this paper or in the ESI† accompanying it. We thank Diamond Light Source for the award of beamtime on B18 under proposal number SP-8405. We also acknowledge Synchrotron SOLEIL for the award of beamtime on ODE under proposal number 20141060. The authors are also grateful to the two anonymous reviewers for their valuable feedback. RAWD and SLMS gratefully acknowledge financial support from the EPSRC through an EPSRC-NSF “Materials World Network” grant (EP/H047786/1). SLMS thanks EPSRC for financial support under the critical mass grant EP/I013563/1. AU thanks the Kyoto University foundation, for support of a sabbatical visit to The University of Manchester. SYC thanks The University of Manchester, Mr. and Mrs. Clews for the Robert Clews Presidential PhD scholarship.References
- J. Anwar and D. Zahn, Angew. Chem., Int. Ed., 2011, 50, 1996–2013 CrossRef CAS PubMed.
- R. J. Davey, S. L. M. Schroeder and J. H. ter Horst, Angew. Chem., Int. Ed., 2013, 52, 2166–2179 CrossRef CAS PubMed.
- D. Gebauer and H. Cölfen, Nano Today, 2011, 6, 564–584 CrossRef CAS.
- I. Weissbuch, M. Lahav and L. Leiserowitz, Cryst. Growth Des., 2003, 3, 125–150 CAS.
- J. Garside, A. Mersmann and J. Nyvit, Measurement of Crystal Growth and Nucleation Rates, Institute of Chemical Engineers (IChemE), Rugby, UK, 2nd edn, 2002 Search PubMed.
- D. Kashchiev, Nucleation: Basic Theory with Applications, Butterworth Heinemann, Oxford, 2000 Search PubMed.
- D. Erdemir, A. Y. Lee and A. S. Myerson, Acc. Chem. Res., 2009, 42, 621–629 CrossRef CAS PubMed.
- D. Kashchiev and G. M. van Rosmalen, Cryst. Res. Technol., 2003, 38, 555–574 CrossRef CAS.
- M. H. Nielsen, D. Li, H. Zhang, S. Aloni, T. Y.-J. Han, C. Frandsen, J. Seto, J. F. Banfield, H. Cölfen and J. J. De Yoreo, Microsc. Microanal., 2014, 20, 425–436 CrossRef CAS PubMed.
- H. L. Xin and H. Zheng, Nano Lett., 2012, 12, 1470–1474 CrossRef CAS PubMed.
- Y. Kimura, H. Niinomi, K. Tsukamoto and J. M. García-Ruiz, J. Am. Chem. Soc., 2014, 136, 1762–1765 CrossRef CAS PubMed.
- J. V. Macpherson and P. R. Unwin, J. Phys. Chem., 1994, 98, 11764–11770 CrossRef CAS.
- E. E. Finney and R. G. Finke, J. Colloid Interface Sci., 2008, 317, 351–374 CrossRef CAS PubMed.
- P. G. Vekilov, Cryst. Growth Des., 2010, 10, 5007–5019 CAS.
- J. J. De Yoreo, Nat. Mater., 2013, 12, 284–285 CrossRef CAS PubMed.
- J. J. De Yoreo and P. G. Vekilov, in Biomineralization, ed. P. M. Dove, J. J. De Yoreo and S. Weiner, Mineral Soc. Am., Washington D. C., 2003, pp. 57–93 Search PubMed.
- Z. Hammadi, R. Grossier, A. Ikni, N. Candoni, R. Morin and S. Veesler, Faraday Discuss., 2015, 179, 489–501 RSC.
- C. E. Hughes, A. Williams, V. Keast, V. Charalampopoulos, G. Edwards-Gau and K. D. M. Harris, Faraday Discuss., 2014, 179, 115–140 RSC.
- H.-G. Liao, K. Niu and H. Zheng, Chem. Commun., 2013, 49, 11720–11727 RSC.
- A. V. Ievlev, S. Jesse, T. J. Cochell, R. R. Unocic, V. A. Protopopescu and S. V. Kalinin, ACS Nano, 2015 DOI:10.1021/acsnano.5b03720.
- C. Voelkle, D. Gebauer and H. Coelfen, Faraday Discuss., 2015, 179, 59–77 RSC.
- Y. Sun and Y. Ren, Part. Part. Syst. Charact., 2013, 30, 399–419 CrossRef CAS.
- X. Chen, J. Schröder, S. Hauschild, S. Rosenfeldt, M. Dulle and S. Förster, Langmuir, 2015, 31, 11678–11691 CrossRef CAS PubMed.
- T. Yao, Z. Sun, Y. Li, Z. Pan, H. Wei, Y. Xie, M. Nomura, Y. Niwa, W. Yan, Z. Wu, Y. Jiang, Q. Liu and S. Wei, J. Am. Chem. Soc., 2010, 132, 7696–7701 CrossRef CAS PubMed.
- M. Harada and Y. Kamigaito, Langmuir, 2012, 28, 2415–2428 CrossRef CAS PubMed.
- J. Ohyama, K. Teramura, Y. Higuchi, T. Shishido, Y. Hitomi, K. Aoki, T. Funabiki, M. Kodera, K. Kato, H. Tanida, T. Uruga and T. Tanaka, Phys. Chem. Chem. Phys., 2011, 13, 11128–11135 RSC.
- R. Demichelis, P. Raiteri, J. D. Gale, D. Quigley and D. Gebauer, Nat. Commun., 2011, 2, 590 CrossRef PubMed.
- D. Toroz, R. B. Hammond, K. J. Roberts, S. Harris and T. Ridley, J. Cryst. Growth, 2014, 401, 38–43 CrossRef CAS.
- Y. Gründer, H. L. T. Ho, J. F. W. Mosselmans, S. L. M. Schroeder and R. A. W. Dryfe, Phys. Chem. Chem. Phys., 2011, 13, 15681–15689 RSC.
- Y. Gründer, J. F. W. Mosselmans, S. L. M. Schroeder and R. A. W. Dryfe, J. Phys. Chem. C, 2013, 117, 5765–5773 Search PubMed.
- S. G. Booth, A. Uehara, S. Y. Chang, J. F. W. Mosselmans, S. L. M. Schroeder and R. A. W. Dryfe, J. Phys. Chem. C, 2015, 119, 16785–16792 CAS.
- Y. Cheng and D. J. Schiffrin, J. Chem. Soc., Faraday Trans., 1996, 92, 3865–3871 RSC.
- C. Johans, R. Lahtinen, K. Kontturi and D. J. Schiffrin, J. Electroanal. Chem., 2000, 488, 99–109 CrossRef CAS.
- S. G. Booth and R. A. W. Dryfe, J. Phys. Chem. C, 2015, 119, 23295–23309 CAS.
- R. A. W. Dryfe, A. Uehara and S. G. Booth, Chem. Rec., 2014, 14, 1013–1023 CrossRef CAS PubMed.
- R. A. W. Dryfe, A. O. Simm and B. Kralj, J. Am. Chem. Soc., 2003, 125, 13014–13015 CrossRef CAS PubMed.
- M. Platt, R. A. W. Dryfe and E. P. L. Roberts, Electrochim. Acta, 2003, 48, 3037–3046 CrossRef CAS.
- D. J. Fermin, H. Dung Duong, Z. Ding, P.-F. Brevet and H. H. Girault, Phys. Chem. Chem. Phys., 1999, 1, 1461–1467 RSC.
- A. J. Dent, G. Cibin, S. Ramos, A. D. Smith, S. M. Scott, L. Varandas, M. R. Pearson, N. A. Krumpa, C. P. Jones and P. E. Robbins, J. Phys.: Conf. Ser., 2009, 190, 012039 CrossRef.
- F. Baudelet, Q. Kong, L. Nataf, J. D. Cafun, A. Congeduti, A. Monza, S. Chagnot and J. P. Itié, High Pressure Res., 2011, 31, 136–139 CrossRef.
- B. Ravel and M. Newville, J. Synchrotron Radiat., 2005, 12, 537–541 CrossRef CAS PubMed.
- MATLAB and Statistics Toolbox Release 2013a, The MathWorks, Inc., Natick, Massachusetts, United States Search PubMed.
- A. Trojánek, J. Langmaier and Z. Samec, J. Electroanal. Chem., 2007, 599, 160–166 CrossRef.
- J. T. Cartensen, Pharmaceutical Principles of Solid Dosage Forms, Technomic Publishing Co., Lancaster, PA, 1993 Search PubMed.
- Q. Ma, R. Divan, D. C. Mancini and D. T. Keane, J. Phys. Chem. A, 2008, 112, 4568–4572 CrossRef CAS PubMed.
- S.-Y. Chang, A. Uehara, S. G. Booth, K. Ignatyev, J. F. W. Mosselmans, R. A. W. Dryfe and S. L. M. Schroeder, RSC Adv., 2015, 5, 6912–6918 RSC.
- A. N. J. Rodgers, S. G. Booth and R. A. W. Dryfe, Electrochem. Commun., 2014, 47, 17–20 CrossRef CAS.
- H. Nagatani, H. Tanida, M. Harada, M. Asada and T. Sagara, J. Phys. Chem. C, 2010, 114, 18583–18587 CAS.
- H. Tanida, H. Nagatani and M. Harada, J. Phys.: Conf. Ser., 2009, 190, 012061 CrossRef.
- H. Nagatani, M. Harada, H. Tanida, H. Sakae and H. Imura, J. Chem. Phys., 2014, 140, 101101 CrossRef PubMed.
- H. Tanida, H. Nagatani and M. Harada, J. Phys.: Conf. Ser., 2007, 83, 012019 CrossRef.
- P. Peljo and H. H. Girault, in Encyclopedia of Analytical Chemistry, John Wiley & Sons, Ltd, 2006 Search PubMed.
- H. H. J. Girault and D. J. Schiffrin, Electrochemistry of Liquid-Liquid Interfaces, CRC Press, Texas, 1989 Search PubMed.
- G. Tzvetkov, B. Graf, P. Fernandes, A. Fery, F. Cavalieri, G. Paradossi and R. H. Fink, Soft Matter, 2008, 4, 510–514 RSC.
Footnotes |
| † Electronic supplementary information (ESI) available: Open circuit potential, dispersive XAFS results and the MATLAB script for edge-step height fitting. See DOI: 10.1039/c5ce01883h |
| ‡ Present address: Oliver Lodge Laboratory, Department of Physics, University of Liverpool, Liverpool L69 7ZE. |
| § Present address: Division of Nuclear Engineering Science, Research Reactor Institute, Kyoto University, Asashironishi, Kumatori, Osaka, 590-0494, Japan. |
| ¶ Present address: School of Chemical Process Engineering, Faculty of Engineering, University of Leeds, Leeds LS2 9JT. |
| This journal is © The Royal Society of Chemistry 2016 |