
 Open Access Article
 This Open Access Article is licensed under a
 Creative Commons Attribution 3.0 Unported Licence
Crystal structure of disordered nanocrystalline αII-quinacridone determined by electron diffraction†‡
T. E.
Gorelik
*a,
C.
Czech
b,
S. M.
Hammer
b and
M. U.
Schmidt
b
aInstitute of Physical Chemistry, University of Mainz, Jakob Welder Weg 11, Mainz, 55128, Germany. E-mail: gorelik@uni-mainz.de
bInstitute of Inorganic and Analytical Chemistry, Goethe-University Frankfurt am Main, Max-von-Laue-Str. 7, Frankfurt am Main, 60438, Germany
First published on 13th November 2015
Abstract
The nanocrystalline αII-phase of the industrially produced organic pigment quinacridone was studied by 3D electron diffraction of its crystals with a thickness of only 10 nm. The diffraction data showed strong diffuse scattering along one direction indicating severe stacking disorder. The average crystal structure was obtained from electron diffraction data using direct methods. In αII-quinacridone, the molecules are connected by a pair of hydrogen bonds thereby forming molecular chains, which are stacked, resulting in the formation of layers. The layers exhibit a stacking disorder with a mixture of herringbone and parallel arrangements, which explains the diffuse scattering. The crystal structure was confirmed by dispersion-corrected DFT calculations.
Introduction
Quinacridone (Pigment Violet 19, 1, Fig. 1) is an industrial organic pigment with an annual production of several thousands of tons and a sales volume of more than 100 million euros per year. | ||
| Fig. 1 Chemical structure of quinacridone, 1. | ||
This compound is used for colouration of automobile coatings, paints, plastics and high-grade printing inks.1 Quinacridone is insoluble in water and all solvents. In its application medium, as a coating, the quinacridone powder is not dissolved, but finely dispersed, whereby the crystal structure is maintained.
Quinacridone exists in four polymorphic forms2 which differ in colour and stability. The synthesis, depending on the conditions, results in the dull dark reddish-violet αI-phase, or in the carmine-red αII-phase. Treatment of the αI- or αII-phase with NaOH in suspension leads to the reddish violet β-phase. Heating a suspension in organic solvents leads to the red γ-phase. A large series of other phases has been described (BI, γ′, γI, γII, γIII, γIV, δ, Δ, two different ε-phases, and ζ),3 but a close inspection of their X-ray powder patterns revealed that all of them are either impure β- or γ-phases, or phase mixtures.2 The β- and γ-phases are more stable than the α phases and show high photostability, i.e. they are not bleached by light and weathering.4 Both the β- and the γ-phases are commercially sold as pigments.5
The quinacridone molecule itself is yellow;6 the reddish to violet shades of the crystal phases are apparently caused by hydrogen bonding and exciton coupling in the solid state.
The crystal structures of the β- and γ-phases were determined from single-crystal X-ray analyses.7 In 1994, the structure of the αI-phase was, to our knowledge, the first example of an organic structure solved by a combination of crystal structure prediction and X-ray powder diffraction.2,8 In the αI- and β-phases, the molecules are connected by double hydrogen bonds, thereby forming molecular chains. In the γ-phase, the molecules form a criss-cross pattern (Fig. 5).
The αII-phase is a nanocrystalline powder. Its X-ray powder pattern consists of a few peaks and humps (Fig. 2). All attempts to improve the crystallinity, by means of recrystallization or solvent treatment, failed: either the crystallinity did not change, or the material transformed into the more stable β- or γ-phases.
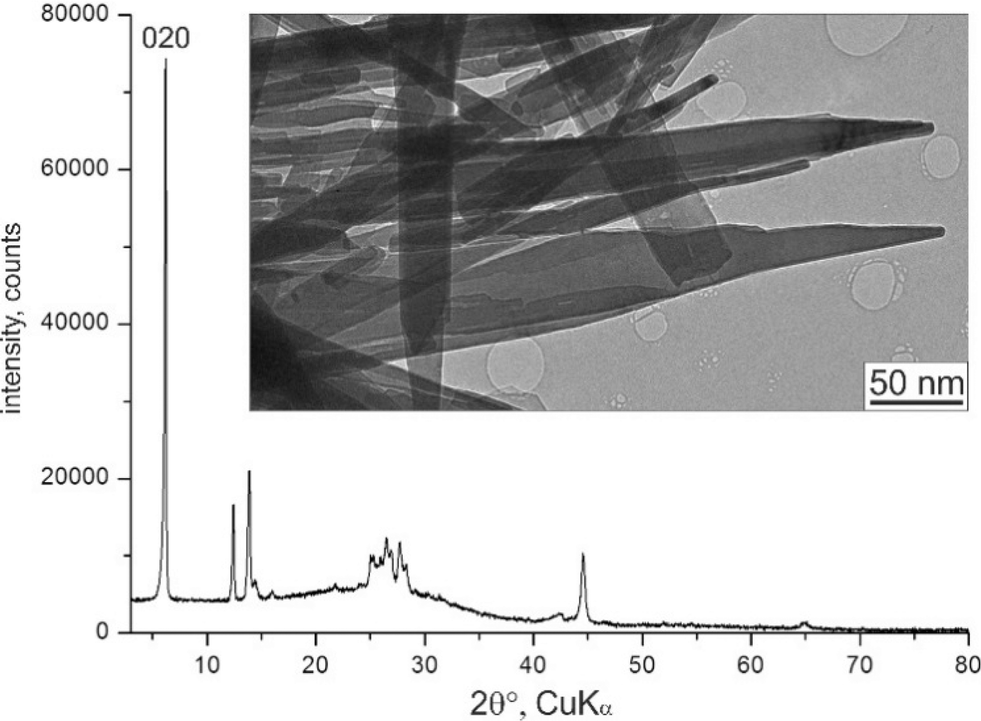 | ||
| Fig. 2 X-ray powder diagram and TEM image of αII-quinacridone crystals. The 020 reflection is marked. | ||
In 1996, Lincke suggested a criss-cross structure for the αII-phase. He constructed a structural model with two independent molecules in a triclinic unit cell, and performed a manual fit to the X-ray powder data.10 However, the fit was not of satisfactory quality. Later, lattice-energy minimisation by dispersion-corrected DFT methods revealed that this structure was not correct.2
Infrared spectroscopy indicates that the αII-phase possesses a chain structure like that of the αI- and β-phases, and not a criss-cross-structure like that of the γ-phase. Pair-distribution function analysis11 shows that the local structure of the αII-phase is similar to that of the αI-phase, which again points to a chain-like structure.
The X-ray powder pattern could not be indexed reliably, and all attempts to solve the structure using the X-ray powder data were unsuccessful. The use of synchrotron diffraction data did not help either, because the peak widths are caused by the small domain size of the crystals, and not by the instrumental parameters.
In recent years, the employment of electron diffraction for crystal structure analysis has experienced a revival with the development of automated techniques for data collection and processing.12 Since the interaction of electrons with matter is much stronger than that of X-rays, and due to the flexibility in focussing the electron beam, sensible single-crystal electron diffraction data can be collected from crystals of size down to 50 nm. An electron diffraction experiment is typically done using a transmission electron microscope (TEM). The crystal is tilted around a goniometer axis and the electron diffraction patterns are collected sequentially, thereby mimicking a single-crystal X-ray experiment. From a set of collected 2D diffraction patterns, a 3D reciprocal volume can be reconstructed, giving information on the lattice parameters, crystal symmetry, and reflection intensities for structure determination. Despite the problems associated with dynamic and multiple scattering in electron diffraction, a series of inorganic crystal structures have been determined by electron diffraction within the last few years.13
The study of organic compounds represents a particular challenge to electron crystallography, due to the fast deterioration of soft matter under the electron beam. Electron diffraction is usually used in combination with other methods (powder X-ray diffraction, NMR, simulations) as additional information to support the structure analysis.14 Nevertheless, reports on successful structure analyses of molecular crystals from electron diffraction data alone have recently started to appear.15
Therefore, here we used electron diffraction for the structure determination of nanocrystalline αII-quinacridone.
Experimental
Materials
A sample of αII-quinacridone was obtained from Clariant (Frankfurt am Main), and used as received.TEM sample preparation
A small quantity of αII-quinacridone was suspended in hexane using an ultrasonic bath. A drop of the suspension was then placed onto a holey carbon-coated copper grid and dried in air.Electron diffraction experiments
Electron diffraction experiments were done using a TECNAI F30 transmission electron microscope operating at 300 kV equipped with an STEM unit. Electron diffraction data were collected at room temperature in nanodiffraction mode using the dedicated automated diffraction tomography (ADT) module in STEM mode. The beam diameter for nanodiffraction collection was 100 nm. The data were recorded onto a 1k GATAN 794 MSC CCD camera and a US4000 GATAN CCD camera. Seven diffraction tilt series were collected in total, each of them within the 120° total tilt range with a tilt step of 1°. Since the crystals were larger than the spot size used (100 nm), we could minimize the sample beam damage by repeatedly shifting the electron beam along the crystal during the measurements, thereby always recording data from a “fresh” part of the crystal. Electron diffraction data processing was done using the ADT3D software (NANOMEGAS, Belgium) reinforced by in-house written MatLab scripts.Structure solution
The structure was solved using direct methods implemented in the SIR software. 1031 independent input reflections within the resolution limit of 0.8 Å were used. For the space group P21/c, the Rint(F) of the data set was 28.79%, completeness was 68%, and B(iso)/u(iso) = 3.501/0.0443. The final residual of the structure solution R(F) was 35.01%.Structure refinement
The structure refinement on the basis of electron diffraction data was performed in SHELX using distances and planarity restraints/constraints on the molecular geometry. In total, 37 parameters were refined using 1031 reflections. Two thermal factors became negative (the oxygen atom and a carbon atom of the middle phenyl ring), others were in a reasonable range. The final structure had an R(I) factor of 64%. In this case, the refinement could not serve as a proof of the structure correctness. The high figures of merit for electron diffraction compared to X-ray diffraction are due to significant intensity perturbations caused by the diffuse scattering, multiple scattering and other uncertainties associated with electron diffraction data.X-ray powder data
X-ray powder data were recorded at room temperature in transmission geometry on a STOE-STADI-P diffractometer equipped with a curved Ge (111) primary monochromator and a linear position-sensitive detector, using Cu-Kα1 radiation (λ = 1.5406 Å).DFT calculations
DFT calculations were performed with CASTEP16 with the PBE functional17 combined with the semi-empirical dispersion correction by Grimme.18 The convergence criteria for energies, forces, cell stress and Cartesian displacements were 0.001 kJ per mol per atom, 3 kJ mol−1 Å−1, 0.5 kbar and 0.001 Å.Results and discussion
The investigated sample of αII-quinacridone consisted of long lath-habit crystals with a length of up to a few microns, a width of less than 100 nm and a thickness of only 5 to 10 nm (Fig. 2).Seven electron diffraction data sets from different crystals were collected. For each data set, individual diffraction patterns were combined to obtain 3D reciprocal volumes. The 3D volumes of all studied crystals were similar and consisted mostly of parallel diffuse streaks (Fig. 3b). The streaks were arranged in a regular pattern (Fig. 3a). Most of the diffuse streaks were continuous and did not show any pronounced intensity maxima that could have been interpreted as Bragg reflections (Fig. 3c). Only the central column consisted of sharp reflections without any diffuse scattering. This type of diffraction pattern is typical for a sheet structure with severe stacking disorder.19
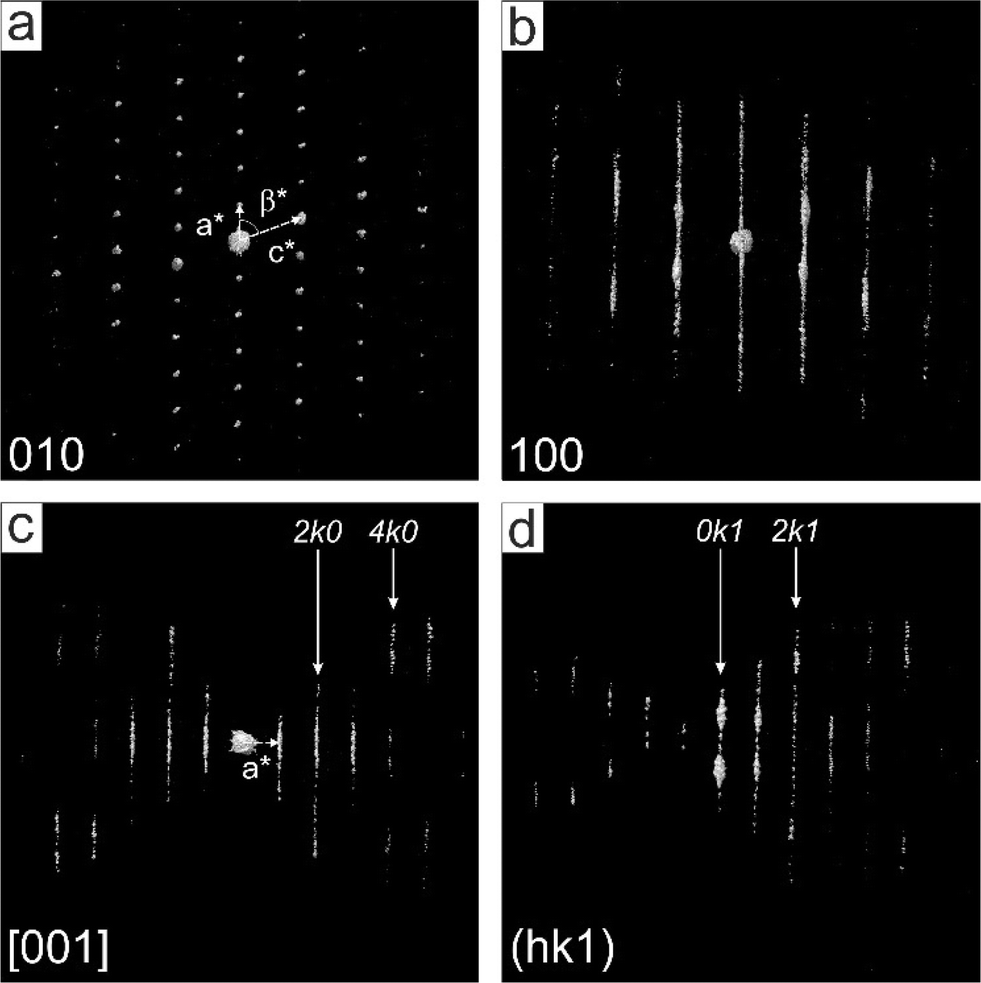 | ||
| Fig. 3 3D reciprocal volume of an αII-quinacridone crystal: a) projection of the volume along the b* direction showing resolved periodicity along the a* and c* axes; b) projection of the volume along the a* direction (the b* axis comprising diffuse scattering lines is vertical); c) central cut of the reciprocal volume including the a* and b* (vertical) axes, the periodicity along the vertical lines is not evident; d) l = 1 layer cut through the reciprocal space, reflections rows showing discrete periodic spots are marked. | ||
Due to the absence of sharp reflections in most parts of the reciprocal volume, the determination of the unit cell parameters was challenging and had to be done manually in several steps.
• The direction of the diffuse streaks was assigned to the b* axis.
• a*, c* and β* could be obtained from the projection shown in Fig. 3a.
• The values of b*, α* and γ* were difficult to determine, due to strong diffuse scattering. Furthermore, most crystals were oriented with their b* axes parallel to the electron beam, so that the 0k0 reflections could not be observed directly. Accidentally, a crystal with a different orientation was found, which allowed the recording of an electron diffraction pattern including the b* axis, revealing systematic extinctions of 0k0 reflections with the reflection rule k = 2n. Since triclinic space groups do not have systematic extinctions, the crystal system must be at least monoclinic. As the angle β* is oblique, b must be the unique axis, consequently, α = γ = 90°.
• The monoclinic crystal system is confirmed by the overall distribution of the intensities of the 3-dimensional diffraction patterns, which follows a 2/m symmetry (Laue class 2/m = C2h), corresponding to a monoclinic crystal system.
• The accurate length of the b vector was finally determined from the (020) reflection clearly resolved in the X-ray powder diagram (Fig. 1).
The resulting unit-cell parameters were a = 7.1 Å, b = 28.4 Å, c = 3.9 Å, β = 110°, α = γ = 90°, see Table 1. The unit cell volume of 734 Å3 corresponds to two molecules per unit cell. The systematic extinctions of the 0k0 reflections show the presence of a 21 screw axis.
| Crystal phase | αI | αII | β | γ |
|---|---|---|---|---|
| Ref. | 2 | Present work | 2 | 2 |
| Space group, Z |
P![[1 with combining macron]](https://www.rsc.org/images/entities/char_0031_0304.gif) , 1 , 1 |
P21/c, 2 | P21/c, 2 | P21/c, 2 |
| a, Å | 3.802(2) | 7.1 | 5.692(1) | 13.697(9) |
| b, Å | 6.612(3) | 28.4 | 3.975(1) | 3.881(3) |
| c, Å | 14.485(6) | 3.9 | 30.02(4) | 13.4020(10) |
| α, ° | 100.68(8) | 90 | 90 | 90 |
| β, ° | 94.40(6) | 110 | 96.76(6) | 100.44(1) |
| γ, ° | 102.11(5) | 90 | 90 | 90 |
| V, Å3 | 346.7(1) | 734 | 674.5(9) | 700.6(7) |
The quinacridone molecule itself possesses C2h symmetry. In crystal structures, molecules with C2h symmetry are located on crystallographic inversion centres with a frequency of 95%.20 Correspondingly, the space group was likely to be P21/c.21 For ordered crystals without diffuse scattering, the three settings of the space group – P21/c, P21/a and P21/n – could easily be distinguished through the systematic extinctions of the h0l reflections (l = 2n, or h = 2n, or h + l = 2n). However, in αII-quinacridone the diffuse streaks running through all h0l reflections made it impossible to detect any systematic extinction. Hence, the structure solution was performed in parallel in all three space groups.
Diffuse lines were cut at the calculated reflections positions, and the intensities of the reflections were extracted. This very rough treatment of the diffuse scattering gave, however, good results. The structure was solved by direct methods as implemented in SIR.22 The resulting electron density maps in P21/c are shown in Fig. 4a and b. The position and orientation of the molecules can be clearly seen (Fig. 4a). Although the individual atomic positions within the molecules were not well resolved (Fig. 4b), the maps allowed building of a structure model which was chemically sensible and described the overall electron density (Fig. 4c and d).
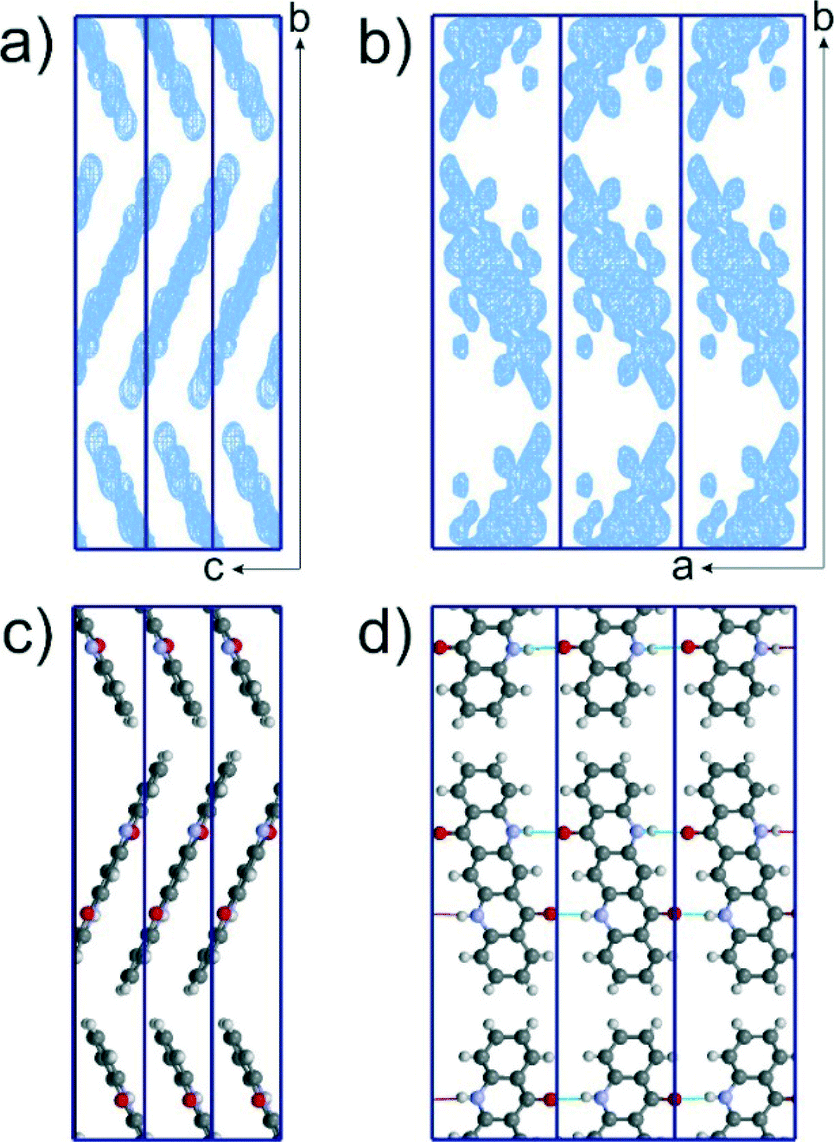 | ||
| Fig. 4 Structure of αII-quinacridone solved from electron diffraction data by direct methods. Scattering potential maps obtained as a structure solution by SIR viewed along the a (a) and c (b) directions; corresponding structural model viewed along the a (c) and c (d) directions. | ||
The validation of structures solved from electron diffraction data remains a debatable issue. Structure refinement against electron diffraction data (SHELX) can hardly serve as a proof of the correctness of a structure. The refinement routines are not adopted to electron diffraction with its intrinsic multiple scattering. In the case of αII-quinacridone, diffuse scattering passing through the reflections brought additional uncertainty in the intensities. As a result, the values of the refinement residuals were exceptionally high.
Recently, an alternative approach to structure validation was proposed – structure minimization using the dispersion-corrected density functional theory (DFT-D).23 A test on 241 single-crystal structures showed that upon a full optimization with DFT-D, including the optimization of the lattice parameters, all structures, which changed by less than 0.25 Å (Cartesian root mean square deviation of all atoms except hydrogen) should be regarded as reliable.24 For the P21/c structure of αII-quinacridone, the deviation was only 0.11 Å. Hence the structure was confirmed.
From the electron diffraction data, the structure could also be solved in P21/a and P21/n. The resulting structures showed identical hydrogen-bonding patterns and differed from the P21/c structure only by a mutual shift of neighbouring molecules in the b-direction by (1/2,0,1/2) and (1/2,0,0), respectively. However, the DFT calculations revealed that the energy of the P21/c structure is 5.0 kJ mol−1 lower than that of the P21/n structure and 6.8 kJ mol−1 lower than that of the P21/a structure. Hence, it is safe to assume that the P21/c structure represents the correct packing of the molecules.
In the αII-phase of quinacridone, the molecules are linked through a pair of hydrogen bonds into almost planar chains (Fig. 5). The chains are packed into a layer. A similar arrangement of molecules is also observed in the αI and β-phases. However, these three polymorphs differ in the mutual arrangements of their layers: in the αI-phase, all molecules are parallel, in the αII-phase, the molecules form a herringbone pattern, and in the β-phase, neighbouring layers are mutually rotated by 69.4°, see Fig. 5. A herringbone packing of planar chains, as is now found for the αII-phase, has not been observed in any quinacridone derivative before, but is known to exist in other pigment classes, e.g. in diketopyrrolopyrrole (Pigment Red 254)25 and thiazine-indigo (Pigment Orange 80).26
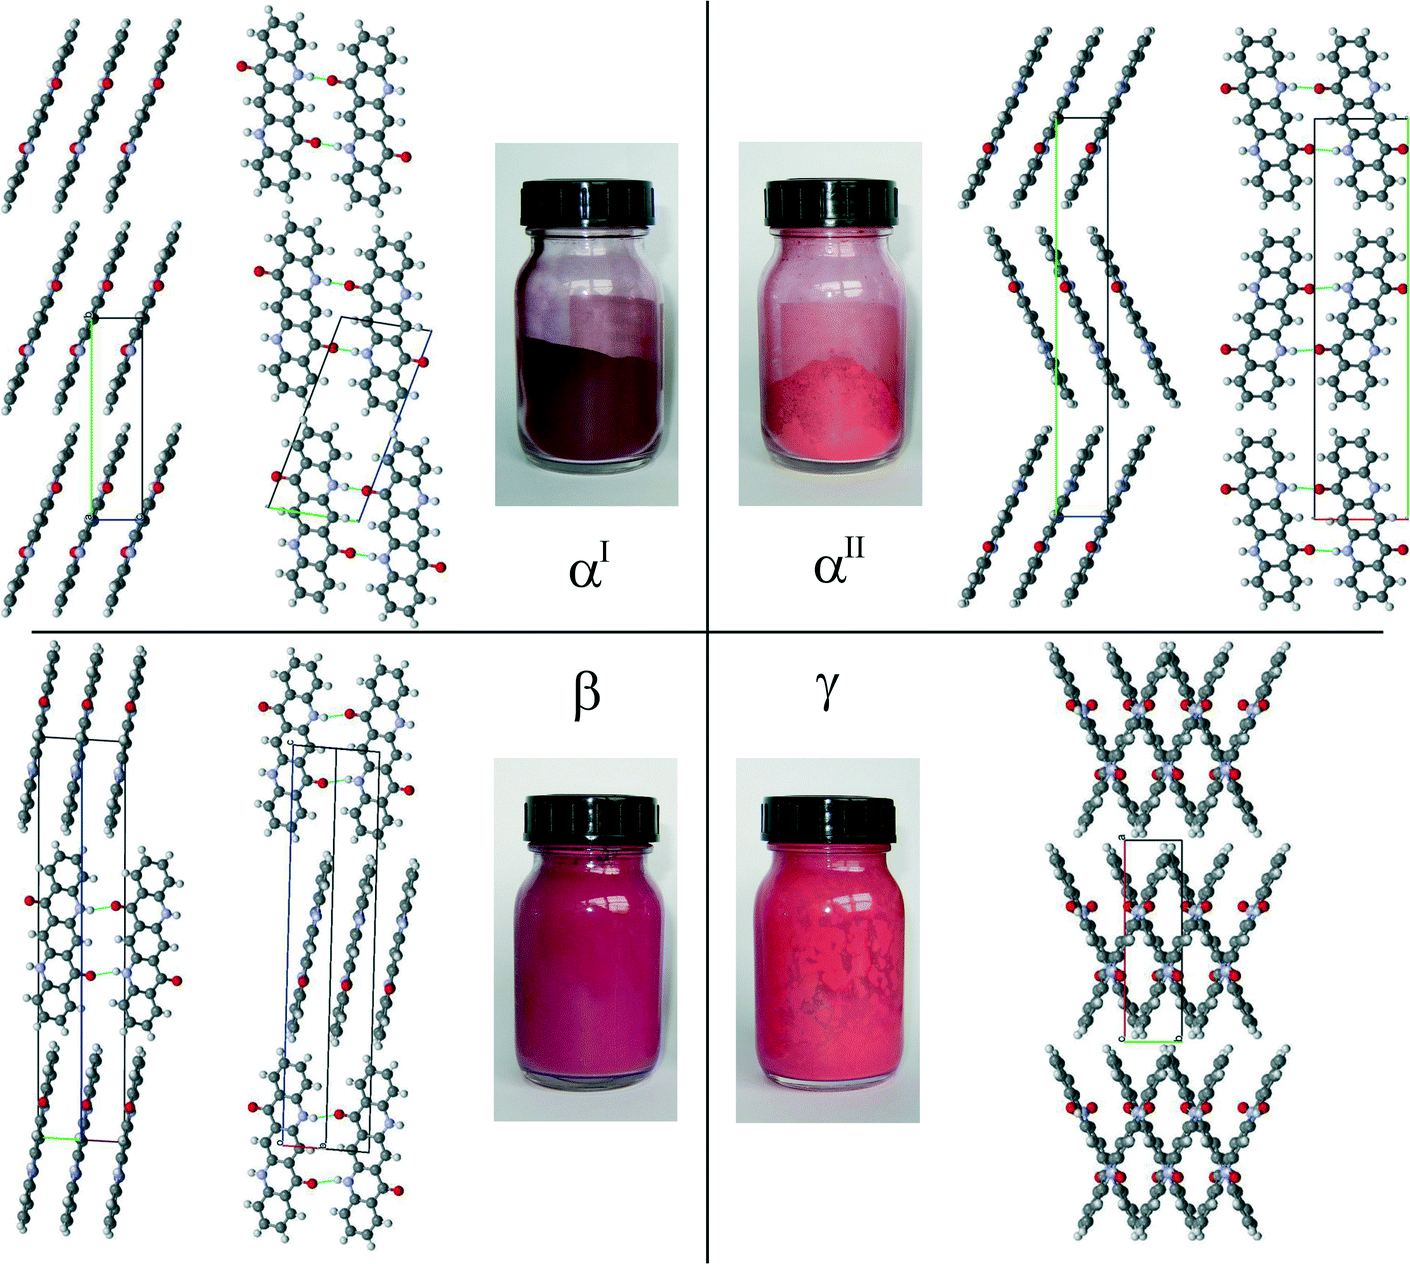 | ||
| Fig. 5 Colours and crystal structures of quinacridone polymorphs. | ||
A closer inspection of the crystal structures of the αI and αII-phases of quinacridone reveals that not only the chains, but also the mutual arrangement of the chains within the layers, are almost identical in both phases. The main difference between the polymorphs is the stacking of the layers: either parallel (αI) or herringbone (αII). Both motifs can be randomly combined, resulting in a disordered structure with a random mixed sequence, see Fig. 6. The simulated electron diffraction pattern of this structural model (Fig. 6a) reproduces the experimental diffraction intensity distribution quite well (Fig. 6b), explaining the observed diffuse scattering. It is therefore likely that the real structure of the αII-phase consists of a herringbone arrangement with a considerable number of stacking faults exhibiting a parallel arrangement of neighbouring layers.
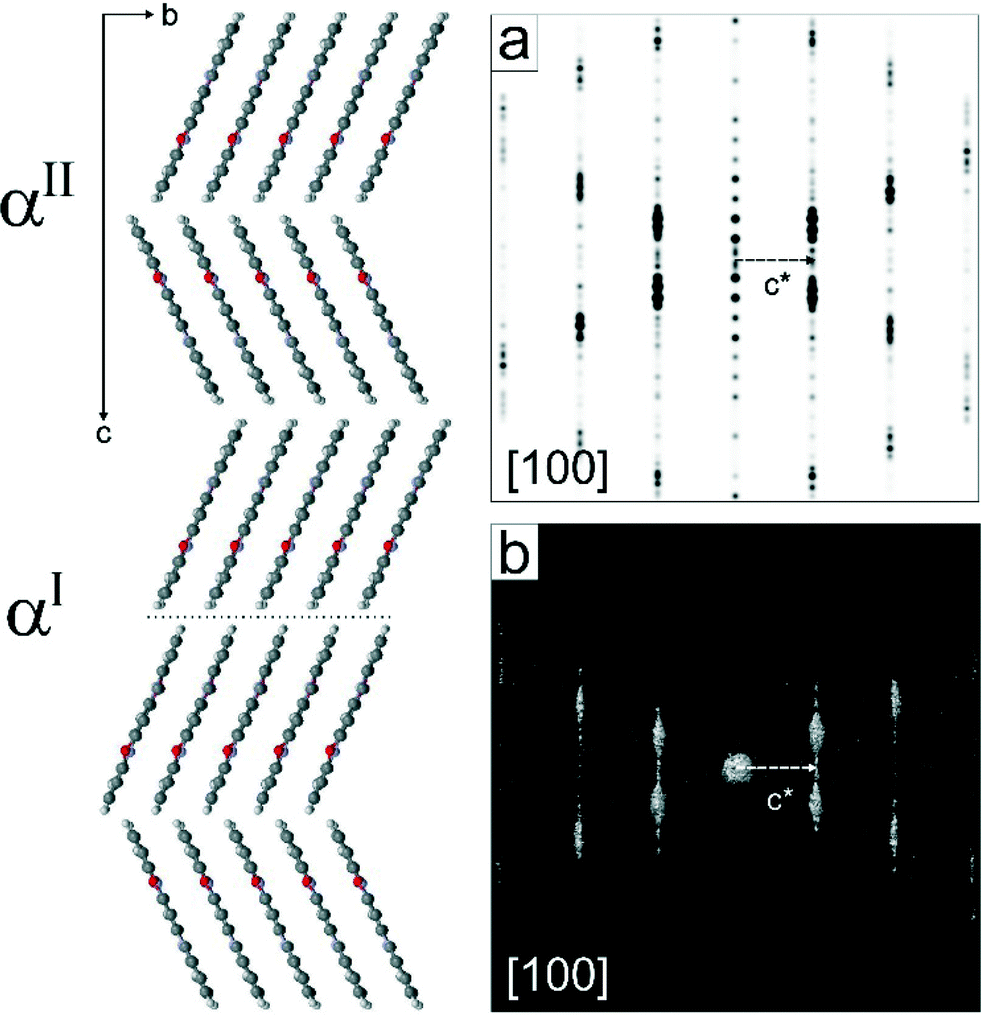 | ||
| Fig. 6 Structural model of αII-quinacridone including disorder: random layer stacking; at the dotted line there is a parallel stacking (as in the αI-phase) instead of the herringbone pattern (as in the idealized αII-structure); a) simulated electron diffraction pattern from the model; b) experimental electron diffraction pattern of αII-quinacridone. | ||
This stacking disorder is also supported by the lattice-energy minimizations with DFT-D calculations: the lattice-energy of a mixed-stacked structure consisting of 2/3 herringbone and 1/3 parallel arrangements is only 0.1 kJ mol−1 higher than the energy of pure herringbone (ideal αII) and 1.0 kJ mol−1 lower than the energy of the pure parallel packing (αI). The β- and γ-phases are energetically much more favourable (β: −4.3 kJ mol−1, γ: −5.5 kJ mol−1), which reflects the experimental stability order γ > β ≫ αI, αII.
The complexity of the real structure of αII-quinacridone explains the problems with the structure analysis from powder X-ray diffraction data. The low crystallinity reduces the quality of the data in general, and the diffuse scattering leads to intensity at positions not matching the Bragg positions.
Different samples of αII-quinacridone showed slightly different X-ray powder diffraction patterns depending on the synthetic conditions, indicating different fractions of parallel and herringbone stacking. This indicates that, the ordered structures of the αI and αII phases are the end members of a continuous series of disordered structures consisting of different amounts of each packing type.
Finally, we would like to emphasise the role of electron diffraction in the structure analysis of nanocrystalline materials. In the structural investigation of αII-quinacridone, all traditional methods – X-ray single crystal and powder diffraction – failed and only the employment of electron diffraction ultimately allowed us to determine the crystal structure.
Conclusions
Electron diffraction data of αII-quinacridone showed severe diffuse scattering. The average crystal structure solved by direct methods showed a herringbone molecular packing not observed previously for any of the quinacridone derivatives. The crystal structure was confirmed by DFT-D energy minimization. The diffuse scattering observed in the data could be explained by a model with stacking disorder containing a mixed sequence of herringbone and parallel arrangements of neighbouring layers. The correctness of the model was proved by DFT-D energy minimizations.Acknowledgements
We would like to thank our colleagues from Clariant, especially Dr. Dieter Schnaitmann, Dr. Wolfgang Schwab and Thorsten Schmiermund, for 20 years of collaboration on quinacridone. X-ray powder patterns and IR spectra were recorded by Edith Alig (Goethe University, Frankfurt). Synchrotron data of αII-quinacridone, used for PDF analyses, were measured by Dr. Nadine Schrodt (née Rademacher) and Dr. Ann-Christin Dippel at beamline P02.1 (beamline scientist in charge: Dr. Hanns-Peter Liermann) of the light source PETRA III at DESY. For the pair-distribution function analyses, we thank Dr. Lothar Fink (Goethe-University). We thank Dr. Ute Kolb (University of Mainz) for providing access to the TEM facility in Mainz. The research was funded by the German Research Foundation (DFG) priority program 1415.Notes and references
- W. Herbst and K. Hunger, Industrial Organic Pigments, Wiley-VCH, Weinheim, 3rd edn, 2004 Search PubMed.
- E. F. Paulus, F. J. J. Leusen and M. U. Schmidt, CrystEngComm, 2007, 9, 131–143 RSC.
- (a) E. E. Jaffe, European Pat., 305328, 1989 Search PubMed; (b) K. Hiromitsu, S. Masashi and N. Yoichi, Jap. Pat., 52-010324, 1977 Search PubMed; (c) F. Bäbler and E. E. Jaffe, Eur. Pat., 530143, 1993 Search PubMed; (d) E. E. Jaffe, Eur. Pat., 267877, 1988 Search PubMed; (e) W. Deuschel, F. Gundel, H. Wuest and E. Daubach, US Pat., 3074950, 1963 Search PubMed; (f) K. Hashizume, M. Miyatake, M. Shigemitsu, I. Kumano, H. Katsura and M. Oshima, Deutsches Pat., 1805266, 1970 Search PubMed; (g) F. Bäbler, Eur. Pat., 1074587, 2001 Search PubMed; (h) G. Lincke, J. Mater. Sci., 1997, 32, 6447–6451 CrossRef CAS; (i) H. R. Schweizer, US Pat., 3272821, 1962 Search PubMed; (j) R. S. Tyson and L. Schapiro, Deutsches Pat., 2435219, 1975 Search PubMed.
- The bleaching of red coatings, which is frequently observed on aged cars, is not caused by a bleaching of the pigment, but by a decomposition of the coating (so-called chalking), resulting in a white, opaque layer which hides the red colour of the pigments.
- Quinacridone is internationally registered in the Colour Index as C.I. Pigment Violet 19. Trade names are e.g. ®Hostaperm Red Violet ER02 for the β-phase and ®Hostaperm Red E5B02 for the γ-phase (manufacturer: Clariant).
- The yellow colour of individual quinacridone molecules is visible in a very dilute solution of quinacridone in boiling dimethylsulfoxide at 189 °C, showing a pale yellow shade. Also high-level quantum-mechanical calculations confirm the yellow colour of an individual molecule. Below about 150 °C quinacridone is insoluble in water and in all solvents.
- (a) E. F. Paulus, E. Dietz, A. Kroh and F. Prokschy, 12th European Crystallographic Meeting, Moscow, 20–29 August, 1989, Collected Abstracts, vol. 2, pp. 23–24 (β- and γ-phases) Search PubMed; (b) N. Nishimura, T. Senju and J. Mizuguchi, Acta Crystallogr., Sect. E: Struct. Rep. Online, 2006, 62, o4683–o4685 CAS (β-phase); (c) G. D. Potts, W. Jones, J. F. Bullock, S. J. Andrews and S. J. Maginn, J. Chem. Soc., Chem. Commun., 1994, 2565–2566 RSC (γ-phase); (d) J. Mizuguchi, T. Sasaki and K. Tojo, Z. Kristallogr. - New Cryst. Struct., 2002, 217, 249–250 CAS (γ phase).
- F. J. J. Leusen, Presentation at the 15th European Crystallographic Meeting ECM15, Dresden, 18 August–2 September, 1994, abstract in Z. Kristallogr., 1994, 8, 161 Search PubMed.
- For the αII-phase, the standard deviation of the lattice parameters are not included for the unit cell determined by electron diffraction, as specific sources of errors apply for electron diffraction experiments. The accuracy of distance measurements in electron diffraction is determined by a systematic error due to camera length calibration and a statistical error due to lens hysteresis while switching between imaging and diffraction mode; both are below 2%.
- G. Lincke and H.-U. Finzel, Cryst. Res. Technol., 1996, 31, 441–452 CrossRef CAS.
- M. U. Schmidt, presentation on the European Powder Diffraction Conference (EPDIC), Darmstadt, Germany, 2010 Search PubMed.
- (a) U. Kolb, T. E. Gorelik, C. Kübel, M. T. Otten and D. Hubert, Ultramicroscopy, 2007, 107, 507–513 CrossRef CAS PubMed; (b) U. Kolb, T. E. Gorelik and M. T. Otten, Ultramicroscopy, 2008, 108, 763–772 CrossRef CAS PubMed; (c) D. Zhang, P. Oleynikov, S. Hovmöller and X. Zou, Z. Kristallogr., 2010, 225, 94–102 CrossRef CAS.
- (a) I. Rozhdestvenskaya, E. Mugnaioli, M. Czank, W. Depmeier, U. Kolb, A. Reinholdt and T. Weirich, Mineral. Mag., 2010, 74, 159–177 CrossRef CAS; (b) C. S. Birkel, E. Mugnaioli, T. Gorelik, U. Kolb, M. Panthöfer and W. Tremel, J. Am. Chem. Soc., 2010, 132, 9881–9889 CrossRef CAS PubMed; (c) J. Jiang, J. L. Jorda, J. Yu, L. A. Baumes, E. Mugnaioli, M. J. Diaz-Cabanas, U. Kolb and A. Corma, Science, 2011, 333, 1131–1134 CrossRef CAS PubMed; (d) M. Gemmi, I. Campostrini, F. Demartin, T. E. Gorelik and C. M. Gramaccioli, Acta Crystallogr., Sect. B: Struct. Sci., 2012, 68, 15–23 CAS; (e) T. Willhammar, J. L. Sun, W. Wan, P. Oleynikov, D. L. Zhang, X. D. Zou, M. Moliner, J. Gonzalez, C. Martínez, F. Rey and A. Corma, Nat. Chem., 2012, 4, 188–194 CrossRef CAS PubMed; (f) J. Plášil, L. Palatinus, J. Rohlíček, L. Houdková, M. Klementová, V. Goliáš and P. Škácha, Am. Mineral., 2014, 99, 276–282 CrossRef.
- (a) A. V. Yakimanski, U. Kolb, G. N. Matveeva, I. G. Voigt-Martin and A. V. Tenkovtsev, Acta Crystallogr., Sect. A: Found. Crystallogr., 1997, 53, 603–614 CrossRef; (b) I. G. Voigt-Martin, Z. X. Zhang, U. Kolb and C. Gilmore, Ultramicroscopy, 1997, 68, 43–59 CrossRef CAS; (c) T. Gorelik, M. U. Schmidt, J. Brüning, S. Bekö and U. Kolb, Cryst. Growth Des., 2009, 9, 3898–3903 CrossRef CAS; (d) T. Gorelik, G. Matveeva, T. Schleuß, A. F. M. Kilbinger, J. van de Streek, A. Bohle, G. Brunklaus and U. Kolb, CrystEngComm, 2010, 12, 1824–1836 RSC.
- (a) U. Kolb, T. E. Gorelik, E. Mugnaioli and A. Stewart, Polym. Rev., 2010, 50, 385–409 CrossRef CAS; (b) T. E. Gorelik, J. van de Streek, A. F. M. Kilbinger, G. Brunklaus and U. Kolb, Acta Crystallogr., Sect. B: Struct. Sci., 2012, 68, 171–181 CAS; (c) C. H. Förster, T. E. Gorelik, U. Kolb, V. Ksenofontov and K. Heinze, Eur. J. Inorg. Chem., 2015, 920–924 CrossRef.
- S. J. Clark, M. D. Segall, C. J. Pickard, P. J. Hasnip, M. J. Probert, K. Refson and M. C. Payne, Z. Kristallogr., 2005, 220, 567–570 CAS.
- J. P. Perdew, K. Burke and M. Ernzerhof, Phys. Rev. Lett., 1996, 77, 3865 CrossRef CAS PubMed.
- S. J. Grimme, Comput. Chem., 2006, 27, 1787–1799 CrossRef CAS PubMed.
- (a) T. R. Welberry, Diffuse X-ray Scattering and Models of Disorder, Oxford University Press, Oxford, 2004 Search PubMed; (b) M. Gardon, C. B. Pinheiro and G. Chapuis, Acta Crystallogr., Sect. B: Struct. Sci., 2003, 59, 527–536 Search PubMed; (c) H.-B. Bürgi, M. Hostettler, H. Birkedal and D. Schwarzenbach, Z. Kristallogr., 2005, 220, 1066–1075 CrossRef; (d) T. R. Welberry and D. J. Goossens, Acta Crystallogr., Sect. A: Found. Crystallogr., 2008, 64, 23–32 CrossRef CAS PubMed; (e) H. Krüger, S. Stöber, T. Welberry, R. Withers and J. Fitz Gerald, Acta Crystallogr., Sect. B: Struct. Sci., 2011, 67, 476–485 Search PubMed; (f) J. L. Teteruk, J. Glinnemann, T. E. Gorelik, A. Linden and M. U. Schmidt, Acta Crystallogr., Sect. B: Struct. Sci., Cryst. Eng. Mater., 2014, 70, 296–305 CAS.
- E. Pidcock, W. D. S. Motherwell and J. C. Cole, Acta Crystallogr., Sect. B: Struct. Sci., 2003, 59, 634–640 Search PubMed.
- The space group P21/m was not considered: the occupation of inversion centres by molecules in P21/m is very rare ( N. U. Chernikova, V. K. Belskiy and P. M. Zorkiy, Zh. Strukt. Khim., 1990, 31, 148–153 CAS , in Rus.), and the positioning on the mirror planes was sterically impossible with the obtained lattice parameters.
- M. C. Burla, R. Caliandro, M. Camalli, B. Carrozzini, G. L. Cascarano, C. Giacovazzo, M. Mallamo, A. Mazzone, G. Polidori and R. Spagna, J. Appl. Crystallogr., 2012, 45, 357–361 CrossRef CAS.
- M. A. Neumann, F. J. J. Leusen and J. Kendrick, Angew. Chem., 2008, 120, 2461–2464 ( Angew. Chem., Int. Ed. , 2008 , 47 , 2427–2430 ) CrossRef.
- J. van de Streek and M. A. Neumann, Acta Crystallogr., Sect. B: Struct. Sci., 2010, 66, 544–558 CAS.
- J. Mizuguchi, A. Grubenmann and G. Rihs, Acta Crystallogr., Sect. B: Struct. Sci., 1993, 49, 1056–1060 Search PubMed.
- C. Buchsbaum, E. F. Paulus and M. U. Schmidt, Z. Kristallogr., 2011, 226, 822–831 CrossRef CAS.
Footnotes |
| † CCDC 1425922. For crystallographic data in CIF or other electronic format see DOI: 10.1039/c5ce01855b |
| ‡ In memoriam of Prof. Dr. Erich F. Paulus (formerly Hoechst AG) who has worked on crystal structures of quinacridones for more than 40 years. |
| This journal is © The Royal Society of Chemistry 2016 |