 Open Access Article
Creative Commons Attribution 3.0 Unported Licence
In situ phase behaviour of a high capacity LiCoPO4 electrode during constant or pulsed charge of a lithium cell†
Michael G.
Palmer
a,
James T.
Frith
a,
Andrew L.
Hector
a,
Andrew W.
Lodge
a,
John R.
Owen
*a,
Chris
Nicklin
b and
Jonathan
Rawle
b
aChemistry, University of Southampton, Southampton SO17 1BJ, UK. E-mail: jro@soton.ac.uk
bDiamond Light Source, Harwell Science and Innovation Campus, Didcot OX11 0DE, UK
First published on 8th November 2016
Abstract
The phase changes that occur during lithium extraction from LiCoPO4 in lithium half-cells were studied using synchrotron X-ray diffraction. The existence of two two-phase regions with an intermediate phase present was observed. Significant variations in the composition of the phases of nominal stoichiometry LiCoPO4, Li2/3CoPO4 and CoPO4 resulted in unit cell volume variations. On current pulsing, lattice parameter shifts and phase recovery were directly observed.
Olivine-structured lithium metal phosphates are positive electrode materials for lithium-ion batteries, and LiFePO4 has commercial applications from power tools to electric vehicles.1 It is a “two phase” electrode material where the stoichiometries FePO4 and LiFePO4 do not deviate very far from stoichiometry. A characteristic effect of this two-phase behaviour is a flat charge/discharge voltage profile. Phase segregation implies the presence of interfaces between lithiated and delithiated regions. These have been described using a “shrinking core” model in which (de)lithiation occurs first at particle surfaces and progresses inwards,2 and electron energy loss spectroscopy has been used to confirm surface delithiation in large single crystals.3 Facile lithium transport along [010] results in a nucleation-limited “domino-cascade” behaviour in nanocrystallites, with only crystallites of the end member phases present in recovered samples.4 Recent studies have shown the two phase model to start to break down at high (dis)charge rates, with intermediate compositions observed by in situ diffraction as the proportion of crystallites undergoing change at any specific moment increased relative to slower (dis)charge rates.5
High voltage positive electrode materials have potential application in high energy density batteries.6 LiCoPO4 undergoes lithium extraction and insertion at higher potentials than LiFePO4 (>4.8 V),7 but is less used due to its poor conductivity and cycling behaviour.8 The charge and discharge profiles contain two distinct two-phase regions. Bramnik et al. described the intermediate as Li0.7CoPO4 and Li0.6CoPO4 in diffraction studies.9,10 Later Strobridge et al. and Kaus et al. used NMR to show that an ordered arrangement of Co2+ and Co3+ sites stabilises an intermediate composition of Li2/3CoPO4.11,12
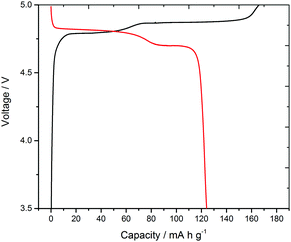
Often battery testing concentrates exclusively on electrochemical data, but in galvanostatic voltage–charge profiles both parameters are sensitive to the experimental conditions, e.g. current, cycling rate, temperature, cycle age or temporal age. In situ diffraction, spectroscopy and imaging can provide direct evidence of phases present at specific stages of charge/discharge13 and hence deconvolute effects such as parasitic currents due to interface formation and electrolyte decomposition,14 or increased potentials due to resistance and polarization. This can be particularly effective during dynamic processes. Herein with LiCoPO4 we have observed structural changes that occur during a pulsed charging and relaxation process. The LiCoPO4 used in this study delivered a first discharge capacity of 125 mA h g−1 (Fig. 1) at 0.1 C (i.e. with a current calculated to pass the theoretical maximum charge in 1/0.1 = 10 h) in a standard Swagelok cell. This is comparable with other LiCoPO4 materials studied at this current rate.8,15
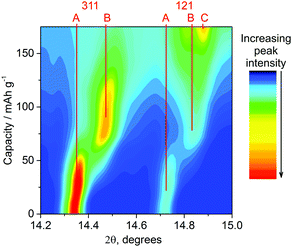
The in situ approach used here utilises a cell with a curved electrode pressed into a thin aluminium window that also acts as the positive current collector.16 Electrodes were produced at a concentration (75% LiCoPO4) and thickness (60 μm) where we could be confident of homogeneous composition and structure sampling through the thickness of the electrode at the current rates used. X-ray diffraction (XRD) patterns were collected regularly during galvanostatic charging at 0.2 C. The voltage profile during charge was similar to Fig. 1, with two plateaus, but slightly larger overpotentials were observed (the profile shifted to higher potential) and some swelling of the aluminium window occurred due to gas evolution. Nonetheless the XRD data (Fig. 2) follow the charge process well indicating that the X-ray beam was incident on a well contacted and electroactive region of the pellet. The growth of reflections due to the developing phase and loss of intensity from the original phase (LiCoPO4 → Li2/3CoPO4 → CoPO4) is clearly visible, and fitting the patterns was a rich source of information.
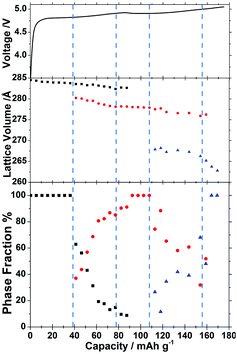
The sloping voltage–charge profile (Fig. 3) of LiCoPO4 in the in situ cell indicates that even at a moderate charging rate of 0.2 C reactions are proceeding under non-equilibrium conditions. There is little evidence of phase B (≈Li2/3CoPO4) in the XRD data before charging to 40 mA h g−1, but the XRD peaks of phase A (≈LiCoPO4) are observed to shift (Fig. 2) and structure refinements show a shrinking volume (Fig. 3). Hence, both the electrochemical data and the XRD data indicate a gradual decrease in lithium concentration within a single phase.
Once features associated with phase B became apparent in the XRD patterns, two phase Rietveld refinements were adopted so that unit cell volumes and phase fractions of both phases could be followed. There is no published structure of phase B, so this was fitted as LiCoPO4 with a 2/3 Li occupancy as indicated by the NMR studies.11,12 The strong dependence of the potential on charge passed in the region where phases A and B coexist is surprising. We postulate that the rising potential is due to the increasing concentration polarisation in phase B that is required to drive lithium diffusion from the 2-phase interface toward the electrolyte side. The linear slope in the potential is consistent with Fick's first law, which states that the concentration gradient should be proportional to the (constant) flux, and the assumption that most of the charge passed in this region contributes to thickening of a growing shell of phase B (Fig. 4). The larger magnitude of the slope between ∼40 and ∼80 mA h g−1 also suggests a rather low diffusion coefficient in this phase.
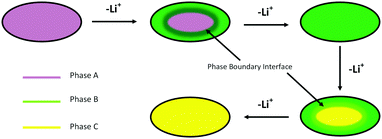 | ||
| Fig. 4 Schematic showing the shrinking core model2 applied to lithium extraction from the LiCoPO4 particles. | ||
The next event of interest in the structural data is the depletion of phase A, marked by disappearance of its XRD reflections and, at a similar point during charging, the nucleation of phase C (≈CoPO4). The decrease in potential with state of charge at ∼100 mA h g−1 may mark the start of phase C nucleation as the undersaturation of phase B is relieved. This is supported by the subsequent detection of phase C by XRD.
Phase C continues to grow in the structural data, where the small Vegard shifts (proportionate changes in lattice constants with composition) in both phases are consistent with most of the charge passed resulting in phase conversion rather than concentration polarisation. Nevertheless, thickening of phase C is shown in the electrochemical data to result in an increasing concentration polarisation, with a steep increase in potential suggesting a low diffusion coefficient for lithium in phase C. Upon depletion of phase B near the end of charge, a steeper Vegard shift in the phase C unit cell volume indicates a further decrease in lithium concentration until the end of discharge.
The LiCoPO4 particles used in this study were relatively large (∼1–3 μm, Fig. S1, ESI†), and hence in the size range where shrinking core behaviour is expected.3 Our results are consistent with this mechanism operating during the charging of this LiCoPO4, in which the more lithium deficient phase nucleates at the surface of the particles and the resulting shell thickens with time (Fig. 4). The shell phase and the core phase are both observed to exhibit concentration gradients, and lithium depletion of the core phase must occur via lithium diffusion through the shell phase. The surface lithium concentration of the particle, and hence the potential, depends on the thickness of the shell as well as the absolute compositions of both phases. It should be noted, however, that the XRD peak widths showed the crystallite sizes to be ∼300 nm (Fig. S1, ESI†) and hence the phase boundary is moving through a larger polycrystalline particle. In this case the compositional switching of individual crystallites, as in the domino-cascade model, is not inconsistent with the operation of a shrinking core mechanism at the particle level.
The galvanostatic intermittent titration technique (GITT) is useful to acquire both thermodynamic and kinetic parameters of a system. In a typical measurement, a series of current pulses are applied to a cell, with each pulse followed by a relaxation period where the open circuit potential is measured. During the relaxation period, the LiCoPO4 material within the composite electrode will tend towards homogeneity through lithium diffusion. Herein in situ XRD patterns were taken during pulsed charging and throughout the relaxation period (Fig. S2, ESI†).
To maintain a similar overall current rate compared with the in situ galvanostatic charge during an intermittent charging experiment it is necessary to apply higher currents during the charge periods. Hence, charging pulses were applied at a current rate of 0.5 C for 10 minute periods, with 30 minute relaxation periods between pulses. The XRD pattern was collected regularly during pulse and relaxation periods. The higher currents resulted in larger cell overpotentials due to the cell resistance and concentration polarisation, and hence the 5.1 V cut-off voltage for the cell was approached after only ∼90 mA h g−1 of charge was passed. The high potentials also increased the amount of gas evolution due to electrolyte decomposition and hence more swelling of the cell was observed. However, the current associated with secondary processes due to the carbon and electrolyte only became significant as 5 V was approached, with just 2 mA g−1 passed at 4.75 V on a carbon electrode (Fig. S3, ESI†). Hence the charge profile (Fig. 5) was similar to that with a standard Swagelok cell (Fig. 1) and the second voltage plateau in the profile had just started at a similar charge value when the cell voltage cut-off was approached. Six current pulses and relaxations were collected over this potential/charge range.
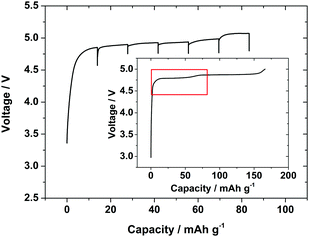 | ||
| Fig. 5 Voltage/charge profile of LiCoPO4 collected during GITT lithium extraction in the in situ cell with pulse charges for 10 min at 0.5 C and 30 min relaxations. Inset shows the charge profile collected in a standard Swagelok cell (from Fig. 1) with the red box showing the equivalent charge region. | ||
The response expected during a GITT pulse consists of a potential jump, due to the Ohmic drop in the electrolyte and counter electrode, followed by a more gradual change in potential with time, consistent with a concentration polarisation in the electrode near its interface with the electrolyte. The potential reflects the lithium concentration at the interface while the current is off and Ohmic potential drops are absent. For a single phase insertion electrode an almost parabolic profile is consistent with the change in concentration at the interface due to a constant flux of lithium at the interface. However, sometimes a plateau can develop, either due to diversion of current into a side reaction such as electrolyte decomposition, or the creation of a new phase with a different lithium content. The potential after relaxation at zero current increases after each pulse in a single phase material, but remains constant after successive pulses while two phases are in equilibrium. While the current is off, concentration gradients are lessened by diffusion, with the system moving toward an equilibrium distribution. This may involve lithium reinsertion in some regions of the electrode.
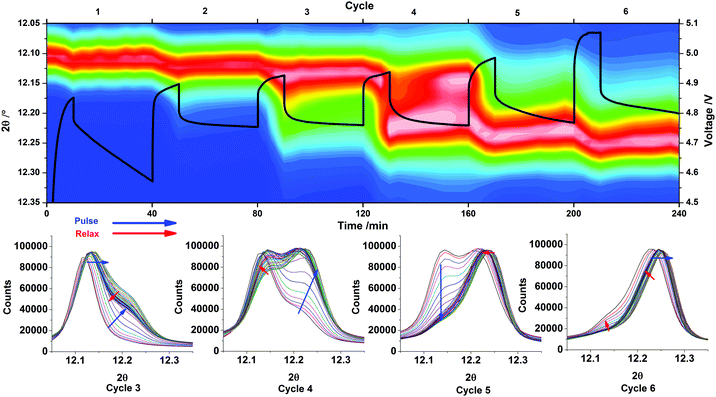
The shifts in position of the 020 reflection of LiCoPO4/Li2/3CoPO4 during the 6 GITT pulses are shown in Fig. 6, with the voltage–time profile overlaid. The same region of the diffraction patterns is also extracted for the 3rd–6th pulses, where the main features due to the phase change from phase A (≈LiCoPO4) and phase B (≈Li2/3CoPO4) were observed.
During the first charge pulse the parabolic shape of the voltage profile has a steep gradient and a significant Vegard shift is seen in the position of the 020 reflection of LiCoPO4 (Fig. 6). On relaxation, the 020 peak shifts back somewhat toward its original position as the sample equilibrates. The potential drops significantly during this period showing that a large concentration polarisation was present at the end of the charge pulse and that the composition at the surface of the particles is changing significantly during this relaxation period. On the second pulse, a similar Vegard shift is observed but the slope of the voltage profile is much less steep both on charge and on relaxation, showing a reduction in the polarisation as composition changes are distributed through the particles.
The intermediate phase B (≈Li2/3CoPO4) is first observed as a clear shoulder on the 020 reflection about half way into the 3rd charge pulse. This event is also indicated in the GITT data, where the initial profile is parabolic, confirming diffusion under semi-infinite boundary conditions, but followed by an almost constant voltage profile consistent with the presence of phase B in the delithiated surface. The presence of a constant overpotential is required to drive the phase boundary at a constant rate. Once phase B has nucleated there is the possibility of change in the phase distribution during equilibration and this is observed during the relaxation period. The shoulder reduces in intensity as the phase B content falls and the Vegard shift of the phase A (≈LiCoPO4) core is again lessened as lithium is redistributed through this region of the particles. During pulse 4 the voltage profile has a linear slope shape after the initial parabolic region, corresponding to semi-infinite diffusion through a thickening phase B shell with lengthening of lithium diffusion paths. The XRD data again shows some re-dissolution of the phase B shell into the phase A core during relaxation.
In pulse 5 the in situ XRD data shows almost complete depletion of phase A and this is reflected in a return of the more typical parabolic shape of the voltage profile combined with a steady state increase in the potential at the end of the pulse. Pulse 6 shows further depletion of the phase A core. In both cases the position of the phase B (“Li2/3CoPO4”) 020 reflection shows a strong Vegard shift due to delithiation followed by a partial recovery toward its original position during relaxation. Interestingly, a plateau can be seen at the end of pulse 6, but not reflected by the growth of phase C and therefore we suspect that the current may be diverted to electrolyte oxidation. An increased Ohmic drop is also observed.
The in situ XRD data during GITT show lattice parameter shifts in both phase A and B during dynamic charging of LiCoPO4 linked intimately to changes in the potential. Thus the structural data are a valuable confirmation of the phase change model to explain the detailed features that can be observed during the GITT experiment. The key features observed were: (1) parabolic charging regions related to the concentration profile in a single phase; (2) truncation of the parabolic shape due to stabilisation of the concentration overpotential by a second phase; (3) linear regions due to a thickening shell of a depleted lithium phase; (4) redistribution of lithium with lattice parameter recovery during relaxation between pulses.
In conclusion, the phase behaviour during the complete charge profile has been observed for LiCoPO4. From the galvanostatic data, all three phases are clearly present during charge, which has been related to a required concentration gradient in terms of lithium in order for phase growth. The GITT clearly shows lattice parameter shifts, as well as new phase growth during the pulse. Upon relaxation phase recovery was observed, which would be expected for a reversible lithium host structure.
The authors thank EPSRC and QinetiQ for an industrial CASE award (EP/K504555/1) to MGP, and Diamond Light Source for beam time on I07 under SI11142.
References
- O. K. Park, Y. Cho, S. Lee, H.-C. Yoo, H.-K. Song and J. Cho, Energy Environ. Sci., 2011, 4, 1621–1633 CAS.
- A. K. Padhi, K. S. Nanjundaswamy and J. B. Goodenough, J. Electrochem. Soc., 1997, 144, 1188–1194 CrossRef CAS.
- W. Sigle, R. Amin, K. Weichert, P. A. van Aken and J. Maier, Electrochem. Solid-State Lett., 2009, 12, A151–A154 CrossRef CAS.
- C. Delmas, M. Maccario, L. Croguennec, F. Le Cras and F. Weill, Nat. Mater., 2008, 7, 665–671 CrossRef CAS PubMed.
- H. Liu, F. C. Strobridge, O. J. Borkiewicz, K. M. Wiaderek, K. W. Chapman, P. J. Chupas and C. P. Grey, Science, 2014, 344, 1252817 CrossRef PubMed.
- S.-Y. Chung, J. T. Bloking and Y.-M. Chiang, Nat. Mater., 2002, 1, 123–128 CrossRef CAS PubMed.
- S. Okada, S. Sawa, M. Egashira, J. I. Yamaki, M. Tabuchi, H. Kageyama, T. Konishi and A. Yoshino, J. Power Sources, 2001, 97–98, 430–432 CrossRef CAS.
- J. Liu, T. E. Conry, X. Song, L. Yang, M. M. Doeff and T. J. Richardson, J. Mater. Chem., 2011, 21, 9984–9987 RSC.
- N. N. Bramnik, K. Nikolowski, C. Baehtz, K. G. Bramnik and H. Ehrenberg, Chem. Mater., 2007, 19, 908–915 CrossRef CAS.
- H. Ehrenberg, N. N. Bramnik, A. Senyshyn and H. Fuess, Solid State Sci., 2009, 11, 18–23 CrossRef CAS.
- F. C. Strobridge, R. J. Clément, M. Leskes, D. S. Middlemiss, O. J. Borkiewicz, K. M. Wiaderek, K. W. Chapman, P. J. Chupas and C. P. Grey, Chem. Mater., 2014, 26, 6193–6205 CrossRef CAS PubMed.
- M. Kaus, I. Issac, R. Heinzmann, S. Doyle, S. Mangold, H. Hahn, V. S. K. Chakravadhanula, C. Kübel, H. Ehrenberg and S. Indris, J. Phys. Chem. C, 2014, 118, 17279–17290 CAS.
- P. P. R. M. L. Harks, F. M. Mulder and P. H. L. Notten, J. Power Sources, 2015, 288, 92–105 CrossRef CAS.
- F. M. Michalak and J. R. Owen, Solid State Ionics, 1996, 86–88, 965–970 CrossRef CAS.
- M. K. Devaraju, D. Rangappa and I. Honma, Electrochim. Acta, 2012, 85, 548–553 CrossRef CAS.
- M. R. Roberts, A. Madsen, C. Nicklin, J. Rawle, M. G. Palmer, J. R. Owen and A. L. Hector, J. Phys. Chem. C, 2014, 118, 6548–6557 CAS.
Footnote |
| † Electronic supplementary information (ESI) available: Full synthesis, characterisation and measurement details; sample Rietveld fits to the XRD data; raw data for LiCoPO4. See DOI: 10.1039/c6cc07756k |
| This journal is © The Royal Society of Chemistry 2016 |

