 Open Access Article
Creative Commons Attribution 3.0 Unported Licence
SERS of meso-droplets supported on superhydrophobic wires allows exquisitely sensitive detection of dipicolinic acid, an anthrax biomarker, considerably below the infective dose†
Melody
Cheung
a,
Wendy W. Y.
Lee
a,
David P.
Cowcher
b,
Royston
Goodacre
b and
Steven E. J.
Bell
*a
aInnovative Molecular Materials Group, School of Chemistry and Chemical Engineering, Queen's University Belfast, BT9 5AG, UK. E-mail: s.bell@qub.ac.uk; Tel: +44 (0)2890 974470
bSchool of Chemistry, Manchester Institute of Biotechnology, University of Manchester, 131 Princess Street, Manchester, M1 7DN, UK
First published on 13th July 2016
Abstract
Surface-enhanced Raman measurements of <1 μL analyte/colloid meso-droplets on superhydrophobic wires with hydrophilic tips allowed dipicolinic acid, a spore biomarker for Bacillus anthracis (anthrax), to be detected at 10−6 mol dm−3. This is equivalent to 18 spores, significantly below the infective dose of 104 spores and 2 orders of magnitude better than previous measurements.
Bacillus anthracis, more commonly known as anthrax, is an extremely dangerous bioterrorism agent which has been widely publicised ever since packages containing anthrax spores were posted to a number of high profile targets in 2001.1 When B. anthracis is inhaled its spores germinate and release several toxic substances in the lungs which can cause internal bleeding, swelling and even tissue death, with strong symptoms occurring only several hours after exposure.2 Since only 104B. anthracis spores are required to create life threatening conditions3 it is vital that they can be detected rapidly and at low level concentration for disease diagnosis. Currently, various biochemical methods are used for the detection of B. anthracis such as Gram staining, identifying colony characteristics and motility tests,4,5 however, these methods are very time consuming (ca. 24 hours) as they require the bacterium to be cultured in the laboratory, at which point the extreme symptoms of B. anthracis inhalation would already have begun. A more efficient approach would be to analyse and detect the chemical marker compounds as a proxy for these bacterial spores since these culture systems are typically slow. Dipicolinic acid (2,6-pyridinedicarboxylic acid, DPA) is a useful biomarker compound for B. anthracis since up to 17% of the dry weight of spores is comprised of calcium dipicolinate and DPA has no other natural sources.6
Current research in developing a rapid analytical method to detect low levels of DPA includes the developement of surface-enhanced Raman scattering (SERS) and the results to date are extremely promising since analysis can be carried out within a matter of minutes with simple sample preparation and portable platforms for remote deployment.7–11 Several research groups have reported the use of SERS for the detection of DPA, with studies by Cowcher et al.9 being able to detect DPA at a concentration of 6 × 10⁻⁸ mol dm−3 using conventional citrate reduced silver colloid (CRSC) and simple pH adjustments with nitric acid; which has the added advantage that nitric acid is used to extract DPA from spores. This was equivalent to detecting the DPA contained in ca. 1100 B. anthracis spores,9 which is below the level (104 spores) required for disease. Another group11 was able to detect a similar level of ca. 1000 spores using SERS; however, the approach required extremely complex and time consuming preparation methods. Whilst polymerase chain reaction (PCR) and real time PCR,12–17 which mostly use fluorescence or various temperature tests to determine the presence of anthrax, are generally sensitive to the various different strains, the PCR-based methods are relatively complex, time consuming and costly in comparison to SERS.
The main objective of this work is to reduce the total mass of DPA which can be detected by combining the sensitivity observed in previous SERS studies with the ability to manipulate and probe small (0.2 μL) sample volumes which is created using superhydrophobic (SHP) materials for sample handling. This work is a natural progression from our previous work where small droplets of melamine or sugar were dried down to create solid deposits which were probed using Raman spectroscopy rather than SERS18 and other published studies in which small droplets of colloid were evaporated to dryness on SHP surfaces to leave solid deposits suitable for SERS.19–21 However, the current approach is different from these studies since here the samples are manipulated and then analysed as meso-droplets (ca. 1 mm diameter) without an evaporation step. Although these droplets are small compared to standard analytical sample volumes they are still large compared to the sampling volume of both bench top and microscope-based Raman spectrometers so they will provide signals which are similar to bulk samples recorded on the same instruments. Typically microfluidic systems are used to create meso-droplets but microfluidics usually require large volumes of analyte due to dead volume, pump priming, etc., so that although the sample presented to the instrument is small the amount of material required to produce it is very much larger. In our approach because the sample is handled, mixed and dispensed as single small droplets, which can constitute the entire sample, the volume of sample required is dramatically reduced.
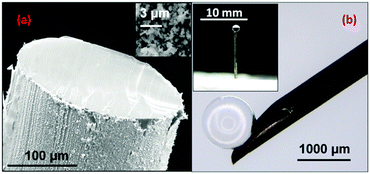
In this work the meso-droplets were held on SHP supports which were prepared using galvanic deposition,18,22,23 where briefly, copper wires of 230 μm diameter were immersed into AgNO3(aq) for 40 s and dried before placing into a solution of 3,3,4,4,5,5,6,6,7,7,8,8,9,9,10,10,10-heptadecafluoro-1-decanethiol (HDFT) in DCM for 5 min. Once dry, the SHP coated wires were then cut using a sharp scalpel to expose bare copper which would act as the hydrophilic tip and hold the aqueous sample. The SHP supports had a textured black coating on their sides and exposed copper wire tips, as shown in the Fig. 1(a).
The main issue with using these supports for quantitative or even semi-quantitative analysis is dispensing a small volume of the analyte onto the hydrophilic tip. In particular, although pipettes or syringes which measure these volumes are standard, the sub-μL droplets are held strongly to their hydrophilic dispensing tips and cannot be induced to transfer to the SHP support, even if the meniscus is pressed against the hydrophilic surface. This difficulty was overcome using a 1 μL gas chromatography (GC) syringe whose needle was given a SHP coating so that the dispensed volume readily detached from the needle when it was placed in contact with the tip of the SHP copper wire support. The GC syringe needle was coated by first electrodepositing a copper layer at 1.5 V in a simple cell containing CuSO4 acidified with H2SO4 and with a clean copper foil counter electrode. This Cu surface was then coated with electrolessly deposited Ag and polyfluorothiol, as described above. Fig. 1(b) shows a 0.5 μL droplet of water sitting as a perfect sphere on the SHP GC syringe tip, the inset shows the droplet after transfer to the SHP support. If required, the droplet volume could be decreased without losing the spherical geometry by reducing the diameter of the support. We have previously shown that reducing the diameter to 100 μm decreases the maximum droplet diameter by a factor of 2, which suggests an order of magnitude decrease in sample volume should be possible.18 However, here we used the larger droplets for experimental convenience because it allows physically robust supports and simple dispensing of the measured volumes.
For the SERS experiments, the SHP supports were prepared as an array held in a polystyrene block and Raman signals were recorded using a 633 nm Raman microscope. Using the SHP coated GC syringe it was possible to work with sub-μL sample volumes. In this case 0.2 μL droplets of DPA (in 0.02 mol dm−3 HNO3) were dispensed onto the SHP support tips followed by 0.2 μL CRSC. To encourage thorough mixing of the two solutions all of the aqueous sample was then drawn into the GC syringe before dispensing it back onto the SHP support. Nitric acid was added to DPA solutions since it has previously been shown to extract DPA from spores, so the samples in this experiment are equivalent to those obtained using a procedure where the spores are collected and then mixed with acid to extract the DPA. In addition, the nitric acid also acted as an aggregating agent for CRSC, which meant that a separate aggregating agent such as MgSO4 or NaCl was not required.
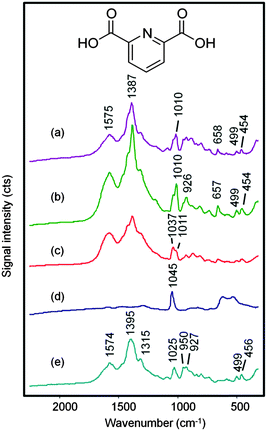
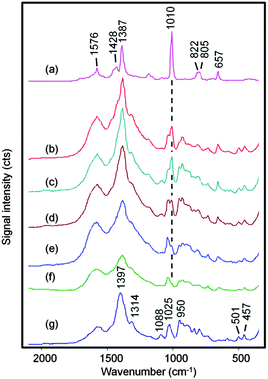
Previous work with the SHP supports18 showed that drying down aqueous melamine or sugar droplets allowed an increased localised concentration of the analyte onto the probe area which in turn gave maximum Raman signals. The same approach can usually be applied to SERS analysis, where maximum signals can be obtained when the solvent in the test sample evaporates to give a higher concentration of the target analyte adsorbed onto the enhancing metal nanoparticles.19–21 This approach was therefore an obvious choice when testing aqueous DPA/CRSC droplets using SHP supports and the results of initial experiments following this approach are shown in Fig. 2. The SERS spectrum of the initial mixture of DPA at 1 × 10⁻⁵ mol dm−3 with CRSC is shown in Fig. 2(a), it is dominated by the citrate bands of the colloid (which are shown in Fig. 2(e)) but it also shows a small additional peak at 1010 cm−1 which is due to the symmetric ring stretch of DPA. Other DPA peaks appear at 1387, 1428 and 1576 cm−1 (as shown in Fig. 3(a)) however these peaks are largely hidden in the CRSC background spectrum. However, as the droplet dried, the 1010 cm−1 band became smaller rather than growing as expected. Indeed, when the droplet had fully dried the spectrum was dominated by a strong peak at 1040 cm−1, which is the Raman signal due to residual nitrate from nitric acid. It was not surprising that nitric acid was observed but the SERS signal of the citrate and DPA was lost, since drying down the sample must necessarily give a transient high concentration of nitric acid, which presumably also created conditions where DPA or CRSC were not stable. This observation will be generally true for all procedures which involve drying acidic sample solutions and forced us to consider the alternative approach of simply recording the SERS spectra of the acidic colloid droplets before evaporation.
Fig. 3 shows spectra obtained from 0.2 μL droplets of DPA at concentrations ranging from 1 × 10⁻³ to 5 × 10⁻⁷ mol dm−3 dissolved in 0.02 mol dm−3 HNO3 and mixed with 0.2 μL CRSC. At the highest concentration, the spectra are dominated by bands due to the DPA but at the lower concentrations the weaker DPA bands begin to be masked by the citrate signals so only the 1010 cm−1 ring breathing vibration from DPA is clearly visible.
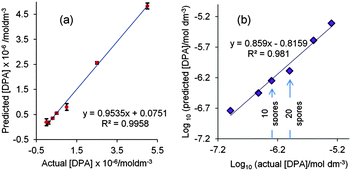
Partial least squares regression (PLS) is a better approach for the quantification of analytes by SERS rather than simple visual inspection of individual analyte peaks as it uses the whole SERS spectrum. Here a PLS calibration model was built using DPA spectra. In experiments following earlier studies which used glutaric acid as an internal standard9 it was found that under the current conditions the glutaric acid gave a strong interfering band at 999 cm−1 which lies close to the 1010 cm−1 DPA band (see Fig. S1, ESI†) so instead the spectra were used unscaled, without an internal standard. The sample-to-sample variation of the absolute intensity of the 999 cm−1 signal in the spectra shown in Fig. S1 (ESI†) was acceptably low at 7.2%. With just two factors the resulting calibration plot of average predicted value from 2 replicates against actual concentration had an R2 value of 0.996, as shown in Fig. 4(a). Fig. 4(b) shows a plot of the log10 of the averaged predicted concentrations against the actual concentrations of DPA. The limit of detection from visual inspection of the spectra (1 × 10⁻⁶ mol dm−3) lies in the middle of the 10−5–10−7 mol dm−3 concentration ranges and it is clear that the limit of detection in the PLS model is lower than this value. However, even if we use the very conservative LOD of 1 × 10⁻⁶ mol dm−3 we can calculate that a 0.2 μL droplet contains a total sample mass of ca. 3.34 × 10⁻⁵ μg DPA or just 18.3 spores. To the best of our knowledge, this is the smallest amount of DPA ever detected by SERS; the previous best value was 2 × 10⁻³ μg (6 × 10⁻⁸ mol dm−3 in a 200 μL sample) which was equivalent to ca. 1100 spores.9 This suggests that, in principle, this meso-SERS technique is sufficiently sensitive to detect well below the infective dose of 104B. anthracis spores for inhalation anthrax. However, this assumes that all the DPA is extracted from the spores, which is often not the case with acid extraction.9 However, the sensitivity we have achieved means that even if the extraction efficiency is only ca. 0.2% this will still allow us to detect the minimum infective dose.
In summary, the simple sample handling and manipulation which is enabled by SHP sample holders and dispensers allows meso-droplet based SERS measurements to be carried out under normal laboratory conditions without additional specialist equipment. The advantage of using meso-droplet sampling is that the sample volume can be reduced significantly while still remaining large enough to be Raman probed; which on a diffraction limited spectrometer is ca. 1/2λ. This in turn reduces the total sample required, in this case reducing the amount of DPA required for detection by 2 orders of magnitude.
M. C. acknowledges financial support from the Department of Education and Learning (DEL), N. I. D. C. thanks UK BBSRC for funding his PhD CASE Award with Avacta Group Plc (ref: BB/H015868/1) and RG is also grateful to BBSRC (BB/L014823/1) for funding for Raman spectroscopy.
References
- D. B. Jernigan, P. L. Raghunathan, B. P. Bell, R. Brechner, E. A. Bresnitz, J. C. Butler, M. Cetron, M. Cohen, T. Doyle, M. Fischer, C. Greene, K. S. Griffith, J. Guarner, J. L. Hadler, A. Hayslett, R. Meyer, L. R. Petersen, M. Phillips, R. Pinner, T. Popovic, C. P. Quinn, J. Reefhuis, D. Reissman, N. Rosenstein, A. Schuchat, W. J. Shieh, L. Siegal, D. L. Swerdlow, F. C. Tenover, M. Traeger, J. W. Ward, I. Weisfuse, S. Wiersma, K. Yeskey, S. Zaki, D. A. Ashford, B. A. Perkins, S. Ostroff, J. Hughes, D. Fleming, J. P. Koplan, J. L. Gerberding and National Anthrax Epidemiologic Investigation Team, Emerging Infect. Dis., 2002, 8, 1019–1028 CrossRef PubMed.
- http://www.cdc.gov/anthrax/basics/, accessed April 2016.
- http://www.cidrap.umn.edu/infectious-disease-topics/anthrax, accessed April 2016.
- http://www.asm.org/images/pdf/Clinical/Protocols/anthrax.pdf, accessed April 2016.
- http://https://www.gov.uk/guidance/specialist-and-reference-microbiology-laboratory-tests-and-services, accessed April 2016.
- W. G. Murrell, W. Gould and A. Hurst, Chemical composition of spores and spore structures, The Bacterial Spore, Academic Press, London, UK, 7th edn, 1969 Search PubMed.
- X. Zhang, M. A. Young, O. Lyandres and R. P. Van Duyne, J. Am. Chem. Soc., 2005, 127, 4484–4489 CrossRef CAS PubMed.
- S. E. J. Bell, J. N. Mackle and N. M. S. Sirimuthu, Analyst, 2005, 130, 545–549 RSC.
- D. P. Cowcher, Y. Xu and R. Goodacre, Anal. Chem., 2013, 85, 3297–3302 CrossRef CAS PubMed.
- H. W. Cheng, S. Y. Huan and R. Q. Yu, Analyst, 2012, 137, 3601–3608 RSC.
- S. Farquharson, C. Shende, W. Smith, H. Huang, F. Inscore, A. Sengupta, J. Sperry, T. Sickler, A. Prughe and J. Guicheteau, Analyst, 2014, 139, 6366–6370 RSC.
- http://www.cdc.gov/anthrax/lab-testing/labtestingfaq.html (assessed April 2016).
- C. Ryu, K. Lee, C. Yoo, W. K. Seong and H. B. Oh, Microbiol. Immunol., 2003, 47, 693–699 CrossRef CAS PubMed.
- S. Makino and H. Cheun, J. Microbiol. Methods, 2003, 53, 141–147 CrossRef CAS PubMed.
- S. A. Batra, S. Krupanidhi and U. Tuteja, Indian J. Med. Res., 2013, 138, 111–116 CAS.
- C. A. Bell, J. R. Uhl, T. L. Hadfield, J. C. David, R. F. Meyer, T. F. Smith and F. R. Cockerill, J. Clin. Microbiol., 2002, 40, 2897–2902 CrossRef CAS PubMed.
- A. Fasanella, S. Losito, R. Adone, F. Ciuchini, T. Trotta, S. A. Altamura, D. Chiocco and G. Ippolito, J. Clin. Microbiol., 2003, 41, 896–899 CrossRef CAS PubMed.
- M. Cheung, W. W. Y. Lee, J. N. McCracken and S. E. J. Bell, Anal. Chem., 2016, 88, 4541–4547 CrossRef CAS PubMed.
- W. Song, D. Psaltis and K. B. Crozier, Lab Chip, 2014, 14, 3907–3911 RSC.
- S. Yang, X. Dai, B. Boschitsch Stogin and T. Wong, Proc. Natl. Acad. Sci. U. S. A., 2016, 113, 268–273 CrossRef CAS PubMed.
- H. W. Lee, Y. H. Lee, Q. Zhang, I. Y. Phang, J. M. R. Tan, Y. Cui and X. Y. Ling, ACS Appl. Mater. Interfaces, 2013, 5, 11409–11418 CAS.
- I. A. Larmour, S. E. J. Bell and G. C. Saunders, Angew. Chem., Int. Ed., 2007, 46, 1710–1712 CrossRef CAS PubMed.
- S. Mabbott, I. A. Larmour, V. Vishnyakov, Y. Xu, D. Graham and R. Goodacre, Analyst, 2012, 137, 2791–2798 RSC.
Footnote |
| † Electronic supplementary information (ESI) available: Detailed experimental procedures and analytical data. See DOI: 10.1039/c6cc03521c |
| This journal is © The Royal Society of Chemistry 2016 |


![[thin space (1/6-em)]](https://www.rsc.org/images/entities/char_2009.gif) 600×. Image (b) shows a SHP coated GC syringe needle with a 0.5 μL droplet sitting as a “ball” at the tip. The inset shows a SHP support holding a 0.5 μL water droplet.
600×. Image (b) shows a SHP coated GC syringe needle with a 0.5 μL droplet sitting as a “ball” at the tip. The inset shows a SHP support holding a 0.5 μL water droplet.

