 Open Access Article
Creative Commons Attribution 3.0 Unported Licence
A reversible B–A transition of DNA duplexes induced by synthetic cationic copolymers†
Nonoka
Yamaguchi
a,
Yu-ki
Zouzumi
a,
Naohiko
Shimada
b,
Shu-ichi
Nakano
a,
Naoki
Sugimoto
ac,
Atsushi
Maruyama
*b and
Daisuke
Miyoshi
*a
aFaculty of Frontiers of Innovative Research in Science and Technology (FIRST), Konan University, 7-1-20 Minatojima-minamimachi, Chuo-ku, Kobe 650-0047, Japan
bDepartment of Biomolecular Engineering, Graduate School of Bioscience and Biotechnology, Tokyo Institute of Technology, 4259 Nagatsuta, Midori-ku, Yokohama 226-8501, Japan
cFrontier Institute for Biomolecular Engineering Research (FIBER), Konan University, 7-1-20 Minatojima-minamimachi, Chuo-ku, Kobe 650-0047, Japan
First published on 16th May 2016
Abstract
Although the B-form duplex is the canonical DNA structure, the A-form duplex plays critical roles in controlling gene expression. Here, reversible B–A transitions of DNA duplexes were induced by synthetic cationic and anionic polymers. Thermodynamic analysis demonstrated that the B–A transition was regulated by the dehydration of the DNA duplex caused by polymer binding.
The canonical structure of DNA is the B-form duplex.1 However, DNA shows structural polymorphism and folds to form various non-canonical structures, depending on the nucleotide sequence and molecular environmental factors, such as the coexisting cationic species and its concentration,2 pH,3 molecular crowding, and the binding of other biomolecules.4 The non-canonical structures are important as regulatory elements for protein binding and function.5,6 In addition, these structures can serve as binding sites for small molecules and coordination sites for metal ions.7 Thus, structural transitions between the B-form duplex and other duplex structures may be biologically important in regulating gene expression. In particular, the A-form DNA duplex has been observed for certain nucleotide sequences under experimental conditions of reduced water activity, high concentrations of organic solvents such as alcohols, and high concentrations of salts.8,9 Structural studies have indicated that the A-form DNA duplex is induced upon binding to proteins such as the TATA-box binding protein,10 cyclic AMP receptor protein,11 and a series of polymerases.12 Moreover, a recent study utilizing Fourier transform infrared (FTIR) spectroscopy reported that the B–A transition can occur in the nuclei of intact cells in response to dehydration and that this transition is reversible upon rehydration.13 The evidence to date thus indicates that the hydration of DNA strands plays critical roles in this reversible structural transition of DNA duplexes in living cells, yet the exact mechanism underlying the B–A–B transition remains unclear, in part because it is difficult to controllably alter the solvent concentrations of alcohols and salts controlling the reversible A–B transition. In this study, we attempted to induce the B–A transition by using the synthetic cationic polymers PLL-g-Dex (poly(L-lysine)-graft-dextran; Fig. 1a)14 and PAA-g-Dex (poly(allylamine)-graft-dextran; Fig. 1b),15 and systematically studied the thermodynamics of the mechanism controlling the B–A–B transition of the DNA strands comprising various ratios of GC base pairs (Fig. 1c). Moreover, the reversible A–B transition was induced using an anionic polymer, allowing the reduction of cationic polymer binding to the DNA strands.
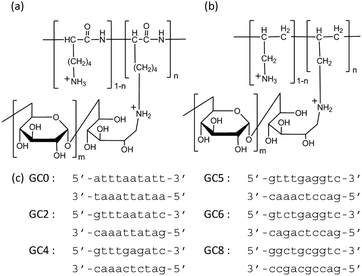 | ||
| Fig. 1 Structure of PLL-g-Dex (a) and PAA-g-Dex (b) and sequences of the DNA duplex used in this study (c). | ||
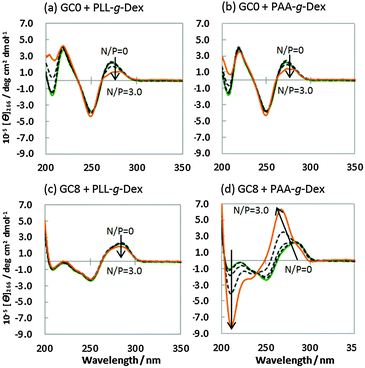
The structure of the DNA strands in the presence of PLL-g-Dex or PAA-g-Dex was studied by CD spectroscopy. Fig. 2a shows the CD spectra of 20 μM GC0 in a buffer comprising 100 mM NaCl, 10 mM Na2HPO4 (pH 7.0), and 1 mM Na2EDTA in the presence of various concentrations of PLL-g-Dex [N/P (amino group/phosphate group) = 0–3.0]. The CD spectra of GC0 showed positive peaks (220 nm and 275 nm) and a negative peak (245 nm) typical of the B-form duplex both in the absence and presence of PLL-g-Dex.16 These results show that GC0 maintains the B-form duplex under these conditions. The CD spectra of GC0 in the presence of PAA-g-Dex (Fig. 2b) showed similar peaks, again indicating the formation of the B-form duplex. Similarly, the CD spectra of GC8 with PLL-g-Dex (N/P = 0–3.0) showed the B-form duplex (Fig. 2c). In contrast, the CD spectra of GC8 (Fig. 2d) in the presence of PAA-g-Dex showed a significant negative peak at 210 nm and a blue-shifted positive peak at 275 nm. Since a CD spectrum with positive and negative peaks at 270 nm and 210 nm, respectively, is the signature of A-form duplex,16 these CD spectra indicate that GC8 undergoes a B–A transition when the concentration of PAA-g-Dex increases from N/P = 0 to N/P = 3.0.
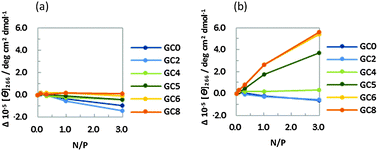
The CD intensities at 266 nm of the DNA strands were plotted against the N/P ratio of PLL-g-Dex and PAA-g-Dex (Fig. 3). The CD intensity was independent of the concentration of PLL-g-Dex (Fig. 3a), showing that the B-form DNA duplexes are not altered by PLL-g-Dex. Contrary to that observed for PLL-g-Dex, an incremental change in CD intensity at 266 nm was observed as the concentration of PAA-g-Dex increased (Fig. 3b). Moreover, larger intensity changes were observed for the DNA strands with a higher GC content. These results suggest that the GC-rich sequences undergo the B–A transition as the concentration of PAA-g-Dex increases. It was previously reported that the GC rich sequences undergo the B–A transition following the addition of organic solvents such as ethanol,17 methanol,18 and trifluoroethanol (TFE).19 Vorlícková et al. reported that Sarcina lutea DNA (72% GC) underwent the transition from the B- to A-form in the presence of 80% v/v (20 M) methanol, whereas calf thymus DNA (42% GC) and Bacillus cereus DNA (33% GC) did not.18 Kypr et al. reported that a more prominent CD spectrum due to A-form DNA was observed for d(CCGGCGCCGG) (100% GC) in 82% (11 M) TFE than for d(CATGGCCATG) (60% GC) in the same solvent.20 In this study, we found that DNA sequences with a GC content of above 50% showed a drastic B–A transition in the presence of PAA-g-Dex, consistent with previous reports showing that DNA duplexes with a higher GC content tended to undergo the B–A transition. It is noteworthy that GC8 underwent the B–A transition in the presence of PAA-g-Dex (N/P = 3.0, corresponding to the 1.2 mM amino group in the polymer). This is a four order lower concentration compared to the 80% v/v alcohol (greater than 10 M) required to trigger the transition. Moreover, PAA-g-Dex can induce the B–A transition even in GC5 (50% GC) (Fig. 3b). It was previously reported that DNA sequences with a GC content of 60% or lower did not completely undergo the B–A transition, even following the addition of 81% TFE.20 Therefore, it appears that PAA-g-Dex is a very powerful inducer of the B–A transition for DNA sequences with a wider range of GC contents. In addition, we attempted to confirm the B–A transition by UV absorption spectroscopy. In the ESI,† Fig. S1a shows the UV spectra of 5 μM GC8 in the presence of PAA-g-Dex (N/P = 0–3.0). The different spectra, obtained by subtraction of the spectrum in the absence of PAA-g-Dex from the spectra in the presence of PAA-g-Dex, showed positive and negative peaks at around 297 nm and at 250 nm, respectively (Fig. S1b, ESI†), which are characteristic for the B–A transition induced by alcohols.21 These results support that the B–A transition of GC8 is induced by PAA-g-Dex.
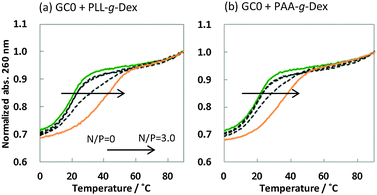
It is generally believed that DNA duplexes undergo the B–A transition due to dehydration of the GC rich DNA duplexes,8,22,23 allowing alcohols to induce the transition.9,16,18,20 We inferred that the B–A transition in the presence of PAA-g-Dex was also caused by the dehydration of the DNA strands. PAA-g-Dex has a methylene backbone whereas the PLL backbone is composed of amide bonds. The more flexible and hydrophobic backbone of PAA-g-Dex coils around DNA, thus more efficiently preventing water molecules from binding to the grooves of the DNA strands compared to PLL-g-Dex. Consequently, DNA duplexes may undergo the B–A transition upon interaction with PAA-g-Dex but not with PLL-g-Dex. On the basis of this, we attempted to evaluate the thermodynamics controlling the B–A transition in order to elucidate the mechanism by which the transition is induced by PAA-g-Dex. Fig. 3 shows normalized UV melting curves at 260 nm of 20 μM GC0 in NaCl buffer in the presence of various concentrations (N/P = 0–3.0) of PLL-g-Dex (Fig. 4a) or PAA-g-Dex (Fig. 4b). In the ESI,† Fig. S2 and S3 show normalized melting and annealing curves of GC0 and GC8, respectively, in the presence of PLL-g-Dex or PAA-g-Dex. Although evaporation at higher temperatures was observed in the melting curves, there was no hysteresis under all the experimental conditions, indicating a two-state transition of the DNA structural formation. In the absence of the cationic polymer, the melting temperature (Tm) of the duplex was 19.6 °C. Upon the addition of PLL-g-Dex and PAA-g-Dex up to N/P = 3.0, the Tm value increased to 40.3 °C and 36.3 °C, respectively. These results show that PLL-g-Dex and PAA-g-Dex significantly stabilize the DNA duplex of GC0. Similar stabilization by the cationic polymers was observed for other sequences (GC2, GC4, GC5, GC6, and GC8) as shown in the ESI,† Fig. S4, consistent with a previous report of the effect of PLL-g-Dex on DNA duplexes.24 Interestingly, the Tm values of the DNA duplexes show that the degree of stabilization depends on the nucleotide sequence. Table 1 shows the Tm value, as well as the thermodynamic parameters ( = Gibbs free energy change at 25.0 °C, ΔH° = enthalpy change, TΔS° = entropy change at 25.0 °C) of the DNA duplexes at N/P = 0 and N/P = 3.0.
  for GC0 was −6.2 kcal mol−1 at N/P = 0. At N/P = 3.0 of PLL-g-Dex and PAA-g-Dex, the DNA duplex of GC0 was stabilized to
  = −9.4 kcal mol−1 (
 = −3.2 kcal mol−1) and
  = −9.3 kcal mol−1 (
 = −3.1 kcal mol−1), respectively. The value of ΔΔG° follows the change in TΔS°, from −52.1 kcal mol−1 to −33.7 kcal mol−1 (PLL-g-Dex) and 36.6 kcal mol−1 (PAA-g-Dex), showing that stabilization is dominated by entropic contributions. These observed entropic stabilizations are consistent with a previous report showing that the effects of counterion condensation on DNA structures, and complex formation between DNA and cationic molecules, are driven by entropic contributions.24 These results indicate that the stabilization of GC0 by PLL-g-Dex and PAA-g-Dex is due to the inhibition of counterion condensation by binding of the cationic polymers. In contrast, the value of
  of GC8 in the presence of PLL-g-Dex was essentially unaltered (
 = 0.4 kcal mol−1), whereas the addition of PAA-g-Dex to GC8 induced drastic stabilization (
 = −7.2 kcal mol−1). This large
  arises from the change in the ΔH° value, demonstrating that the stabilization of GC8 by PAA-g-Dex is dominated by an enthalpic contribution, although GC8 folds into the A-form duplex in the presence of PAA-g-Dex. In a previous study, we reported that the enthalpic stabilization of DNA structures by molecular crowding was attributable to the hydration state of the DNA structure because co-solutes that induce molecular crowding conditions decrease the activity of water molecules.24,25 Therefore, the enthalpic stabilization of GC8 by PAA-g-Dex suggests the dehydration of the DNA strands by PAA-g-Dex, although it is also possible that the formation of direct interactions, such as electrostatic interactions and hydrogen bonds, between DNA strands and PAA-g-Dex contributes the enthalpic change.
| (kcal mol−1) | ΔH° (kcal mol−1) | TΔS° (kcal mol−1) | T m (°C) | |
|---|---|---|---|---|
| GC0 | ||||
| N/P = 0 polymer | −6.2 (0.1) | −58.3 (2.7) | −52.1 (2.7) | 19.6 (0.4) |
| N/P = 3.0 PLL-g-Dex | −9.4 (0.3) | −43.1 (2.7) | −33.7 (2.5) | 40.8 (0.8) |
| N/P = 3.0 PAA-g-Dex | −9.3 (1.1) | −45.9 (6.6) | −36.6 (5.5) | 36.3 (2.0) |
| GC8 | ||||
| N/P = 0 polymer | −14.7 (0.1) | −75.2 (0.9) | −60.5 (0.8) | 57.8 (0.2) |
| N/P = 3.0 PLL-g-Dex | −14.3 (0.1) | −56.9 (0.6) | −42.6 (0.5) | 66.9 (0.6) |
| N/P = 3.0 PAA-g-Dex | −21.9 (2.1) | −117 (14.9) | −95.0 (12.8) | 67.6 (1.0) |
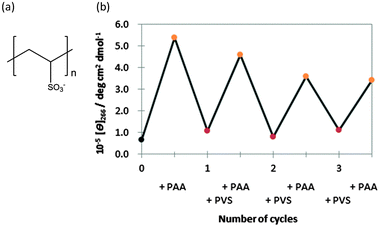
It is generally difficult to induce a reversible B–A–B transition in the presence of the high concentrations of alcohols and salts, which are used to induce the B–A transition, because of the difficulty in removing these inducers from the solution. However, if PAA-g-Dex could be removed from the vicinity of the DNA molecule, the A–B transition could likely be induced. As a proof-of-concept, we attempted to induce and regulate reversibly the B–A transition by the addition of an anionic polymer. The anionic polymer may form a polyionic complex with PAA-g-Dex, leading to dissociation of PAA-g-Dex from the DNA duplexes. We used poly(vinyl sulfonate) (PVS) (Fig. 5a) as the anionic polymer. Fig. 5b shows the CD intensity change at 266 nm of GC8 during the repetitive addition of PAA-g-Dex and PVS. In the first cycle, the B–A transition was induced by PAA-g-Dex (addition of N/P = 3.0). The reverse transition, the A–B transition, was induced by adding 800 μM PVS (corresponding to the sulfonate concentration). The CD intensities at 266 nm before the addition of PAA-g-Dex and after the addition of PVS were 5.38 × 10⁵ and 1.07 × 10⁵ deg cm2 dmol−1, respectively. The CD intensities before and after the first cycle are similar, indicating that the transition of GC8 induced by the cationic and anionic polymers is almost reversible. The reversible association and dissociation of PAA-g-Dex with GC8 were further confirmed by non-denaturing polyacrylamide gel electrophoresis of GC8 as shown in the ESI,† Fig. S5. We confirmed that the thermodynamic parameters after the addition of PVS are comparable to those of GC8 in the absence of any ionic polymer additive (ESI,† Table S1). Moreover, multiple cycles were induced by alternating the addition of PAA-g-Dex (N/P = 3.0) and PVS (800 μM). Although the amplitude of the CD intensity change decreased with successive cycles, the CD intensity at 266 nm after each cycle was essentially constant. The cycling efficiency was estimated to be 79%; the attenuation may be due to the complex formation by PAA-g-Dex and PVS.
In conclusion, our results showed that PAA-g-Dex can induce the B–A transition of GC rich DNA duplexes (GC5, GC6, and GC8), primarily by changes in the hydration state of the DNA upon binding of PAA-g-Dex. Moreover, we demonstrated reversible control of the B–A transition by alternatively adding PAA-g-Dex and PVS. This work will contribute to the development of not only biotechnology, but also nanotechnology applications utilizing the B–A transition.
This work was supported by the Grants-in-Aid for Scientific Research on Innovative Areas “Nanomedicine Molecular Science” (No. 2306) and “Molecular Robotics” (No. 15H00804) from MEXT, Japan, by “Strategic Research Foundation at Private Universities” from MEXT, Japan, by the Center of Innovation (COI) Program from MEXT, Japan, by KAKENHI (No. 15H03840, 16K14042, 15H01807, 25350552) from JSPS, Japan, and by the Asahi Glass Foundation.
Notes and references
- J. D. Watson and F. H. C. Crick, Nature, 1953, 171, 737 CrossRef CAS PubMed.
- V. I. Ivanov, L. E. Minchenkova, E. E. Minyat, M. D. Frank-Kamenetskii and A. K. Schyolkina, J. Mol. Biol., 1974, 87, 817 CrossRef CAS PubMed.
- T. J. Povsic and P. B. Dervan, J. Am. Chem. Soc., 1989, 111, 3059 CrossRef CAS.
- S. Nakano, D. Miyoshi and N. Sugimoto, Chem. Rev., 2014, 114, 2733 CrossRef CAS PubMed.
- S. Jones, P. Van Heyningen, H. M. Berman and J. M. Thornton, J. Mol. Biol., 1999, 287, 877 CrossRef CAS PubMed.
- X.-J. Lu, Z. Shakked and W. K. Olson, J. Mol. Biol., 2000, 300, 819 CrossRef CAS PubMed.
- G. N. Parkinson, M. P. H. Lee and S. Neidle, Nature, 2002, 417, 876 CrossRef CAS PubMed.
- A. K. Mazur, J. Am. Chem. Soc., 2003, 125, 7849 CrossRef CAS PubMed.
- J. Kypr, I. Kejnovská, D. Renčiuk and M. Vorlíčková, Nucleic Acids Res., 2009, 37, 1713 CrossRef CAS PubMed.
- D. B. Nikolov, H. Chen, E. D. Halay, A. Hoffmann, R. G. Roeder and S. K. Burley, Proc. Natl. Acad. Sci. U. S. A., 1996, 93, 4862 CrossRef CAS.
- V. I. Ivanov, L. E. Minchenkova, B. K. Chernov, P. McPhie, S. Ryu, S. Garges, A. M. Barber, V. B. Zhurkin and S. Adhya, J. Mol. Biol., 1995, 245, 228 CrossRef CAS PubMed.
- J. R. Kiefer, C. Mao, J. C. Braman and L. S. Beese, Nature, 1998, 391, 304 CrossRef CAS PubMed.
- D. R. Whelan, T. J. Hiscox, J. I. Rood, K. R. Bambery, D. McNaughton and B. R. Wood, J. R. Soc., Interface, 2014, 11, 20140454 CrossRef PubMed.
- A. Maruyama, T. Ishihara, J.-S. Kim, S. W. Kim and T. Akaike, Bioconjugate Chem., 1997, 8, 735 CrossRef CAS PubMed.
- Y. Sato, Y. Kobayashi, T. Kamiya, H. Watanabe, T. Akaida, K. Yoshikawa and A. Maruyama, Biomaterials, 2005, 26, 703 CrossRef CAS PubMed.
- J. H. Riazance, W. A. Baase, W. C. Johnson, K. Hall, P. Cruz and I. Tinoco, Nucleic Acids Res., 1985, 13, 4983 CrossRef CAS PubMed.
- A. Noy, A. Pérez, C. A. Laughton and M. Orozco, Nucleic Acids Res., 2007, 35, 3330 CrossRef CAS PubMed.
- M. Vorlíčková, E. E. Minyat. and J. Kypr, Biopolymers, 1984, 23, 1 CrossRef PubMed.
- M. Vorlíčková, J. A. Subirana, J. Chládková, I. Tejralová, T. Huynh-Dinh, L. Arnold and J. Kypr, Biophys. J., 1996, 71, 1530 CrossRef.
- J. Kypr, J. Chládková, M. Zimulová and M. Vorlícková, Nucleic Acids Res., 1999, 27, 3466 CrossRef CAS PubMed.
- D. Jose and D. Porschke, Nucleic Acids Res., 2004, 32, 2251 CrossRef CAS PubMed.
- K. M. Knee, S. B. Dixit, C. E. Aitken, S. Ponomarev, D. L. Beveridge and I. Mukerji, Biophys. J., 2008, 95, 257 CrossRef CAS PubMed.
- M. Feig and B. M. Pettitt, J. Mol. Biol., 1999, 286, 1075 CrossRef CAS PubMed.
- D. Miyoshi, Y. Ueda, N. Shimada, S. Nakano, N. Sugimoto and A. Maruyama, ChemMedChem, 2014, 9, 2156 CrossRef CAS PubMed.
- S. Muhuri, K. Mimura, D. Miyoshi and N. Sugimoto, J. Am. Chem. Soc., 2009, 131, 9268 CrossRef CAS PubMed.
Footnote |
| † Electronic supplementary information (ESI) available: UV melting curves and thermodynamic parameters. See DOI: 10.1039/c6cc02237e |
| This journal is © The Royal Society of Chemistry 2016 |

