 Open Access Article
NMR analysis of weak molecular interactions using slice-selective experiments via study of concentration gradients in agar gels†
Y.
Mitrev
ab,
S.
Simova
b and
D.
Jeannerat
*a
aDepartment of Organic Chemistry, University of Geneva, 1211, Geneva 4, Switzerland. E-mail: Damien.Jeannerat@unige.ch
bInstitute of Organic Chemistry with Centre of Phytochemistry, Bulgarian Academy of Sciences, 1113 Sofia, Bulgaria
First published on 15th March 2016
Abstract
Weak molecular interactions can be localized and quantified using a single NMR experiment analysing concentration gradients generated in agar gels. The spectra from various cross-sections along the gradient were obtained using a slice-selective pulse sequence realisable with standard NMR equipment.
NMR titrations are among the most widely applied methods for quantitative investigations of non-covalent interactions in solution. Association parameters (association constants and stoichiometry) can be calculated from the variations of NMR parameters induced by complexation. This requires a series of spectra with a varying concentration ratio between the interacting species.1 Titrations are usually performed either as a time consuming “single-tube” titration, incrementing the concentration of the titrant manually, or in a product consuming “multiple-tube” manner, where a series of samples with different compositions are prepared. Recently, Niklas et al.2 introduced a single-shot NMR titration by performing slice-selective 1H and 7Li experiments to study concentration gradients created by the dissolution of frozen 12-crown-4 ether in LiClO4/acetonitrile-d3. Such an approach circumvents simultaneously both disadvantages of the classical titration, allowing for the efficient use of chemicals to obtain titration data in a matter of minutes, once the concentration gradient is developed. Despite the promising results, the freezing/mixing scheme is limited to systems where one of the components is solid or could be easily frozen. A more practical medium would be to include one of the components in a porous matrix and to allow the other to diffuse, thus giving the system more resistance to mechanical stress. Such a system is used by the authors2 to monitor the chemical reaction of N,N,N′,N′′N′′-pentamethyldiethylenetriamine with nBuLi/toluene-d8 in a swollen polystyrene gel. Combining both approaches, we extend the range of applications of single-shot NMR titrations to aqueous samples and present a very robust and practical system based on agar gels.
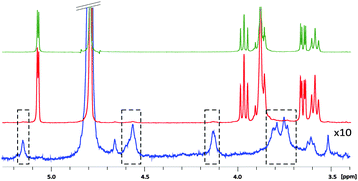
Agar and its main component, agarose, are known to form physical gels with nanometre pore size at concentrations lower than 1%,3 allowing efficient molecular diffusion even for large molecules.4 They are commonly used in separation techniques such as electrophoresis.5 Concerning NMR spectroscopy, these gels have a remarkable property of causing no observable changes in the chemical shifts and line shapes compared to normal aqueous solutions (Fig. 1).6 Moreover, the small quantity and the favourable relaxation properties of these gels result in the “NMR invisibility” of the matrix. This is not the case of other water compatible gels such as polyacrylamide. The thermoreversible nature of agar and agarose gels allows for quick and easy preparation of uniform samples by a simple heating/cooling cycle. This contrasts with the chemically cross-linked polymer gels such as polystyrene or PBLG requiring several days to obtain homogeneous swelling.7 Finally, agar gels are compatible with a wide range of pH (2 to 9 at RT) and provide an attractive opportunity to record spectra of aqueous solutions down to −10 °C because they reduce the freezing temperature of water.6a
 | ||
| Fig. 1 1D 1H spectra of 7 mM β-cyclodextrin in the absence (top) and presence (middle) of 1% (w/v) agar gel. Spectrum of the gel alone (bottom) with 10 times increase of the vertical scale. | ||
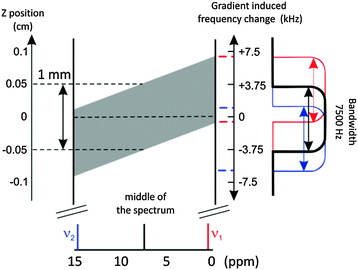
Slice-selective experiments are gaining popularity as methods to study diverse systems where the composition varies along the NMR tube.7,8 The NMR spectrum of a single slice across the NMR tube is obtained by combining the controlled inhomogeneity of the B0 field (called pulsed-field gradient or PFG) with a frequency selective pulse. Both are standard features of any modern NMR spectrometer (Fig. 2). The same principle is used in homodecoupling techniques,10 with one major difference when studying inhomogeneous samples, which is the requirement of less selective pulses (min. bandwidth equal to the spectral width) in order to obtain information from a discrete region of the sample. Recording a series of spectra by systematically varying the carrier frequency of the selective pulse scans the NMR tube along its axis over ca. 1.3 cm (13 slices, approx. 1 mm each). This sample height was chosen to ensure a uniform excitation, thus avoiding loss of signal intensity at the boundaries of the active volume of the detection coil (see the ESI†). The sensitivity of the experiment is proportional to the selected volume of the individual slice, i.e. ≈5% of a normal 1H spectrum. But this reduction in the signal-to-noise ratio can be compensated by the opportunity to record the full series of 5–20 spectra without relaxation recovery period, thus significantly decreasing the overall data acquisition time (see the ESI† for details on interleaved acquisition). This approach was successfully used to study the kinetics of fast reactions in solution,11 but we present the first application to the analysis of inhomogeneous samples.
 | ||
| Fig. 2 Schematic representation of a section of the NMR tube in a slice-selective experiment. During a pulse-field gradient (PFG) of 17.62 g cm−1, a linear field gradient along the direction of the NMR tube causes a spatial dependence of the Larmor frequency relative to a mid-tube frequency of 500 MHz (see the vertical scale in kHz). The application of a selective G4 gaussian cascade9 in the middle of the spectrum selects a bandwidth of 7.5 kHz (see the excitation profile on the right) which selects only a 1 mm slice of the NMR tube (filled in grey in the center). Note the slightly different location of the signals depending on the chemical shift (tilt of the selected region). This effect could be neglected in our case (< 0.07 mm per ppm), but may require a correction when using weaker PFG. | ||
As a model system to demonstrate that agar gels can be used for quantitative analysis we choose the determination of the affinity of β-cyclodextrin (CD) for paracetamol. It exhibits a simple 1![[thin space (1/6-em)]](https://www.rsc.org/images/entities/char_2009.gif) :
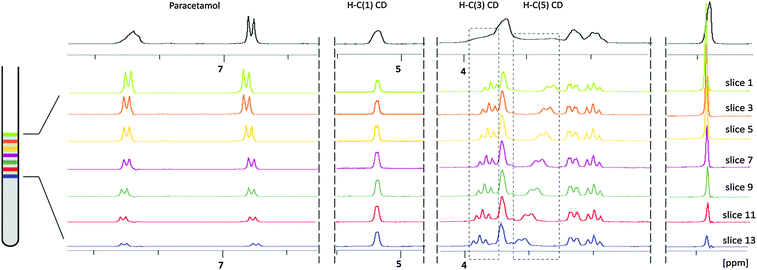
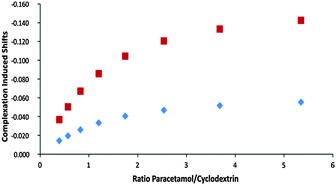
:![[thin space (1/6-em)]](https://www.rsc.org/images/entities/char_2009.gif) 1 complexation behaviour with a relatively low association constant of about 150 M−1.12,13 The preparation of 1% gels is straightforward: 4 mg of agar are directly suspended in a standard 5 mm NMR tube with 400 μL of the D2O solution of cyclodextrin. A 5 min stirring of the suspension in the NMR tube immersed in a hot water bath (ca. 90 °C) using a Pasteur pipette ensures a perfectly homogeneous solution. The tube is then taken out of the bath and fixed in a vertical position. The gel forms during a 15 min cooling period towards room temperature and is stabilized during 1 h at 4 °C.14 The concentration gradient was obtained after adding 0.2 mL of the titrant solution on top of the gel. To evaluate the temporal stability and overall performance of the system, the gel containing 7 mM cyclodextrin was titrated with a 70 mM paracetamol solution and slice selective spectra were recorded during a 3 day period. Using interleaved acquisitions, each set of 13 quantitative spectra, covering 13 mm of sample was acquired in ca. 6 minutes (Fig. 3). After 24 hours, simple integration of paracetamol aromatic proton signals and H–C(1) from the cyclodextrin gave paracetamol/cyclodextrin ratios from 0.7 to 7.6. The differences of the chemical shifts of H–C(5) and of H–C(3) provide the necessary variation to follow the complex formation (from 30% to 84%) over the analysed 1.3 cm concentration gradient (Fig. 4). Besides a sensitivity reduction by a factor 20, the only significant difference with spectra obtained using a classical titration is the modest broadening of the drifting signals caused by the concentration gradient after spectral averaging within the slice thickness (see the ESI†).
1 complexation behaviour with a relatively low association constant of about 150 M−1.12,13 The preparation of 1% gels is straightforward: 4 mg of agar are directly suspended in a standard 5 mm NMR tube with 400 μL of the D2O solution of cyclodextrin. A 5 min stirring of the suspension in the NMR tube immersed in a hot water bath (ca. 90 °C) using a Pasteur pipette ensures a perfectly homogeneous solution. The tube is then taken out of the bath and fixed in a vertical position. The gel forms during a 15 min cooling period towards room temperature and is stabilized during 1 h at 4 °C.14 The concentration gradient was obtained after adding 0.2 mL of the titrant solution on top of the gel. To evaluate the temporal stability and overall performance of the system, the gel containing 7 mM cyclodextrin was titrated with a 70 mM paracetamol solution and slice selective spectra were recorded during a 3 day period. Using interleaved acquisitions, each set of 13 quantitative spectra, covering 13 mm of sample was acquired in ca. 6 minutes (Fig. 3). After 24 hours, simple integration of paracetamol aromatic proton signals and H–C(1) from the cyclodextrin gave paracetamol/cyclodextrin ratios from 0.7 to 7.6. The differences of the chemical shifts of H–C(5) and of H–C(3) provide the necessary variation to follow the complex formation (from 30% to 84%) over the analysed 1.3 cm concentration gradient (Fig. 4). Besides a sensitivity reduction by a factor 20, the only significant difference with spectra obtained using a classical titration is the modest broadening of the drifting signals caused by the concentration gradient after spectral averaging within the slice thickness (see the ESI†).
The association constant and the complexation induced shifts (CIS, Δδ = δcomplex − δfree) were calculated according to a 1![[thin space (1/6-em)]](https://www.rsc.org/images/entities/char_2009.gif) :
:![[thin space (1/6-em)]](https://www.rsc.org/images/entities/char_2009.gif) 1 model by simultaneous least square fitting of the experimental data for H–C(3) and H–C(5). Table 1 compares the constants determined by the proposed gel titration method with the values obtained from conventional solution titration and literature data. In all cases excellent agreement is observed.
1 model by simultaneous least square fitting of the experimental data for H–C(3) and H–C(5). Table 1 compares the constants determined by the proposed gel titration method with the values obtained from conventional solution titration and literature data. In all cases excellent agreement is observed.
Because of its lower sensitivity, our approach is most appropriate for systems with concentration in the mM range. Optimal titration conditions and necessary diffusion times are presented in Table 2, to demonstrate its preferential use for systems with association constants between 10 and 103 (see Table 2 and the ESI† for details on diffusion dynamics).
| K a | Analyte (M) | Titrant (M)a | Diffusion timec (hours) | |
|---|---|---|---|---|
| Max. | Min. | |||
| a Minimum and maximum concentrations of a titrant required to observe complexation between 20% and 80%. b Optimal titration conditions15 are presented in bold. c Calculated diffusion time of a titrant to achieve the desired concentrations at the top and the bottom of the gel respectively for a titrant with D = 6.2 × 10⁻⁴ mm2 s−1 (e.g. paracetamol at 25 °C). | ||||
| 10 |
0.001
0.01 |
0.4008
0.408 0.48 |
0.0252
0.027 0.045 |
10
10 12 |
| 100 |
0.001
0.1 |
0.0408
0.048 0.12 |
0.0027
0.0045 0.0225 |
10
12 20 |
| 1000 |
0.001
0.01 0.1 |
0.0048
0.012 0.084 |
0.00045
0.00225 0.02025 |
12
18 24 |
A single-shot NMR gel titration method was introduced to study weak molecular interactions in aqueous solutions. It utilizes the practical and quickly produced agar gel as medium for high-quality liquid state NMR measurements. Concentration gradients can be generated by the simple addition of the titrant solution on top of the gels. After an appropriate diffusion time, a series of spectra can be recorded using a slice-selective 1D 1H experiment to scan the concentration gradients. This approach cannot replace standard NMR titration when the sensitivity or signal enlargement is limited. But the fact that a full set of spectra can be recorded in a few minutes from a single NMR tube should make it very useful for qualitative screening of small libraries of compounds and opens the possibility of high-throughput analysis.
Financial support from the State of Geneva and the Swiss National Foundation 200021_147069 and 206021_128746 is acknowledged. The authors thank Marta Brucka and Marion Pupier for comments on the manuscript.
Notes and references
- (a) Y. Cohen, L. Avram and L. Frish, Angew. Chem., Int. Ed. Engl., 2005, 44, 520 CrossRef CAS PubMed; (b) A. Pastor and E. Martínez-Viviente, Coord. Chem. Rev., 2008, 252, 2314 CrossRef CAS; (c) P. Thordarson, Chem. Soc. Rev., 2011, 40, 1305 RSC.
- T. Niklas, D. Stalke and M. John, Chem. Commun., 2015, 51, 1275 RSC.
- M. Maaloum, N. Pernodet and B. Tinland, Electrophoresis, 1998, 19, 1606 CrossRef CAS PubMed.
- A. Pluen, P. A. Netti, R. K. Jain and D. A. Berk, Biophys. J., 1999, 77, 542 CrossRef CAS PubMed.
- P. Serwer, Electrophoresis, 1983, 4, 375 CrossRef CAS.
- (a) A. M. Spring and M. W. Germann, Anal. Biochem., 2012, 427, 79 CrossRef CAS PubMed; (b) A. Pastore, S. Salvadori and P. A. Temussi, J. Pept. Sci., 2007, 13, 342 CrossRef CAS PubMed.
- A. C. Poppler, S. Frischkorn, D. Stalke and M. John, ChemPhysChem, 2013, 14, 3103 CrossRef PubMed.
- (a) J. Allen and K. Damodaran, Magn. Reson. Chem., 2015, 53, 200 CrossRef CAS PubMed; (b) P. Trigo-Mourino, C. Merle, M. R. Koos, B. Luy and R. R. Gil, Chem. – Eur. J., 2013, 19, 7013 CrossRef CAS PubMed.
- L. Emsley and G. Bodenhausen, Chem. Phys. Lett., 1990, 165, 469–476 CrossRef CAS.
- L. Castañar and T. Parella, Magn. Reson. Chem., 2015, 53, 399 CrossRef PubMed.
- (a) G. E. Wagner, P. Sakhaii, W. Bermel and K. Zangger, Chem. Commun., 2013, 49, 3155 RSC; (b) J. Kind and C. M. Thiele, J. Magn. Reson., 2015, 260, 109 CrossRef CAS PubMed.
- N. S. Moyon, T. S. Singh and S. Mitra, Biophys. Chem., 2008, 138, 55 CrossRef CAS PubMed.
- M. El-Kemary, S. Sobhy, S. El-Daly and A. Abdel-Shafi, Spectrochim. Acta, Part A, 2011, 79, 1904 CrossRef CAS PubMed.
- N. Kusukawa, M. V. Ostrovsky and M. M. Garner, Electrophoresis, 1999, 20, 1455 CrossRef CAS PubMed.
- K. Hirose, Quantitative Analysis of Binding Properties, in Analytical Methods in Supramolecular Chemistry, ed. C. A. Schalley, Wiley-VCH Verlag GmbH & Co. KGaA, Weinheim, Germany, 2012, pp. 27–66 Search PubMed.
Footnote |
| † Electronic supplementary information (ESI) available: Detailed procedures, experimental parameters, pulse sequence, AU programs and additional investigations. See DOI: 10.1039/c6cc01853j |
| This journal is © The Royal Society of Chemistry 2016 |


