 Open Access Article
Creative Commons Attribution 3.0 Unported Licence
Demonstrating the steady performance of iron oxide composites over 2000 cycles at fast charge-rates for Li-ion batteries†
Z.
Sun
*ab,
E.
Madej
a,
A.
Genç
cd,
M.
Muhler
e,
J.
Arbiol
cf,
W.
Schuhmann
a and
E.
Ventosa
*a
aAnalytical Chemistry – Center for Electrochemical Sciences (CES), Ruhr-Universität Bochum, D-44780 Bochum, Germany. E-mail: edgar.ventosa@rub.de
bState Key Laboratory of Organic-Inorganic Composites, Beijing University of Chemical Technology, Beijing 100029, China. E-mail: sunzy@mail.buct.edu.cn
cCatalan Institute of Nanoscience and Nanotechnology (ICN2), CSIC and The Barcelona Institute of Science and Technology, Campus UAB, Bellaterra, 08193 Barcelona, Catalonia, Spain
dMetallurgy and Materials Engineering Department, Faculty of Engineering, Bartin University, 74100, Bartin, Turkey
eLaboratory of Industrial Chemistry, Ruhr-Universität Bochum, D-44780 Bochum, Germany
fInstitució Catalana de Recerca i Estudis Avançats, ICREA, 08010 Barcelona, Spain
First published on 11th April 2016
Abstract
The feasibility of using iron oxides as negative electrode materials for safe high-power Li-ion batteries is demonstrated by the carbon-coated FeOx/CNT composite synthesized by controlled pyrolysis of ferrocene, which delivered a specific capacity retention of 84% (445 mA h g−1) after 2000 cycles at 2000 mA g−1 (4C).
The energy density of the state-of-the-art Li-ion batteries (LIBs) is sufficient to fulfill the requirements for hybrid electric vehicles (HEVs); nevertheless, it is still below the needs for full electric vehicles (EVs).1 Consequently, great effort is being devoted to the development of high-energy-density materials, which is essential for the consolidation of EVs. When tackling this major challenge, other important parameters that determine the overall performance of a battery material, namely energy density, power density, cost, lifetime, and safety,2,3 may sometimes be overseen.
Graphite is a well-performing, cheap and high-energy-density material; however, safety issues arise at high charge rates (C-rates) due to the small voltage gap (<0.1 V) between lithiation of graphite and electrodeposition of lithium. Iron oxides are considered to be alternative negative electrode materials owing to their high specific charge capacity (1000 mA h g−1) and low cost.4–6 Compared to graphite, they operate at more anodic potentials and thus offer higher safety. Nevertheless, the lifetime and power density of iron oxides do not meet the requirements for implementation in commercial LIBs. To compete with graphite, iron oxides must improve their performance, namely the retention of storage capacity at fast C-rates. Therefore, iron oxide must retain its reversible specific charge capacity upon many cycles (>1000) under demanding electrochemical conditions, which is very difficult to achieve due to the charge storage mechanism in iron oxides.6 Metallic iron and lithium oxide are formed during the reduction of iron oxide. On the one hand, the formation of the ionic and electric insulating lithium oxide hinders the reversibility of the electrochemical process. On the other hand, the volume changes accompanying the reversible process lead to the pulverization of the electrode material. The detrimental impacts of these factors are magnified when operating at high C-rates due to the mechanical stress induced by the fast volume changes as well as the large overpotentials caused by the high current intensities. Herein, we present a facile synthesis strategy for carbon@FeOx composite materials with improved cycle stability at high C-rates. By controlled pyrolysis of ferrocene, a precursor that supplies both iron and carbon, at 550 and 650 °C in an autoclave, carbon-coated FeOx/carbon nanotube (CNT) composites were synthesized (Fig. S1, ESI†). The composites delivered an outstanding specific charge retention of up to 84% (445 mA h g−1) after 2000 cycles under fast cycling conditions (2000 mA g−1 and 4C).
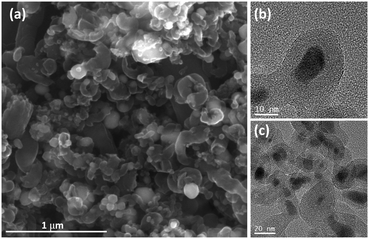
Barreiro et al. showed that single-walled CNTs can be obtained by the decomposition of ferrocene at 900 °C,7 whereas Brandt and Balducci employed ferrocene as a precursor for the synthesis of the carbon@Fe2O3 composite at 1050 °C which delivered good electrochemical performance as an active material for LIBs demonstrating that ferrocene is a suitable precursor for battery materials.8 To achieve long-term stability at high C-rates, iron oxide based electrodes would benefit from (i) small FeOx particle sizes that can facilitate the electrochemical reaction and lower the mechanical stress,9–11 (ii) graphitic carbon coating of FeOx for mechanical stability,12–14 and (iii) interconnected CNTs enhancing the inter-particle electrical conductivity at high C-rates.15–17 Since the role of the carbon coating (electrical conductivity and mechanical stability) is more important than that of CNTs, the pyrolysis of ferrocene was carried out at lower temperatures (550 and 650 °C) in the absence of precursor flow (autoclave) in an attempt to promote the formation of carbon coating. We focus the discussion on FeOx(650)/C because of its slightly better electrochemical performance than FeOx(550)/C, which is likely due to the enhanced graphitic character of carbon present in FeOx(650)/C. Note that the structural and electrochemical characterization of FeOx(550)/C is shown in the ESI.†Fig. 1a (and Fig. S2a and S3, ESI†) shows the formation of a short one-dimensional carbon structure presumably due to the nucleation and growth of C species on metallic Fe nanoparticles resulting from the decomposition of ferrocene. Fig. 1a also suggests that a number of iron particles (brighter features) are embedded in carbon. Transmission electron microscopy (TEM) and high-resolution TEM (HRTEM) micrographs (Fig. 1b and c and Fig. S4, ESI†) confirmed that iron particles were covered by graphitic carbon featuring the typical (0002) planes with lattice parameters of a = 0.246 nm and c = 0.671 nm (space group = P63/mmc).
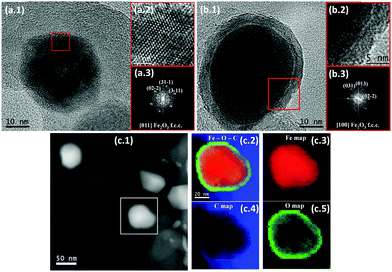
Since metallic iron is not active for Li-ion storage,18–20 the autoclave was cautiously opened at 350 °C during cooling to oxidize the iron particles. Note that drastic overpressure was not observed due to the lack of solvent. HRTEM micrographs of the composite revealed that there were two types of iron particles, namely solid iron oxides and core/shell (Fe/FeOx) structures. The Fast Fourier Transformation (FFT) of the selected area in Fig. 2a (and Fig. S5, ESI†) confirmed that one type of particle consists of a face-centered cubic α-Fe2O3 phase (hematite) (space group = Fd![[3 with combining macron]](https://www.rsc.org/images/entities/char_0033_0304.gif) m, lattice parameter a = 0.833 nm) while Fig. 2b shows that a number of particles possess a core/shell structure, some of which acted as catalysts for CNT growth (Fig. S7, ESI†). FFT analysis of the selected area (Fig. 2b.3) indicates that the shell consists of α-Fe2O3. Since the nature of the particle core could not be elucidated by FFT due to insufficient details of the core for larger particles (Fig. 2b) and the presence of Moiré fringes for smaller ones (Fig. S6, ESI†), STEM electron energy-loss spectra (EELS) were employed to further characterize the core/shell structure. Fig. 2c (and Fig. S8, ESI†) shows the HAADF STEM micrograph of FeOx(650)/C and the EELS composition maps of Fe, O, C and Fe–O–C from the indicated area. The results of STEM EELS confirmed that the nanostructure was composed of a metallic iron core and an iron oxide shell. Therefore, opening of the autoclave at 350 °C during cooling could not completely oxidize all iron particles due to insufficient time and/or the protecting effect of carbon.
m, lattice parameter a = 0.833 nm) while Fig. 2b shows that a number of particles possess a core/shell structure, some of which acted as catalysts for CNT growth (Fig. S7, ESI†). FFT analysis of the selected area (Fig. 2b.3) indicates that the shell consists of α-Fe2O3. Since the nature of the particle core could not be elucidated by FFT due to insufficient details of the core for larger particles (Fig. 2b) and the presence of Moiré fringes for smaller ones (Fig. S6, ESI†), STEM electron energy-loss spectra (EELS) were employed to further characterize the core/shell structure. Fig. 2c (and Fig. S8, ESI†) shows the HAADF STEM micrograph of FeOx(650)/C and the EELS composition maps of Fe, O, C and Fe–O–C from the indicated area. The results of STEM EELS confirmed that the nanostructure was composed of a metallic iron core and an iron oxide shell. Therefore, opening of the autoclave at 350 °C during cooling could not completely oxidize all iron particles due to insufficient time and/or the protecting effect of carbon.
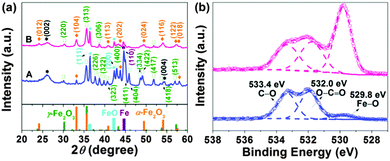
The phase composition and crystalline structure of the samples were further characterized by powder X-ray diffraction (XRD). The resolved diffraction peaks (Fig. 3a) in traces A are well indexed as the γ-Fe2O3 (maghemite) phase with a tetragonal structure (JCPDS file 01-089-5894). Note that the XRD pattern does not allow an unambiguous distinction of maghemite and Fe3O4 (magnetite) due to their similar reflections. Two pronounced diffraction peaks at approximately 36.4 and 42.2°, originating from the (111) and (200) reflections of cubic FeO (JCPDS file 001-1223), were also observed. The strong peak at around 44.7° in traces A can be assigned to the (110) reflection of metallic Fe (JCPDS file 06-0696). Weak peaks at about 24.1, 33.2, 40.8, and 43.7° correspond to the (012), (104), (113), (202) reflections of rhombohedral α-Fe2O3 (hematite) (JCPDS file 033-0664). Additionally, there is a broad peak at ∼26.0° arising from the (002) reflection of the graphitic carbon structure. The formation of graphitic carbon was also confirmed by simultaneous differential scanning calorimetry (DSC) and thermogravimetric analysis (TGA) (Fig. S9, ESI†). To remove remaining amorphous carbon and decrease the content of metallic iron, FeOx(650)/C was calcined in air at 300 °C for 2 hours (mild oxidation), and the resultant sample was referred to as FeOx(650)/C_ox. Differential scanning calorimetry (DSC) thermograms showed that amorphous carbon was eliminated after calcining as evidenced by the lack of the pseudo-peak at 340 °C for FeOx(650)/C_ox (Fig. S9, ESI†), whereas XRD revealed that the reflections of Fe0 became significantly weakened upon calcining as seen in traces B (Fig. 3a). The carbon content of FeOx(650)/C and FeOx(650)/C_ox was determined by elemental analysis to be 43 wt% and 30 wt%, respectively. Utilizing the Scherrer equation for relating the coherently scattering domains to Bragg peak widths: L = kλ/B![[thin space (1/6-em)]](https://www.rsc.org/images/entities/char_2009.gif) cos(θ), in which k = 0.89 for spherical particles and B is the full angular width at half-maximum of the peak in radians, the average crystallite sizes in FeOx(650)/C was determined to be around 20 nm using the (311) reflection. Based on this estimation, no change in the particle size was observed during the thermal post-processing. The mean particle diameter was estimated to be 20 ± 14 nm based on TEM imaging of 100 different particles (Fig. S10, ESI†), which is in good agreement with the XRD results. Nitrogen adsorption/desorption measurements of FeOx(650)/C (Fig. S11, ESI†) indicate a mesoporous character of the sample as well as a high specific surface area (66 m2 g−1), which is beneficial for electrolyte accessibility and rapid Li-ion diffusivity.21–25 The presence of maghemite, magnetite and hematite in the sample prior to and after calcining was also verified using two vibrational spectroscopy techniques (FTIR and Raman) (Fig. S12 and S13, ESI†).
cos(θ), in which k = 0.89 for spherical particles and B is the full angular width at half-maximum of the peak in radians, the average crystallite sizes in FeOx(650)/C was determined to be around 20 nm using the (311) reflection. Based on this estimation, no change in the particle size was observed during the thermal post-processing. The mean particle diameter was estimated to be 20 ± 14 nm based on TEM imaging of 100 different particles (Fig. S10, ESI†), which is in good agreement with the XRD results. Nitrogen adsorption/desorption measurements of FeOx(650)/C (Fig. S11, ESI†) indicate a mesoporous character of the sample as well as a high specific surface area (66 m2 g−1), which is beneficial for electrolyte accessibility and rapid Li-ion diffusivity.21–25 The presence of maghemite, magnetite and hematite in the sample prior to and after calcining was also verified using two vibrational spectroscopy techniques (FTIR and Raman) (Fig. S12 and S13, ESI†).
 | ||
| Fig. 3 (a) XRD patterns and (b) O 1s XPS spectra of FeOx(650)/C (in blue) and FeOx(650)/C_ox (in purple). | ||
To provide insight into the surface composition of FeOx(650)/C, X-ray photoelectron spectroscopy (XPS) was employed. There are three elements detected in the samples, i.e., Fe, O and C (Fig. S14a, ESI†). The C 1s region (Fig. S14b, ESI†) shows a dominant peak at around 284.6 eV regardless of calcining, corresponding to graphitic carbon. Deconvolution of the spectra manifests three additional small peaks at ∼285.4 and 286.7 and 288.9 eV, which are assigned to carbon singly bound to oxygen in phenols and ethers (i.e. C–O), carbon doubly bound to oxygen in ketones and quinones (i.e. C![[double bond, length as m-dash]](https://www.rsc.org/images/entities/char_e001.gif) O), carbon bound to two oxygen atoms in carboxyls, carboxylic anhydrides and esters (i.e. –COO), respectively. The main graphitic C peak comprises ∼75% of the spectrum for the sample prior to calcining. Upon calcination, the graphitic C content decreased to ∼67% due to the mild oxidation of the C structure. Despite this, the value is still much higher than the one reported for graphene oxide (31% graphitic C).26 The Fe 2p3/2 region (Fig. S14c, ESI†) consists of a peak centred at ∼711.1 eV typical of Fe3+. A lower binding energy Fe 2p shoulder is also observed, indicating the Fe2+ species. The broad satellites centred at ∼714.5 and ∼719.1 eV are characteristic of Fe2+ and Fe3+ species, respectively. The O 1s spectrum (Fig. 3b) was deconvoluted into three peaks at around 529.8, 532.0 and 533.4 eV. The peak at 529.8 eV originates from the lattice oxygen of iron oxides, the intensity of which was enhanced upon calcination. The peaks at higher binding energies may correspond to O doubly (∼532.0 eV) and singly (∼533.4 eV) bound to carbon, consistent with the results derived from the C 1s spectra.
O), carbon bound to two oxygen atoms in carboxyls, carboxylic anhydrides and esters (i.e. –COO), respectively. The main graphitic C peak comprises ∼75% of the spectrum for the sample prior to calcining. Upon calcination, the graphitic C content decreased to ∼67% due to the mild oxidation of the C structure. Despite this, the value is still much higher than the one reported for graphene oxide (31% graphitic C).26 The Fe 2p3/2 region (Fig. S14c, ESI†) consists of a peak centred at ∼711.1 eV typical of Fe3+. A lower binding energy Fe 2p shoulder is also observed, indicating the Fe2+ species. The broad satellites centred at ∼714.5 and ∼719.1 eV are characteristic of Fe2+ and Fe3+ species, respectively. The O 1s spectrum (Fig. 3b) was deconvoluted into three peaks at around 529.8, 532.0 and 533.4 eV. The peak at 529.8 eV originates from the lattice oxygen of iron oxides, the intensity of which was enhanced upon calcination. The peaks at higher binding energies may correspond to O doubly (∼532.0 eV) and singly (∼533.4 eV) bound to carbon, consistent with the results derived from the C 1s spectra.
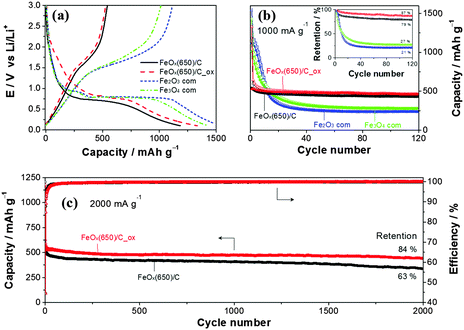
The performance of the composites was evaluated as active materials for LIBs in three-electrode half-cell configuration to ensure that the counter-electrode did not limit the electrochemical performance. Note that the carbon content was adjusted to be the same in all samples with addition of carbon black. Fig. 4a shows the potential profiles of commercial Fe3O4, Fe2O3, FeOx(650)/C and FeOx(650)/C_ox in the first electrochemical cycle between 3.0 and 0.1 V vs. Li/Li+. The lower cut-off potential was intentionally set to 0.1 V to increase the safety at high C-rates. All four samples displayed the characteristic behavior of Li-ion storage in iron oxides.4–6,8–17,21–25 The lower initial reversible capacity of both composites suggests the presence of metallic iron, which, together with the larger surface area, led to lower coulombic efficiency in the first cycle (Fig. S15, ESI†). Electrolyte additives, prelithiation or preactivation may be used to mitigate low coulombic efficiency in the first cycle.27–30 However, this issue is beyond the purpose of this work, which focuses on demonstrating the long cycle life achieved using the synthesized composites at high C-rates. At 1000 mA g−1, commercial iron oxide electrodes were unable to retain the reversible capacity (Fig. 4b), which was dropping below 50% after only 10 cycles. Indeed, the main limitation of iron oxides, even for the nanostructured ones (BET surface area of ca. 40 m2 g−1 for the commercial Fe2O3 and Fe3O4), is its short cycle life, especially at high C-rates. In contrast, both composites show excellent cycle life retaining 87% of the initial reversible capacity after 120 cycles. In addition, the coulombic efficiency of the composites after the first cycle outweighed those of the commercial ones indicating higher Li-ion storage reversibility of the composites. Even at 2000 mA g−1 (4C), both composites delivered remarkable electrochemical performance, e.g. FeOx(650)/C_ox (Fig. 4c) storage 445 mA h g−1 (84% retention) after 2000 cycles. The slightly higher capacity of the oxidized composite may be attributed to the lower metallic iron content, while the higher capacity retention after 2000 cycles (84% vs. 63%) could have resulted due to the removal of the low conducting amorphous carbon. To the best of our knowledge, FeOx(650)/C_ox delivers the best long term cyclability observed for iron oxide based electrodes at high C-rates comparable to the remarkable cycle life recently reported for FeOOH at 2.5C.31 Electrochemical impedance spectroscopy (EIS) revealed easy charge transfer for FeOx(650)/C_ox (Fig. S16, ESI†). In contrast to commercial iron oxides, the EIS spectra of FeOx(650)/C_ox did not evolve significantly upon cycling which was in good agreement with its excellent cyclability (more details in the ESI†). For comparison, commercial CNTs before and after oxidation (air-annealed at 300 °C) were tested (Fig. S17, ESI†). At 2000 mA g−1, both samples stored reversibly only ca. 130 mA h g−1 between 3.0 and 0.1 V. The electrochemical performances of composites prepared at 550 °C are also presented in the ESI† (Fig. S18 and S19). Here, the capacity retention of the oxidized samples decreased to 63% after 2000 cycles at 2000 mA g−1 (4C). The relatively lower graphitic character of the carbon coating obtained at 550 °C is likely responsible for the poorer electrochemical performance. The specific charge of FeOx(650)/C_ox was also evaluated at lower C-rates after prolonged cycling (Fig. S20, ESI†) revealing an excellent C-rate retention. The specific charge at 0.5C also shows that the average state of oxidation of Fe in FeOx is not +3, but lower. A value of X = 0.63 (+1.25) was electrochemically estimated (ESI†).
In conclusion, we showed that iron oxide based electrodes can operate at high C-rates and with long cycle life demonstrating the feasibility of using iron oxides as negative electrode materials for safer high-power Li-ion batteries. We synthesized carbon-coated FeOx/CNTs composites by controlled pyrolysis of ferrocene, which delivered a specific capacity retention of 84% (445 mA h g−1) after 2000 cycles at 2000 mA g−1 (4C).
Financial support from the Deutsche Forschungsgemeinschaft in the framework of the Cluster of Excellence RESOLV (EXC1069), the Beijing University of Chemical Technology (No. oic-201503005, buctrc201 and No. JD1505) and the Generalitat de Catalunya 2014 SGR 1638 is gratefully acknowledged.
References
- F. T. Wagner, B. Lakshmanan and M. F. Mathias, J. Phys. Chem. Lett., 2010, 1, 2204 CrossRef CAS.
- J. B. Goodenough and Y. Kim, Chem. Mater., 2010, 22, 587 CrossRef CAS.
- M. Fehse and E. Ventosa, ChemPlusChem, 2015, 80, 785 CrossRef CAS.
- H. Li, P. Balaya and J. Maier, J. Electrochem. Soc., 2004, 151, A1878 CrossRef CAS.
- P. Poizot, S. Laruelle, S. Grugeon, L. Dupont and J. M. Tarascon, Nature, 2000, 407, 496 CrossRef CAS PubMed.
- J. Cabana, L. Monconduit, D. Larcher and M. R. Palacín, Adv. Mater., 2010, 22, E170 CrossRef CAS PubMed.
- A. Barreiro, S. Hampel, M. H. Rümmeli, C. Kramberger, A. Grüneis, K. Biedermann, A. Leonhardt, T. Gemming, B. Büchner, A. Bachtold and T. Pichler, J. Phys. Chem. B, 2006, 110, 20973 CrossRef CAS PubMed.
- A. Brandt and A. Balducci, J. Power Sources, 2013, 230, 44 CrossRef CAS.
- D. Larcher, C. Masquelier, D. Bonnin, Y. Chabre, V. Masson, J. B. Leriche and J. M. Tarascon, J. Electrochem. Soc., 2003, 150, A133 CrossRef CAS.
- Y. NuLi, R. Zeng, P. Zhang, Z. Guo and H. Liu, J. Power Sources, 2008, 184, 456 CrossRef CAS.
- L. Zhang, H. B. Wu and X. W. Lou, Adv. Energy Mater., 2014, 4, 1300958 Search PubMed.
- W. M. Zhang, X. L. Wu, J. S. Hu, Y. G. Guo and L. J. Wan, Adv. Funct. Mater., 2008, 18, 3941 CrossRef CAS.
- Y. Piao, H. S. Kim, Y. E. Sung and T. Hyeon, Chem. Commun., 2010, 46, 118 RSC.
- J. E. Lee, S. H. Yu, D. J. Lee, D. C. Lee, S. I. Han, Y. E. Sung and T. Hyeon, Energy Environ. Sci., 2012, 5, 9528 CAS.
- C. M. Ban, Z. C. Wu, D. T. Gillaspie, L. Chen, Y. F. Yan, J. L. Blackburn and A. C. Dillon, Adv. Mater., 2010, 22, E145 CrossRef CAS PubMed.
- Z. Wang, D. Luan, S. Madhavi, Y. Hud and X. W. Lou, Energy Environ. Sci., 2012, 5, 5252 CAS.
- W. J. Yu, P. X. Hou, F. Li and C. Liu, J. Mater. Chem., 2012, 22, 13756 RSC.
- M. Lübke, N. M. Makwana, R. Gruar, C. Tighe, D. Brett, P. Shearing, Z. Liu and J. A. Darr, J. Power Sources, 2015, 291, 102 CrossRef.
- Z. Sun, K. Xie, Z. An Li, I. Sinev, P. Ebbinghaus, A. Erbe, M. Farle, W. Schuhmann, M. Muhler and E. Ventosa, Chem. – Eur. J., 2014, 20, 2022 CrossRef CAS PubMed.
- Z. Sun, E. Madej, C. Wiktor, I. Sinev, R. A. Fischer, G. van Tendeloo, M. Muhler, W. Schuhmann and E. Ventosa, Chem. – Eur. J., 2015, 21, 16154 CrossRef CAS PubMed.
- J. S. Chen, T. Zhu, X. H. Yang, H. G. Yang and X. W. Lou, J. Am. Chem. Soc., 2010, 132, 13162 CrossRef CAS PubMed.
- E. Kang, Y. S. Jung, A. S. Cavanagh, G. H. Kim, S. M. George, A. C. Dillon, J. K. Kim and J. Lee, Adv. Funct. Mater., 2011, 21, 2430 CrossRef CAS.
- N. Kang, J. H. Park, J. Choi, J. Jin, J. Chun, I. G. Jung, J. Jeong, J. G. Park, S. M. Lee, H. J. Kim and S. U. Son, Angew. Chem., Int. Ed., 2012, 51, 6626 CrossRef CAS PubMed.
- Z. Wang, L. Zhou and X. W. Lou, Adv. Mater., 2012, 24, 1903 CrossRef CAS PubMed.
- B. Wang, H. B. Wu, L. Zhang and X. W. Lou, Angew. Chem., Int. Ed., 2013, 52, 4165 CrossRef CAS PubMed.
- D. C. Marcano, D. V. Kosynkin, J. M. Berlin, A. Sinitskii, Z. Z. Sun, A. Slesarev, L. B. Alemany, W. Lu and J. M. Tour, ACS Nano, 2010, 4, 4806 CrossRef CAS PubMed.
- J. Hassoun, F. Croce, I. Hong and B. Scrosati, Electrochem. Commun., 2011, 13, 228 CrossRef CAS.
- J. Hassoun, M. Wachtler, M. Wohlfahrt-Mehrens and B. Scrosati, J. Power Sources, 2011, 196, 349 CrossRef CAS.
- S. Brutti, V. Gentili, H. Menard, B. Scrosati and P. G. Bruce, Adv. Energy Mater., 2012, 2, 322 CrossRef CAS.
- M. V. Reddy, G. V. Subba Rao and B. V. R. Chowdari, Chem. Rev., 2013, 113, 5364 CrossRef CAS PubMed.
- L. Yu, S. Xi, C. Wei, W. Zhang, Y. Du, Q. Yan and Z. C. Xu, Adv. Energy Mater., 2014, 140151 Search PubMed.
Footnote |
| † Electronic supplementary information (ESI) available. See DOI: 10.1039/c6cc00168h |
| This journal is © The Royal Society of Chemistry 2016 |


