 Open Access Article
Creative Commons Attribution 3.0 Unported Licence
In situ Raman spectroscopy of carbon-coated ZnFe2O4 anode material in Li-ion batteries – investigation of SEI growth†
Laura
Cabo-Fernandez
a,
Franziska
Mueller
bcd,
Stefano
Passerini
bc and
Laurence J.
Hardwick
*a
aStephenson Institute for Renewable Energy, Department of Chemistry, University of Liverpool, L69 7ZF, UK. E-mail: hardwick@liverpool.ac.uk
bHelmholtz Institute Ulm (HIU), Electrochemistry I, Helmholtzstrasse 11, 89081 Ulm, Germany
cKarlsruhe Institute of Technology (KIT), P.O. Box 3640, 76021 Karlsruhe, Germany
dInstitute of Physical Chemistry, University of Muenster, Corrensstrasse 28/30, 48149 Muenster, Germany
First published on 5th February 2016
Abstract
The (de)lithiation process of carbon-coated ZnFe2O4 has been investigated by in situ Raman spectroscopy. Solid electrolyte interphase (SEI) products were detected. Their detection may result from a temporary surface enhancement Raman effect from Zn nanoparticles formed in the conversion reaction at a potential that coincides with SEI formation.
Lithium-ion batteries (LIBs) are electrochemical energy storage devices with a high energy density, as well as lightweight and flexible in design. In addition to being used in widely within the electronic device industry, power tools, and progressively automotive applications, they are being investigated as a large scale stationary storage technology.1,2 However, it is necessary that even greater improvements in terms of power, safety, lifetime, and cost of the LIB are achieved for stationary energy storage applications.1 The chemical stability and the lithium-ion conductivity are influenced by the passivation layers formed on the electrode surface of LIBs. In particular, the solid electrolyte interphase (SEI) is a multicomponent electron insulator film formed on the anode surface once in contact with the organic-based electrolyte, which has a great influence upon irreversible charge loss, power capability, cycle of life and safety.3 It consists of a patchwork of insoluble inorganic species and organic layers formed by non-aqueous electrolyte reduction products that prevent further electrolyte decomposition, but crucially still permit Li+ transport.3,4 Therefore, it is essential to understand the processes that occur at the electrode/electrolyte interfaces to improve the efficiency of LIBs.
ZnFe2O4 (ZFO) is a non-toxic and cheap anode material for LIBs with a high specific theoretical capacity of ca. 1000 mA h g−1,5,6 as a result of an alloying conversion reaction.7
| ZnFe2O4 + xLi+ + xe− → LixZnFe2O4 | (1) |
| LixZnFe2O4 + (8 − x)Li+ + (8 − x)e− → Zn0 + 2Fe0 + 4Li2O | (2) |
| Zn0 + Li+ + e− ↔ LiZn | (3) |
| Zn0 + 2Fe0 + 4Li2O ↔ ZnO + Fe2O3 + 8Li+ + 8e− | (4) |
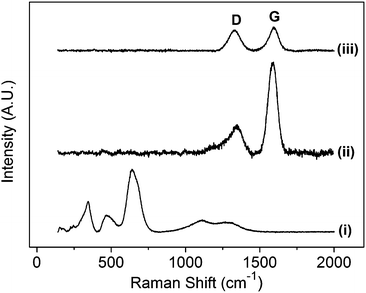
A spinel ZnFe2O4 material has five first order active Raman modes (A1g + Eg + 3F2g).8 The spectrum of the powder presents peaks at 340, 467, 647, 1098 and 1280 cm−1 (Fig. 1(i)). The peaks at 340 and 467 cm−1 are assigned to 2F2g modes and 647 cm−1 is assigned to A1g symmetry. The other two modes at 221 cm−1 (F2g) and 246 cm−1 (Eg) are not observed clearly above the signal to noise ratio within the spectrum. The peaks observed at 1098 and 1280 cm−1 are suspected to be overtone bands.
ZnFe2O4 peaks are absent in the spectrum of the sample after the carbon coating step with a sucrose precursor (Fig. 1(ii)), which is in agreement with a previous report.9 Only two bands are observed at 1347 and 1586 cm−1 that are assigned to the characteristic carbon D and G bands, respectively.10,11 The D band (A1g mode) results from a break in the symmetry at the edges or defects in graphene sheets.10–12 The G band assigned to the E2g2 mode is related to the C–C stretching mode within the hexagonal lattice.10
The intensity ratio of the D and G peaks is sensitive to the type and order of the carbon material.11 In the present study, it is possible to distinguish the signal that corresponds to the carbon coating and that of the carbon additive (Fig. 1(iii)); the D/G peak intensity ratio for ZFO–C and carbon black are 0.32 and 0.86, respectively. Thereby, a clear differentiation between the two different types of carbon from Raman analysis of the composite electrode allowed precise monitoring of ZFO–C only rather than the carbon black conductive additive.
In situ Raman spectroscopy of ZFO–C film electrodes was performed in a three-electrode Raman cell containing 1 M LiPF6 in the 1![[thin space (1/6-em)]](https://www.rsc.org/images/entities/char_2009.gif) :
:![[thin space (1/6-em)]](https://www.rsc.org/images/entities/char_2009.gif) 1 w/w EC/DMC electrolyte. The electrode and cell preparations are described in the ESI.†
1 w/w EC/DMC electrolyte. The electrode and cell preparations are described in the ESI.†
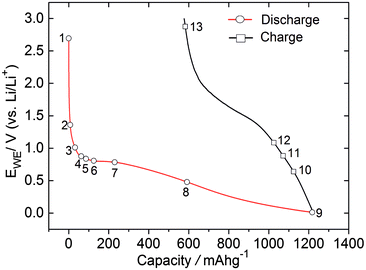
The potential profile of the ZFO–C electrode during the first discharge–charge cycle is shown in Fig. 2. The maximum capacity at the end of the discharge process is 1221 mA h g−1 which is in agreement with previous studies and with the reactions described in eqn (1)–(3).5,13 This value is similar to the capacity obtained for the uncoated ZFO film electrode (Fig. S1 in the ESI†). The Raman spectrum collected at the open-circuit potential (OCP), shown in Fig. 3, presents peaks associated with the electrolyte at 518, 717, 742, 893, 904 and 910 cm−1 (Fig. S2 in the ESI†),14,15 in addition to D (1347 cm−1) and G (1590 cm−1) peaks. Lithiation also occurs in the carbon coating, evidenced by the weakened D and G peaks, as the discharge reaction proceeds. These bands disappear into the background at potentials lower than 0.2 V, and rise again during the charging of the cell at potentials above 0.64 V (spectrum 10) in agreement with previous reports for graphite.12 Raman data also highlight the fact that the carbon shell remains mechanically intact after the first discharge–charge cycle, as the ZFO band at 647 cm−1 is not observed after completion of the first de-lithiation step. A decrease in the peak intensity of the D and G bands is observed, when compared to the spectrum at OCP, suggesting that the de-lithiation step was not completely reversible and the part of lithium may still be trapped within the carbon shell. The D/G intensity ratio is increased from 0.32 to 1.12, thus the (de)lithiation steps result in an increase in the disorder of the carbon coating.
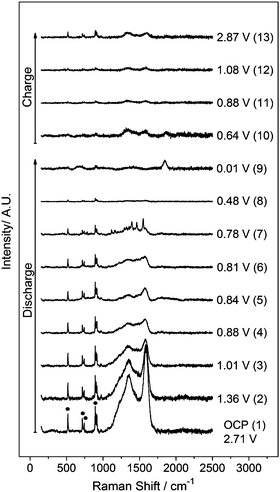 | ||
Fig. 3
In situ Raman spectra of the ZFO–C electrode collected at different stages of the discharge and charge cycles in 1 M LiPF6 in the 1![[thin space (1/6-em)]](https://www.rsc.org/images/entities/char_2009.gif) : :![[thin space (1/6-em)]](https://www.rsc.org/images/entities/char_2009.gif) 1 w/w EC/DMC electrolyte. Labels: ● electrolyte peaks. 1 w/w EC/DMC electrolyte. Labels: ● electrolyte peaks. | ||
The conversion reaction described in eqn (2) occurs during the discharge plateau at around 0.80 V (see Fig. 2).7 This process leads to the destruction of the ZFO structure with the formation of metallic zinc and iron particles in a Li2O matrix. The zinc is then alloyed with lithium at more negative potentials (eqn (3)).7,16 Additional sharp peaks arise at 1118, 1163, 1292, 1319, 1357, 1395, 1463 and 1551 cm−1 in the Raman spectra collected between 0.80 V and 0.69 V. These bands are related to the reduction products of the carbonate solvents that formed the SEI on the carbon coating as explained later in more detail. These peaks associated with the SEI products are absent in the spectra collected during in situ measurements of the uncoated ZFO electrode as shown in Fig. S1 (in the ESI†). The explanation for this may be the different electrode/electrolyte interface, since the nanoparticles are not encapsulated in a carbon matrix. For ZFO–C only a band at approximately 1850 cm−1 is observed at potentials lower than 0.69 V. A peak associated with Li2C2 has been previously reported at this wavenumber position.17,18 This peak is observed up to 0.64 V in the charge process, the potential at which the D and G bands re-appear in the spectra.
The SEI is comprised of organic and inorganic electrolyte decomposition products.4 Some of the organic compounds detected on carbon materials are lithium alkyl carbonate species (ROCO2Li) and polymeric species (e.g. polyethylene oxide).4,19
Polyethylene glycol/oxide powders with different molecular weights (PEG-1000, PEO-100k and PEO-1 M) have been studied by Raman spectroscopy to investigate the origin of the peaks observed during the discharge of the ZFO–C electrode between 0.80 and 0.69 V (Fig. 4). The peak analysis for PEO materials and the ZFO–C electrode at 0.78 V are presented in Table 1. There is a spectrum dependence on the chain length within the 800–1000 cm−1 region that corresponds to CH2 rocking and wagging coupled with C–O, C–C and C–O–C stretching vibrations.20 The intensity of the peak at 840 cm−1 increases relative to the intensity of the band at 860 cm−1 as the average molecular weight increases. These peaks are related to the CH2 rocking and combined CO stretching/CH2 rocking, respectively.20 There is a broadening in the spectrum background for PEO-1 M in the region from 700 to 1000 cm−1.
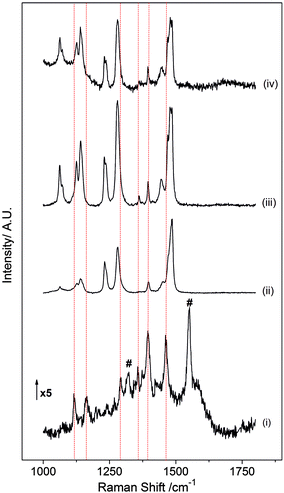 | ||
Fig. 4 Raman spectra of (i) the ZFO–C electrode discharged at 0.78 V and polyethylene oxide materials (ii) PEG (av. Mw = 1000), (iii) PEO (av. Mw = 100![[thin space (1/6-em)]](https://www.rsc.org/images/entities/char_2009.gif) 000) and (iv) PEO (av. Mw = 1 000) and (iv) PEO (av. Mw = 1![[thin space (1/6-em)]](https://www.rsc.org/images/entities/char_2009.gif) 000 000![[thin space (1/6-em)]](https://www.rsc.org/images/entities/char_2009.gif) 000). 000). | ||
| PEG-1000 | PEO-100![[thin space (1/6-em)]](https://www.rsc.org/images/entities/char_2009.gif) 000 000 |
PEO-1![[thin space (1/6-em)]](https://www.rsc.org/images/entities/char_2009.gif) 000 000![[thin space (1/6-em)]](https://www.rsc.org/images/entities/char_2009.gif) 000 000 |
ZFO–C electrode (discharge E = 0.78 V) | ||||
|---|---|---|---|---|---|---|---|
| Peak | FWHM | Peak | FWHM | Peak | FWHM | Peak | FWHM |
| a Coupled C–C stretching/CH2 wagging.20 b Coupled C–C/C–O–C stretching.20 c Twisting (CH2) asymmetric.21 d Bending (CH2) asymmetric.21 | |||||||
| 1125a | 21 | 1125a | 10 | 1125a | 13 | 1118 | 7 |
| — | — | 1142b | 13 | 1142b | 14 | 1163 | 10 |
| 1281c | 14 | 1280c | 13 | 1281c | 11 | 1292 | 9 |
| — | — | 1361 | 6 | — | — | 1357 | 12 |
| 1397 | 9 | 1395 | 5 | 1395 | 6 | 1395 | 14 |
| 1476d | 19 | 1445d | 11 | 1445d | 16 | 1463 | 13 |
The spectrum collected at 0.78 V during the discharge cycle presents peaks at 1118, 1163, 1292, 1357, 1395 and 1463 cm−1 that can be related to PEG–PEO peaks at 1125, 1142, 1281, 1361, 1395 and 1445 cm−1. The peak shifts in the in situ spectra with respect to PEG–PEO powders could be explained by complexation with lithium cations in the electrolyte salt during cycling. The peak observed at 1357 cm−1 related to the PEO band at 1361 cm−1 is only present in the spectrum for PEO-100k, indicating that the polyethylene species formed on the electrode surface may have an average molecular weight in the order of 100k.
One of the main peaks for polyethylene oxide materials appear at 1480 cm−1 with a shoulder at 1469 cm−1 assigned to the CH2 scissor mode.20 In the discharge curve only the shoulder is observed at 1461 cm−1. Two peaks at 1319 and 1551 cm−1 are not present in PEO materials (Fig. 4, #). However, symmetric C![[double bond, length as m-dash]](https://www.rsc.org/images/entities/char_e001.gif) O stretching in (CH2OCO2Li)2 and asymmetric C
O stretching in (CH2OCO2Li)2 and asymmetric C![[double bond, length as m-dash]](https://www.rsc.org/images/entities/char_e001.gif) O mode for RCOOLi compounds have been reported in SEI studies using FTIR.4 Therefore, we tentatively assign these peaks to the lithium alkyl carbonate species that have been widely observed in previous SEI studies.4 These peaks have also been observed in the spectra collected on a ZFO–C particle when the potential was held at different potentials (chronoamperometric methods) as shown in Fig. S3 and S4 (in the ESI†).
O mode for RCOOLi compounds have been reported in SEI studies using FTIR.4 Therefore, we tentatively assign these peaks to the lithium alkyl carbonate species that have been widely observed in previous SEI studies.4 These peaks have also been observed in the spectra collected on a ZFO–C particle when the potential was held at different potentials (chronoamperometric methods) as shown in Fig. S3 and S4 (in the ESI†).
The conversion reaction in eqn (2) leads to the formation of zinc and iron nanoparticles. This reaction occurs approximately at 0.8 V.7,16 The presence of Zn nanoparticles may enhance the Raman signal, explaining the observation of the peaks for the SEI components between 0.80 and 0.69 V. The effect of Zn nanoparticles in surface-enhancement Raman scattering (SERS) has been described by Yang et al. in TiO2 nanoparticles doped with Zn.22 The disappearance of the peaks at potentials below 0.69 V could be explained by the formation of LiZn alloys in accordance with eqn (3) and/or the increase of the SEI thickness. This is schematically shown in Scheme 1. Di Cicco et al. have estimated the SEI thickness for the ZFO–C material using soft X-ray spectroscopy (XAS).13 In accordance with the thickness calculations as a function of the capacity, the SEI would be approximately 34 nm thick at 0.69 V and this thickness could inhibit the SERS effect.
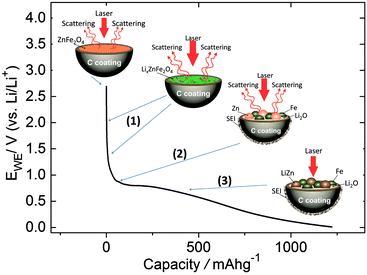 | ||
| Scheme 1 Representation of the scattering phenomenon of ZFO–C during conversion-alloying reaction in the lithiation process at different potentials. | ||
Although the active material is encapsulated inside a 2 nm-carbon shell (Fig. S5 in ESI†), the Raman enhancement by Zn nanoparticles is still observed. This phenomenon could be considered analogous to shell-isolated nanoparticle enhanced Raman spectroscopy (SHINERS). In this technique, the amplification of the signal is produced by gold nanoparticles with an ultrathin silica shell deposited on the substrate.23 Furthermore, a similar Raman enhancement showing PEO-type films has been observed on carbon-coated ZnO electrodes (Fig. S6 in the ESI†).
In conclusion, carbon-coated ZFO has been investigated by in situ Raman spectroscopy during the first discharge–charge. The Raman spectrum of ZFO–C nanoparticles only presents the D and G bands related to the homogeneous carbon coating. The in situ Raman spectra show that the lithiation occurs not only in ZFO nanoparticles, but also in the carbon coating. As a consequence of this, the D and G bands disappear at potentials lower than 0.2 V and they re-appear during the charging step at potentials higher than 0.64 V.
The carbon coating remains mechanically intact after the first cycle; however, the D and G peak intensity is lower, indicating that the de-lithiation is not fully reversible and lithium ions remain trapped in the carbon matrix. The D/G intensity ratio is also larger, suggesting an increase in the disorder of the coating after the first (de)lithiation process.
SEI components on the carbon coating were assigned from the Raman data as the polyethylene oxide type and organic alkyl carbonate species. The observation of these compounds may be due to the SERS effect from the Zn nanoparticles formed from the conversion reaction during the lithiation process.
The support of the European Commission under the Project “Stable Interfaces for Rechargeable Batteries” (SIRBATT) (FP7-ENERGY-2013, grant agreement no. 608502) is gratefully acknowledged.
Notes and references
- B. Dunn, H. Kamath and J.-M. Tarascon, Science, 2011, 334, 928–935 CrossRef CAS PubMed
.
- J.-M. Tarascon and M. Armand, Nature, 2001, 414, 359–367 CrossRef CAS PubMed
.
- E. Peled, J. Electrochem. Soc., 1979, 126, 2047–2051 CrossRef CAS
.
- P. Verma, P. Maire and P. Novák, Electrochim. Acta, 2010, 55, 6332–6341 CrossRef CAS
.
- D. Bresser, E. Paillard, R. Kloepsch, S. Krueger, M. Fiedler, R. Schmitz, D. Baither, M. Winter and S. Passerini, Adv. Energy Mater., 2013, 3, 513–523 CrossRef CAS
.
- Y. Ding, Y. Yang and H. Shao, Electrochim. Acta, 2011, 56, 9433–9438 CrossRef CAS
.
- A. S. Hameed, H. Bahiraei, M. V. Reddy, M. Z. Shoushtari, J. J. Vittal, C. K. Ong and B. V. R. Chowdari, ACS Appl. Mater. Interfaces, 2014, 6, 10744–10753 CAS
.
- Z. Wang, D. Schiferl, Y. Zhao and H. S. C. O'Neill, J. Phys. Chem. Solids, 2003, 64, 2517–2523 CrossRef CAS
.
- F. Mueller, D. Bresser, E. Paillard, M. Winter and S. Passerini, J. Power Sources, 2013, 236, 87–94 CrossRef CAS
.
- R. Baddour-Hadjean and J. P. Pereira-Ramos, Chem. Rev., 2010, 110, 1278–1319 CrossRef CAS PubMed
.
- Y. Wang, D. C. Alsmeyer and R. L. McCreery, Chem. Mater., 1990, 2, 557–563 CrossRef CAS
.
- C. Sole, N. E. Drewett and L. J. Hardwick, Faraday Discuss., 2014, 172, 223–237 CAS
.
- A. Di Cicco, A. Giglia, R. Gunnella, S. L. Koch, F. Mueller, F. Nobili, M. Pasqualini, S. Passerini, R. Tossici and A. Witkowska, Adv. Energy Mater., 2015, 5 DOI:10.1002/aenm.201500642
.
- B. Fortunato, P. Mirone and G. Fini, Spectrochim. Acta, Part A, 1971, 27, 1917–1927 CrossRef CAS
.
- J. E. Katon and M. D. Cohen, Can. J. Chem., 1975, 53, 1378–1386 CrossRef CAS
.
- F. Martinez-Julian, A. Guerrero, M. Haro, J. Bisquert, D. Bresser, E. Paillard, S. Passerini and G. Garcia-Belmonte, J. Phys. Chem. C, 2014, 118, 6069–6076 CAS
.
- R. Schmitz, R. Ansgar Müller, R. Wilhelm Schmitz, C. Schreiner, M. Kunze, A. Lex-Balducci, S. Passerini and M. Winter, J. Power Sources, 2013, 233, 110–114 CrossRef CAS
.
- R. Schmitz, R. Müller, S. Krüger, R. W. Schmitz, S. Nowak, S. Passerini, M. Winter and C. Schreiner, J. Power Sources, 2012, 217, 98–101 CrossRef CAS
.
- A. M. Andersson, A. Henningson, H. Siegbahn, U. Jansson and K. Edström, J. Power Sources, 2003, 119–121, 522–527 CrossRef CAS
.
- S. K. Chaurasia, R. K. Singh and S. Chandra, Vib. Spectrosc., 2013, 68, 190–195 CrossRef CAS
.
- B. L. Papke, M. A. Ratner and D. F. Shriver, J. Phys. Chem. Solids, 1981, 42, 493–500 CrossRef CAS
.
- L. B. Yang, Y. Zhang, W. D. Ruan, B. Zhao, W. Q. Xu and J. R. Lombardi, J. Raman Spectrosc., 2010, 41, 721–726 Search PubMed
.
- J. Feng Li, Y. Fan Huang, Y. Ding, Z. Lin Yang, S. Bo Li, X. Shun Zhou, F. Ru Fan, W. Zhang, Z. You Zhou, D. Yin Wu, B. Ren, Z. Lin Wang and Z. Qun Tian, Nature, 2010, 464, 392–395 CrossRef PubMed
.
Footnote |
| † Electronic supplementary information (ESI) available: Experimental details and further in situ Raman investigation of ZnFe2O4–C, uncoated ZnFe2O4 and ZnO–C, the Raman spectrum of 1 M LiPF6 in the EC/DMC electrolyte and the TEM image of ZnFe2O4–C. See DOI: 10.1039/c5cc09350c |
| This journal is © The Royal Society of Chemistry 2016 |

