
 Open Access Article
 This Open Access Article is licensed under a Creative Commons Attribution-Non Commercial 3.0 Unported Licence
Simultaneous characterization of protein–material and cell–protein interactions using dynamic QCM-D analysis on SAM surfaces†
Keiichiro
Kushiro
,
Chih-Hao
Lee
and
Madoka
Takai
*
Department of Bioengineering, School of Engineering, The University of Tokyo, 7-3-1 Hongo, Bunkyo-ku, Tokyo 113-8656, Japan. E-mail: takai@bis.t.u-tokyo.ac.jp; Fax: +81 3 58410621; Tel: +81 3 58417125
First published on 29th April 2016
Abstract
Understanding the interactions among materials, proteins and cells is critical for the development of novel biomaterials, and establishing a highly sensitive and quantitative method to standardize these interactions is desired. In this study, quartz crystal microbalance with dissipation (QCM-D) combined with microscopy was utilized to quantitatively monitor the entirety of the cell adhesion processes, starting from the protein adsorption, on various self-assembled monolayer (SAM) surfaces. Although the resulting cell adhesion morphologies were similar on most of the surfaces, the dynamic QCM-D signal patterns were unique on each surface, suggesting different forms of material–protein–cell interactions. The viscoelasticity and the density of the surface-adsorbed fibronectin (FN), as well as the relative exposure of the cell adhesive arginine-glycine-aspartic acid (RGD) motifs, were correlated to the different cell adhesion dynamics and mechanics. Some surfaces exhibited complicated behaviors alluding to the detachment/rearrangement of surface proteins or highly sparse but bioactive proteins that promote a slow adhesion process. This study underscores the potential use of the QCM-D signal pattern as a rule of thumb for delineating different protein–material and cell–protein interactions, and offers a rapid in vitro platform for the dynamic evaluation of protein and cell behaviors on novel biomaterials.
1. Introduction
To have better control over biological responses on synthetic surfaces, understanding the relationship among proteins, cells and material surfaces has been an important issue in the development of biomaterials.1–5 For example, the adsorption of plasma proteins onto the implant surface is the initiating event for most host responses when an artificial material is introduced into the human body, and it will induce physiological responses such as thrombus formation, inflammatory responses and immune responses. Likewise, cells do not adhere directly to the bare material surfaces, but through plaques of surface-adsorbed proteins. Therefore, understanding the material–protein–cell interactions, as well as the properties of the surface-adsorbed proteins, is crucial for manipulating the host responses to a biomaterial.In previous research studies, it has been shown that a variety of physicochemical properties of the material surface can alter the state of the surface-adsorbed proteins. For example, it was reported that the amount of adsorbed proteins is related to the surface wettability6–8 and that the biological activity of the surface-adsorbed FN is altered by the chemical functional groups on the substrate surface.9,10 Recent studies have also shown that the number and spreading area of the adhered cells are modulated by the wettability and the chemical properties of the underlying substrate.11 However, there is still no consensus on the separate relevance of the material surface properties involved, and the mechanism underlying these phenomena is still unclear.
The use of QCM-D to measure the mass and viscoelastic properties of the attached substance in the liquid phase has provided insights into these processes. For protein analysis, the information about the viscoelastic properties of the adsorbed protein layer has enabled investigations on protein conformation changes.12,13 For cell studies, QCM-D has the advantage of enabling non-invasive, real-time in situ analyses, in addition to its ability to dynamically monitor the entire adhesion process. Although there are a variety of methods available for studying cell adhesion, for example, direct cell counting, morphological observation via optical or fluorescence microscopy, and the investigation of cell adhesion force via centrifugation,14–17 these methods are rather time-consuming and relatively subjective in nature and may incur cell damage. Meanwhile, early cell studies using QCM reported that changes in frequency (Δf) are positively correlated with cell number18 and surface coverage.19 Other research studies confirmed that a variety of events could be detected by QCM-D, including changes in cell morphology,20 cytoskeletal changes and remodelling,21,22 and ECM remodelling.23 For example, using a reagent that inhibits the endogenous production of ECM molecules, Lord et al. investigated the adhesion behaviours of treated and untreated NIH3T3 fibroblasts.23 Despite using the same morphology, a unique QCM-D response dominated by the process of ECM remodelling was observed in the untreated cells. Thus, it was demonstrated that QCM-D is capable of detecting subtle changes that are otherwise not distinguishable from just the cell morphology.
In this study, using the highly sensitive and quantitative QCM-D, we systematically analysed the influence of chemical functional groups on protein adsorption and the subsequent cell adhesion to further clarify and quantitatively characterize the different protein–material and cell–protein interactions. SAM of alkanethiol derivatives were used to create well-defined chemical functional groups on gold surfaces. The cell morphology on the fabricated surfaces was observed via immunostaining, and the biological activity of the surface-adsorbed FN was investigated using the enzyme-linked immunosorbent assay (ELISA). Furthermore, the use of QCM-D enabled dynamic, in situ analyses of the FN adsorption and L929 adhesion processes in series. Not only information about the viscoelastic properties of the surface-adsorbed FN was acquired from QCM-D, but also the different patterns of QCM-D signal changes were observed among the various surfaces during L929 adhesion. From further analyses and comparisons, it was suggested that the different patterns of QCM-D signal changes are unique signatures of protein adsorption and cell adhesion behaviours modulated by the various chemical functional groups on the material surface. Accordingly, the quantitative use of characteristic features of QCM-D ΔD–Δf plots (i.e., patterns of QCM-D signal changes) as a generalized rule of thumb for in vitro characterizations of material–protein–cell interactions was demonstrated in this study.
2. Materials and methods
2.1 Fabrication of the SAM surfaces and characterization
Five different kinds of surfaces were used in this study. The silica (SiO2)-coated QCM-D sensor crystals were used as received as a standard surface and a negative control, respectively. SAMs with terminal methyl (–CH3), hydroxyl (–OH), carboxyl (–COOH) and amino (–NH2) groups were created on Au-sputtered glass slides (30 nm Au/2 nm Cr/SiO2) to represent hydrophobic, hydrophilic, negatively charged and positively charged surfaces, respectively. Microscope slides (S1112, Matsunami) were cut into small pieces (10 mm × 26 mm), and 2 nm Cr and 30 nm Au were sputtered in turn on the surface of the slide pieces via a radio-frequency magnetron sputtering system (SCOTT-C3, Ulvac Kiko, Inc.). After 5 min of O2-plasma cleaning, Au-coated QCM-D sensor crystals or Au-sputtered glass slides (30 nm Au/2 nm Cr/SiO2) were immersed in 1 mM ethanol solutions of the reagents (Table 1) for 12 h. The substrates were then collected, rinsed and vacuum-dried for 12 h. Surface elemental composition of the fabricated surfaces was confirmed by X-ray photoelectron spectroscopy (XPS) (JPS-9010, JEOL) with a 60° incline (target: Mg). Charge corrections were applied for better comparisons. The wettability was evaluated by static contact angles of air in water (Table 1).| Reagents | Static contact angle of air in water (°) | |
|---|---|---|
| SiO2 | — | 155 ± 4 |
| CH3-SAM | 1-Dodecanethiol | 97 ± 4 |
| OH-SAM | 11-Mercapto-1-undecanol | 143 ± 12 |
| COOH-SAM | 11-Mercaptoundecanoic acid | 143 ± 2 |
| NH2-SAM | 11-Amino-1-undecanethiol | 147 ± 2 |
2.2 Immunostaining
Au-sputtered coverslips (9 nm Au/2 nm Cr/SiO2), for which the homogeneous thin gold coating was confirmed by XPS (data not shown), were used as substrates, and SAM carrying different terminal chemical functional groups were created as described above. After 1 h of pre-incubation in a fibronectin (FN) solution (fibronectin from human plasma, Sigma-Aldrich), the substrates were incubated at 37 °C for 3 h in an L929 suspension at 4.0 × 10⁵ cells per mL in serum-free medium (SFM), which is high glucose DMEM (Gibco®, Life Technologies) supplemented only with 1% penicillin–streptomycin (Gibco®, Life Technologies). The samples were then rinsed with phosphate-buffered saline (PBS) (Gibco®, Life Technologies), fixed with 10% formalin at room temperature for 20 min, permeabilized with 0.2 wt% Triton X-100 at 4 °C for 10 min, and blocked with 1 wt% bovine serum albumin (BSA) in PBS for 2 h. To label paxillin, the samples were immersed in turn in 10 μg mL−1 rabbit monoclonal antibody against paxillin (ab32084, Abcam) at 4 °C for 12 h and 10 μg mL−1 Alexa Fluor® 488-tagged goat anti-rabbit IgG (H + L) antibody (A11008, Life Technologies) at room temperature for 1 h. Afterwards, actin filaments and nuclei were stained with Alexa Fluor® 594 phalloidin (Life Technologies) for 20 min and DAPI (Life Technologies) for 10 min at room temperature, respectively. The substrates were washed 3 times with 1 wt% BSA in PBS between all the steps. The samples were observed using a confocal microscope (Axio Observer Z1 LSM510, Carl Zeiss).2.3 QCM-D measurements
FN adsorption and L929 adhesion were analysed using a customized QCM-D system (QWiC 301, Q-Sense AB, Sweden) that utilizes a window chamber, a temperature-controlled outer box and a LED light source for microscopy to prevent heat-derived extrinsic noise. This setup, as shown in a previous study,17 enables the cells on the QCM-D sensors to behave identically to those under normal, incubated culture conditions. Sensor crystals were mounted in the window chamber maintained at 37 °C, and changes in frequency (Δf) and energy dissipation (ΔD) were recorded during the whole process. The fundamental resonance frequency was 4.95 MHz and the data presented here are those of the 7th overtone. After stabilization, 10 μg mL−1 FN in PBS was injected, and the adsorption took place for 1 h. Then the chamber was rinsed and stabilized with PBS and SFM in turn for 5 min each. Afterwards, a L929 suspension at 4.0 × 10⁵ cells per mL in SFM was injected at 100 μL min−1, and cells were allowed to adhere for 3 h. Cell morphologies were observed every 30 min by simultaneous microscopy. The quantitative figures were extracted for each phase at time points when the QCM-D signals were stabilized.2.4 ELISA measurements of the relative RGD exposure
The exposure ratio of the cell-binding RGD motif in the surface-adsorbed FN was investigated via ELISA. After 1 h incubation in 10 μg mL−1 FN solution at 37 °C, the substrates were equipped onto the ProPlate® slide module (16 round wells) and blocked with Blocking One (Nacalai Tesque, Inc.) solution for 1 h at room temperature. Then the substrates were reacted in turn with 0.5 μg mL−1 of anti-fibronectin (specifically at the cell-binding site) antibody (ab64713, Abcam) for 1 h and 2 μg mL−1 of HRP-tagged goat anti-mouse IgG-Fc (ab97265, Abcam) for 2 h. Finally, the substrates were reacted with TMB One Component HRP Microwell Substrate (SurModics) for 5 min, and the absorbance at 450 nm was measured. The substrates were rinsed 5 times with 0.05 wt% Tween® 20 (Sigma-Aldrich) in PBS between all the steps.3. Results and discussion
3.1 Surface elemental composition characterization using XPS
In order to characterize the substrate material, the elemental compositions of the SAM surfaces were analysed with XPS (Fig. 1). High C peaks were observed for the four SAM surfaces at peak values around 284 eV. This indicates the presence of a C–C single bond on the surfaces. For O (1s), a prominent peak at 531 eV was observed on the bare glass surface, which is typical for the O in SiO2. On the SAM substrates, small O peaks were observed, mainly on the COOH-SAM surface and the OH-SAM surface around 534 eV, corresponding to the O atom in the –C–O– groups. For N (1s), a small N peak was observed on the NH2-SAM surface at 398 eV, confirming the presence of the –NH2 functional groups on the surface.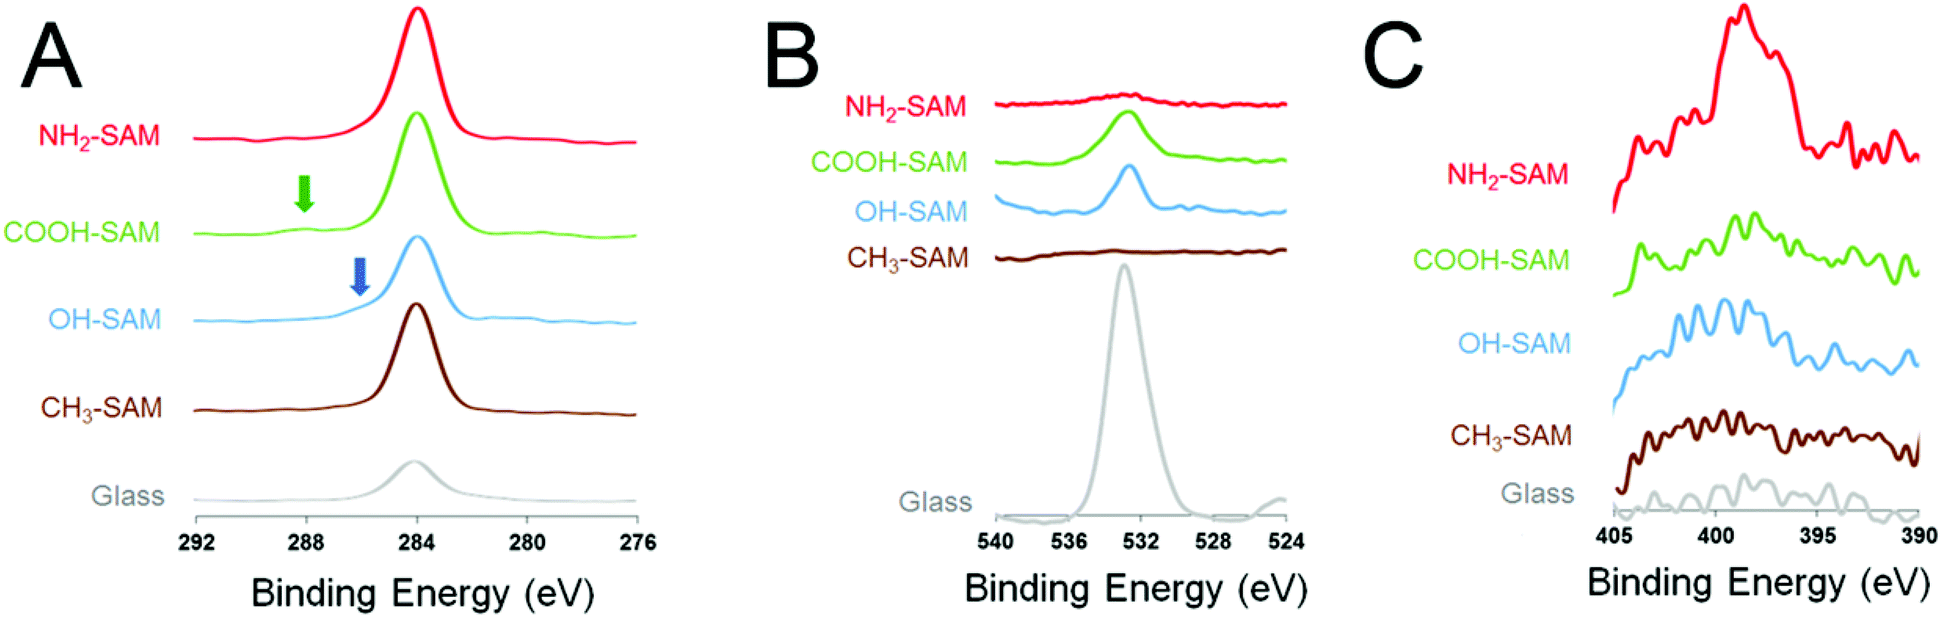 | ||
| Fig. 1 Results of XPS for the various SAM surfaces: (A) C (1s), (B) O (1s) and (C) N (1s). Arrows indicate chemical shifts. | ||
3.2 Cell morphology characterization through immunostaining
Immunostaining was performed on the L929 cells seeded on the various surfaces for 3 h to characterize the cell morphology (Fig. 2). Cells on the SiO2 surface were round and small, and little actin filament bundling and paxillin were observed. In contrast, cells on the CH3-, OH-, COOH- and NH2-SAM surfaces were clearly spread, exhibiting more actin filament and paxillin. This L929 spreading behaviour is similar to that observed with other cell types on similar SAM surfaces.9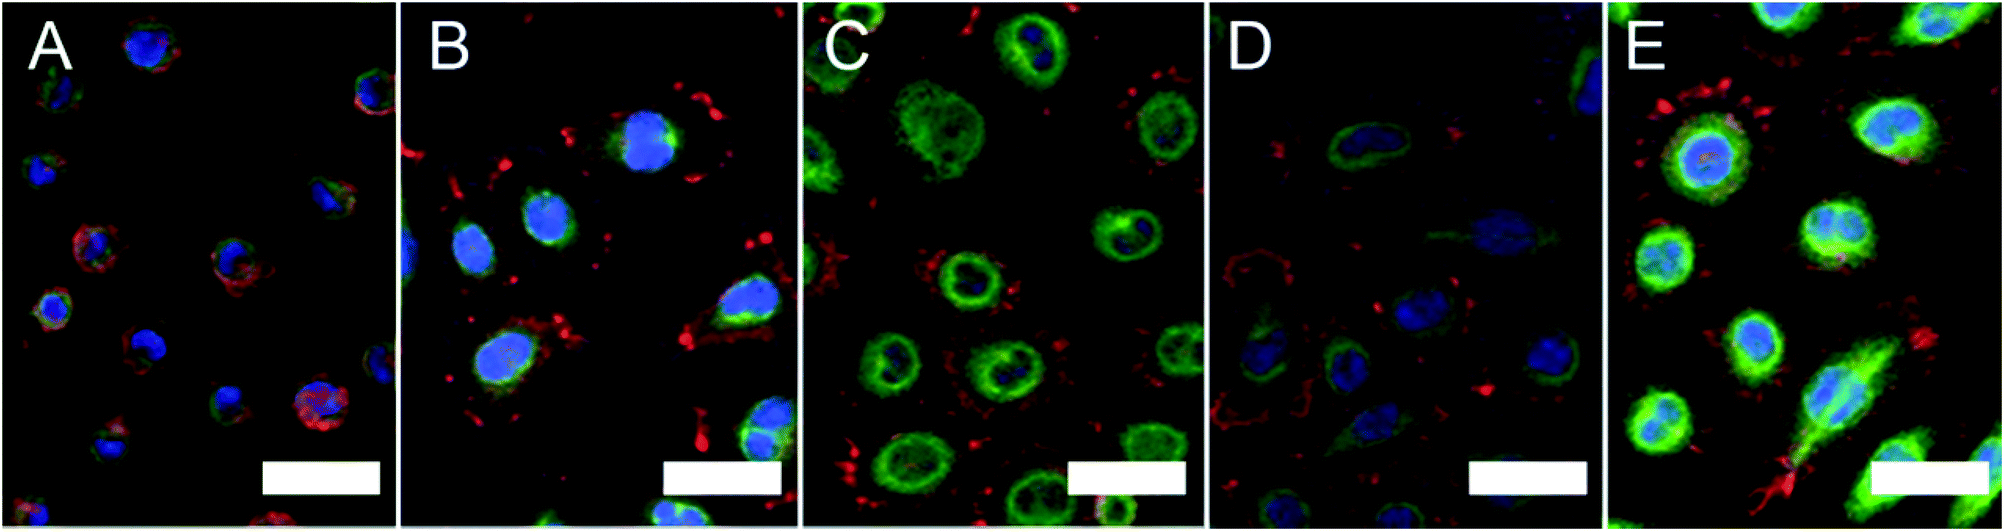 | ||
| Fig. 2 Immunostaining images of L929 on the (A) SiO2, (B) COOH-SAM, (C) OH-SAM, (D) CH3-SAM and (E) NH2-SAM surfaces (red: actin filament, green: paxillin, blue: nucleus) (scale bar: 30 μm). | ||
By image processing, the spreading area and circularity of the adhered cells were calculated (Table 2). Cells on the NH2-SAM surface exhibited the largest spreading area and cells on the SiO2 surface exhibited the smallest, suggesting that the cells on the NH2-SAM surface had the largest degree of cell adhesion while the cells on the SiO2 surface did not adhere well. Meanwhile, circularity is the measure of how closely the shape of an object approaches that of a circle, and in the case of cells, it is indicative of the degree of polarization of the adhered cells. The SiO2 and OH-SAM surfaces exhibited the closest value of circularity to 1 (which is the circularity for a true circle) and the CH3-SAM surface the farthest. This implies that the cells on the SiO2 and OH-SAM surfaces exhibited the least degree of polarization, while the cells on the CH3-SAM surface exhibited the most.
| Spreading area (μm2) | Circularity (—) | |
|---|---|---|
| SiO2 | 206 ± 35 | 0.89 ± 0.05 |
| CH3-SAM | 584 ± 118 | 0.65 ± 0.18 |
| OH-SAM | 638 ± 124 | 0.89 ± 0.05 |
| COOH-SAM | 701 ± 157 | 0.75 ± 0.14 |
| NH2-SAM | 857 ± 241 | 0.83 ± 0.14 |
3.3 Protein adsorption characterization using QCM-D
The entire processes of FN adsorption and L929 adhesion were analysed via QCM-D in series, and signal changes (i.e., changes in Δf and ΔD) during these processes were recorded. For the process of FN adsorption, the adsorption density on each surface was obtained, and a specific ΔD/Δf value (which is the slope of the ΔD–Δf plot) was calculated for each surface from the QCM-D data (Table 3). The overall trend of protein adsorption densities was similar to previous studies on SAM, and the high FN densities above 350 ng cm−2 observed on all the surfaces suggest that these surfaces were almost fully covered with FN, based on the previous studies.24,25 Also, it has been reported in previous research studies that the conformation of the surface-adsorbed FN can be altered by the physicochemical properties of the underlying substrate surface, such as wettability and surface roughness.26,27 Likewise, the different ΔD/Δf values observed among the various surfaces in this experiment might suggest different conformations of the adsorbed FN. Since the ΔD/Δf values for the CH3- and NH2-SAM surfaces are the smallest, FN might exhibit a relatively rigid, and thus less energy-dissipating, conformation on these two surfaces. On the other hand, larger ΔD/Δf values were observed on the SiO2 and OH-SAM surfaces. Accordingly, FN might exhibit a relatively soft conformation on these two surfaces, which is more viscous and energy-dissipating. Because a ΔD/Δf value lying between the above two groups was observed for the COOH-SAM surface, it is possible that these absorbed FN exhibit an intermediate conformation or a mixture of the above two conformations.| FN density (ng cm−2) | ΔD/Δf | |
|---|---|---|
| SiO2 | 820 ± 30 | 0.051 ± 0.001 |
| CH3-SAM | 378 ± 49 | 0.032 ± 0.004 |
| OH-SAM | 369 ± 33 | 0.054 ± 0.001 |
| COOH-SAM | 768 ± 96 | 0.043 ± 0.002 |
| NH2-SAM | 533 ± 28 | 0.034 ± 0.001 |
3.4 Analysis of RGD exposure and FN conformation using ELISA
In order to investigate the differences in conformations of the adsorbed FN on the various SAM surfaces, the relative RGD exposure was calculated for FN on each surface. The amount of RGD motif exposure was first measured via ELISA, and the value was then divided by the adsorption density measured by QCM-D to obtain the relative exposure of RGD (i.e., the relative amount of RGD exposed per unit FN). An inverse proportionality between FN adsorption density and the relative RGD exposure and an overall negative correlation between the ΔD/Δf value and the relative RGD exposure of FN (except for the OH-SAM surface) were observed (Fig. 3). The overall trend was consistent with a previous study that also investigated the exposure of RGD in fibronectin.28 | ||
| Fig. 3 Plots of (A) FN adsorption density and (B) the ΔD/Δf value versus relative RGD exposure. | ||
Since Δf corresponds to the mass and ΔD to the viscoelastic properties of the attached substance, the ΔD/Δf value is the viscoelasticity of the adsorbed FN, independent of the distribution. It has been demonstrated in previous research studies that the FN dimers undergo conformational extension upon activation, which enhances the bioactivity of FN toward cell adhesion by exposing the RGD motif located near the middle of the dimer molecule.29,30 Accordingly, it is possible that the observed differences in ΔD/Δf values correspond to different conformations of the surface-adsorbed FN. On the surfaces exhibiting smaller ΔD/Δf values (e.g., the CH3- and NH2-SAM surfaces), FN may have undergone a greater extent of conformational extension, which would make the RGD motifs more accessible. Because the extended conformation is flatter than the natural compact one, the damping effect was attenuated and a smaller ΔD/Δf value was obtained. Meanwhile, the adsorption density was decreased because a single extended FN molecule occupies more space than one in its natural compact conformation. An illustration of this relationship between relative RGD exposure and protein conformation is provided in Fig. 4.
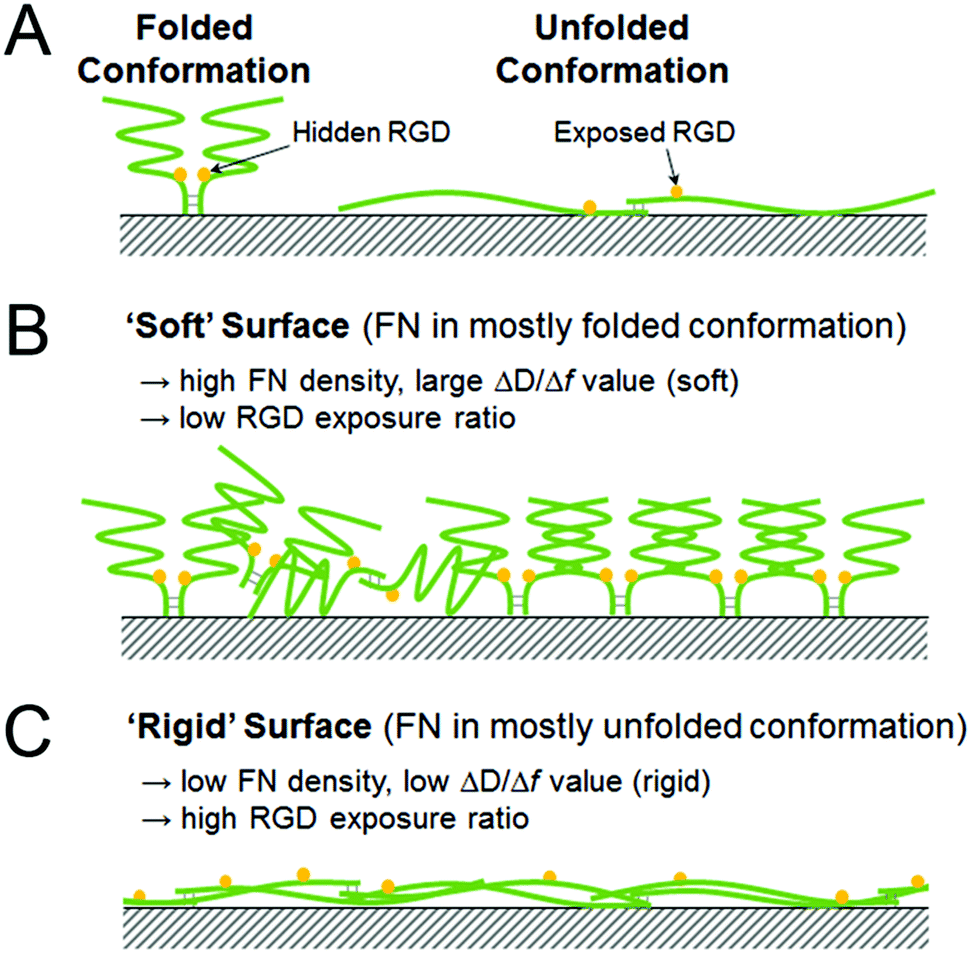 | ||
| Fig. 4 Schematic illustrations of (A) the natural, folded conformation and the adsorption-induced, unfolded conformation changes of FN, (B) the ‘soft’ surface mainly composed of folded FN, and (C) the ‘rigid’ surface mainly composed of the unfolded FN. | ||
3.5 Analysis of L929 cell adhesion dynamics using QCM-D
Δf and ΔD signals from L929 cell adhesion (the C phase lines in Fig. 5) after FN protein adsorption (the P phase lines in Fig. 5) were obtained from QCM-D measurements, and different patterns of Δf and ΔD changes were observed among the various surfaces. It should also be noted that almost all the cells were adhered onto the substrate surfaces, with no apparent floating cells at about 30 min after seeding, as observed through the QCM-D window chamber (ESI, Fig. S1†), and that similar QCM-D trends were observed in multiple trials (ESI, Fig. S2†).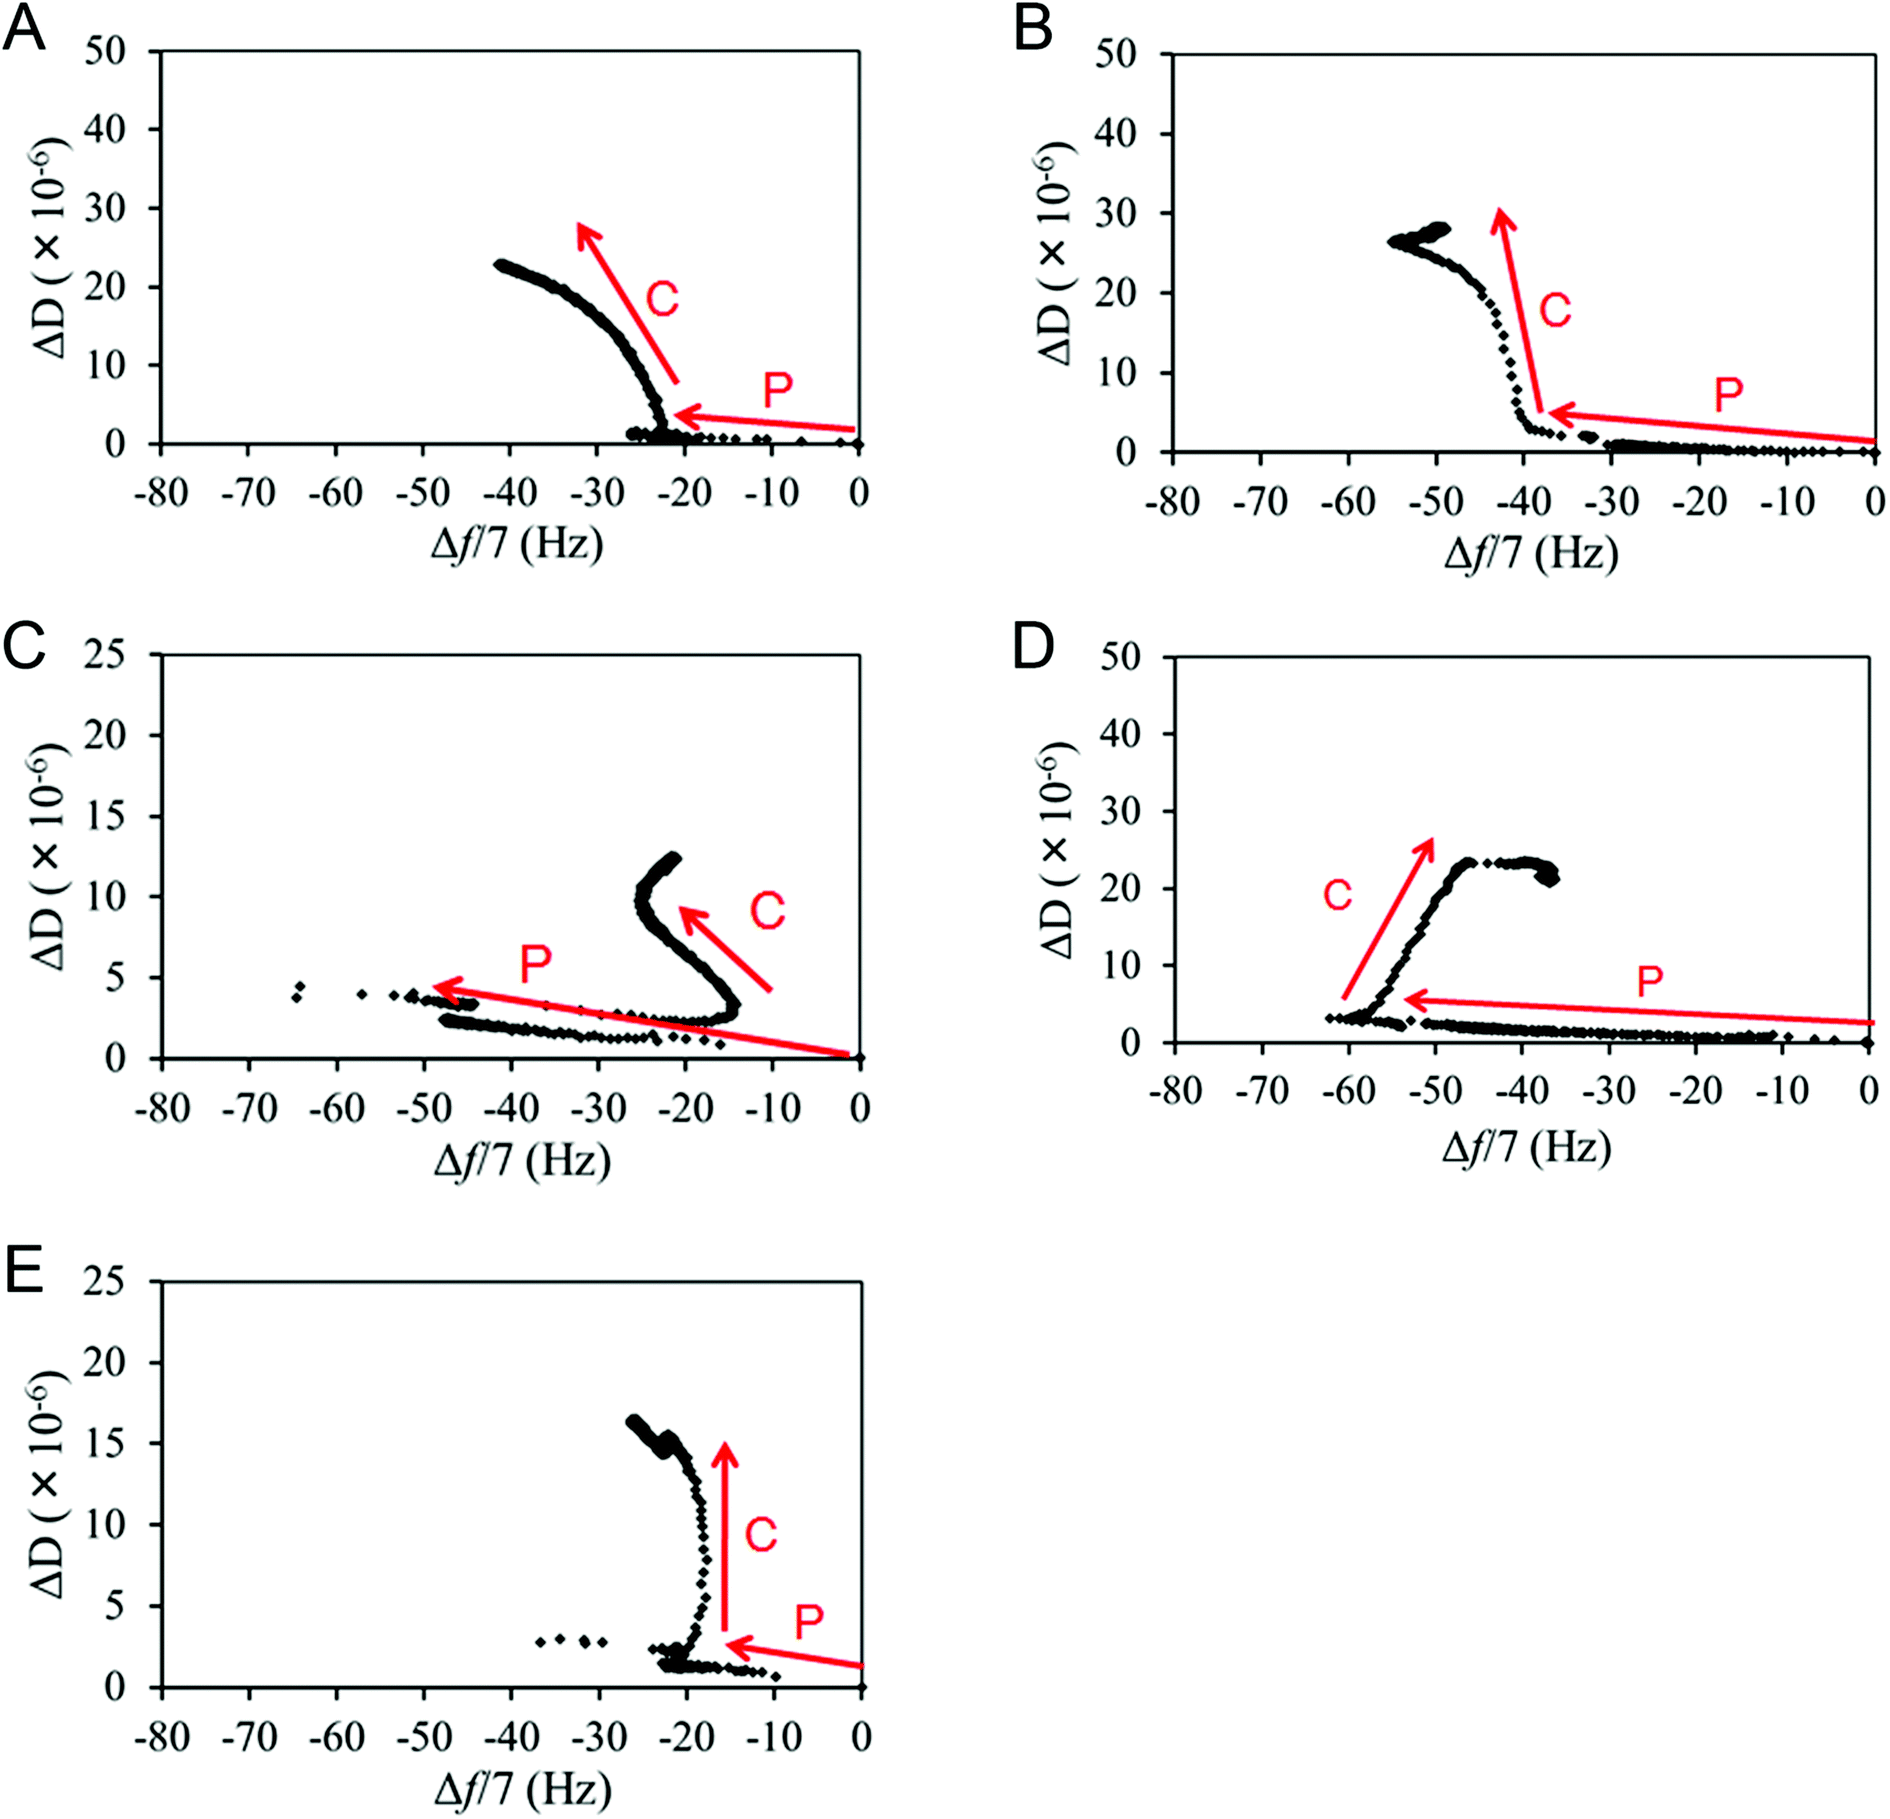 | ||
| Fig. 5 Representative QCM-D ΔD–Δf plots for (A) the CH3-SAM surface, (B) the NH2-SAM surface, (C) the SiO2 surface, (D) the COOH-SAM surface and (E) the OH-SAM surface. “P” denotes the protein adsorption phase, and “C” denotes the cell adhesion phase. | ||
A definite trend was observed for the CH3-SAM surface, with Δf decreasing and ΔD increasing gradually throughout the adhesion process (Fig. 5A). This is also observed in the early-phase adhesion of the NH2-SAM surface (Fig. 5B). Since Δf is correlated with the cell spreading area and ΔD with the degree of receptor-mediated cell attachment,31,32 the observed Δf decrease and the concomitant ΔD increase are likely caused by the stable cell–surface attachments and large cell spreading. This is consistent with the result of immunostaining, where cell spreading and a high degree of polarization were observed for the two surfaces. In addition, from the results of the analyses of surface-adsorbed FN, rigid FN layers were formed and high RGD exposure was exhibited on both the CH3- and NH2-SAM surfaces. The slightly enhanced adhesion observed on the NH2-SAM surface may be attributed to the positive charge on the surface, which may have an inductive effect on the protein surface and cause the surface to interact more strongly with the negative charge of the cell membrane. All in all, the pattern of the Δf and ΔD changes in the early phase of L929 adhesion for the CH3- and NH2-SAM surfaces (i.e., decreasing Δf accompanied by increasing ΔD) may correspond to robust cell–surface interactions that encourage cell adhesion and cell spreading.
On the SiO2 surface, Δf and ΔD often changed directions such that no definite trend of signal changes could be observed (Fig. 5C). However, it is noteworthy that an overall increase in Δf after the introduction of the cell suspension was observed. Because the penetration depth of the acoustic shear wave is no larger than 250 nm in water (which is much shorter than the 10 μm diameter of a typical cell) and the density of a cell is only slightly higher than water, QCM-D looks mainly at the proteins lying between the sensor surface and the cells, as well as a small portion of the cells themselves.33–37 In this experiment, it was confirmed by simultaneous optical microscopy that there were no significant changes in cell number and spreading area after the initial cell adhesion period of roughly 30 min (ESI, Fig. S1†). Also, from the results of FN analysis, relatively soft FN layers were formed and low RGD exposure was exhibited on the SiO2 surfaces. Thus, the phenomenon of increasing Δf after the introduction of the cell suspension may point to a relatively weak protein–surface interaction, where a portion of the adsorbed FN detached from the surface upon cell introduction (possibly through physical collisions or interactions with the floating cells), so that the absolute value of Δf, which is the total coupled mass at the sensor surface, decreased. This may also be the reason for the Δf increase in the late-phase adhesion process on the SiO2, COOH- and NH2-SAM surfaces.
The case for the COOH-SAM surface (Fig. 5D), although there is an increase in the Δf, appears to be different from the SiO2 surface, as this increase occurred more gradually, which suggests that the protein–surface interaction on the COOH-SAM surface may be stronger than that of the SiO2 surface, as also suggested by the lower ΔD/Δf value. The gradual shift may correspond to ECM remodelling, where the RGD motifs gradually become unravelled by the cells, thus allowing cell adhesion. Accordingly, the remodelling and cell adhesion seem to remove the overly-crowded proteins from the sensor surface, resulting in an overall Δf increase.
The cells on the OH-SAM surface exhibited a unique adhesion behaviour among the various surfaces. In the QCM-D monitoring, Δf hardly changed after initial attachment while ΔD increased and then decreased during the entire process (Fig. 5E). This kind of signal change was previously reported to correspond to cell attachment without spreading.38 However, cell spreading (without polarization) was observed via immunostaining for cells on the OH-SAM surface. The previous ELISA result showed that the RGD exposure was the highest on the OH-SAM surface, although the FN layer was relatively soft. This suggests that the FN on the OH-SAM may exhibit a conformation lying in between or different from those on the CH3-SAM and the SiO2 surfaces, due to the relatively sparse density of adsorbed FN. As a result, the weak protein–surface interaction on the OH-SAM surface, as suggested by the soft mechanical properties of the surface-adsorbed FN, may have been offset by the enhanced cell spreading caused by the high RGD exposure, resulting in such complicated patterns of Δf and ΔD.
3.6 Discussion
Taking all the results into account, it is suggested that the material surface chemical functional groups modulate cellular behaviours via altering the state of the surface-adsorbed proteins. On the CH3- and NH2-SAM surfaces, where relatively rigid FN conformations (low ΔD/Δf) and high RGD exposures were observed, cell spreading and polarization were observed and robust cell–surface interaction was detected (as indicated by decreasing Δf and increasing ΔD in the ΔD–Δf plots). In contrast, on the SiO2 surface, where softer FN conformations (high ΔD/Δf) and low RGD exposures were exhibited, cell spreading and polarization were absent, and unstable protein–material and cell–protein interactions were detected (as indicated by a sharp overall increase in Δf and ΔD in the ΔD–Δf plots). The COOH- and OH-SAM, despite exhibiting cell morphologies similar to the other SAM surfaces, seem to encapsulate more complicated material–protein–cell interactions as detected by QCM-D.This study has demonstrated that the characteristic features of the QCM-D ΔD–Δf plots can dynamically and quantitatively reflect the state of the proteins and the cells on the surface. Not only can they give direct information such as the mass (Δf) or the viscoelasticity (ΔD) of the protein layers and cells, but also they can provide useful insights regarding the dynamics and mechanisms of protein–material and cell–protein interactions. The degree of protein–material interaction may be assessed by the amount of desorbed proteins (the shift in Δf immediately after the introduction of cells; Table 4). This effect was most prominent on the SiO2 surface and least apparent on the CH3-SAM and NH2-SAM surfaces. The overall trend of this protein–material interactions is consistent with a previous study that directly investigated the physical strengths of FN adsorption onto various SAM surfaces, suggesting that the FN desorption is a good indicator of the strength of FN adsorption.39 Similar desorption behaviours were observed at the ends of C phases of SiO2, COOH-SAM and NH2-SAM, which all had relatively high densities of adsorbed FN, suggesting that the cell adhesion processes had dislodged some of the excess proteins from the surface of QCM-D sensors. In particular, the QCM-D data of COOH-SAM, in combination with the ELISA data, suggest a remodelling of the underlying protein layer, where the cells apparently unravel new adhesion sites and replace the excess proteins on the surface that enables a steady cell adhesion to take place. Overall, the protein–material interaction seemed to influence the cell circularity, the amount of desorbed proteins and the FN conformation, as evaluated by the ΔD/Δf of the P phase lines in the QCM-D plots.
| Amount of desorbed proteins (Δf shift pre-C phase; 1/7 Hz) | Degree of receptor–ligand association (ΔD/Δf in C phase; 10−6 Hz−1; absolute value) | |
|---|---|---|
| CH3-SAM | −1.93 ± 1.61 | 2.84 ± 0.61 |
| NH2-SAM | −1.16 ± 0.61 | 5.36 ± 0.73 |
| SiO2 | 24.50 ± 6.45 | 0.83 ± 0.30 |
| COOH-SAM | −3.85 ± 2.90 | 5.28 ± 1.94 |
| OH-SAM | 3.81 ± 1.06 | 4.50 ± 1.58 |
On the other hand, the degree of cell–protein interaction may be assessed by the dynamics of cell adhesion (ΔD in the C phase) divided by the mass of adhered cells (Δf in the C phase), and thus by the ΔD/Δf of the cell adhesion phase (Table 4). For example, on the NH2-SAM surface, which exhibited the highest degree of cell spreading area, the ΔD increased rapidly and attained a higher value compared to the other surfaces. Meanwhile, the ΔD on the SiO2 surface increased slowly and to a lower value. Interestingly, the OH-SAM surface displayed a sharp increase in ΔD but a slow decrease in Δf, suggesting that the cells on the OH-SAM were strongly adhering to the proteins, but were spreading slowly and adhered less in number, as confirmed with the simultaneous microscopy (ESI, Fig. S1†). This may be attributed to the highly exposed but sparse RGD motifs in combination with the highly viscoelastic FN layer that may be hindering cell anchorage to form. Overall, the cell–protein interaction, as evaluated by the ΔD/Δf of the C phase lines in the QCM-D plots, correlated well with the RGD exposure obtained from ELISA, as well as the cell spread area.
Some of these findings confirm and shed light on some interesting cell adhesion mechanisms. The protein–material interaction, which influences the viscoelasticity of the protein layer and the conformation, seemed to dictate the cell circularity, which is related to the polarization of cells. Polarization of the cells occurs through the polarized actin contraction enabled by strong traction forces exerted by the cells onto the surface, which in turn is dependent on the strength of the protein–material interaction (i.e., how strong the proteins are anchored) and the protein viscoelasticity (i.e., how rigid the proteins themselves are). In this study, cells on relatively soft and viscous FN layers (i.e., the SiO2 and OH-SAM surfaces) exhibited circularity close to unity, while the degree of polarization of the cells on more rigid FN layers (i.e., the CH3-, NH2- and COOH-SAM surfaces) was larger. This is consistent with many of the previous research studies that have shown that the elasticity of the material influences cell adhesion in such a manner.40,41 Furthermore, the degree of polarization of the adhered cells seemed to be closely related to the viscoelasticity of the underlying protein layer. On the other hand, cell–protein interaction, which is directly related to the affinity of the cells to the proteins and in this case the RGD exposure of FN, seemed to dictate the final cell spread area, as the affinity constants should dictate the final equilibrium adhesion state of the cells.
The findings of this study suggest that, despite the different surfaces having similar cell morphologies, QCM-D can distinguish the different modes of material–protein–cell interactions by quantitatively characterizing the density and viscoelasticity of the underlying proteins, which are governed by the different protein adsorption conformations due to the different material surface chemical functional groups. The various relationships between QCM-D signal changes and the material–protein–cell interactions modulated by material surface chemical functional groups are summarized in Fig. 6. Furthermore, there have been some studies suggesting that the concentration of the protein can influence the kinetics of the conformational changes of protein at the material surface,42,43 and thus such effects of different concentrations of protein, as well as the protein–protein interactions, should be investigated through QCM-D in the near future. In addition, it is also important to keep in mind that the QCM-D still provides only partial information on the cell–surface interactions, and thus it should be combined with other techniques such as atomic force microscopy to reveal biophysical and topographical information of the surface,27 to provide a more comprehensive analysis.
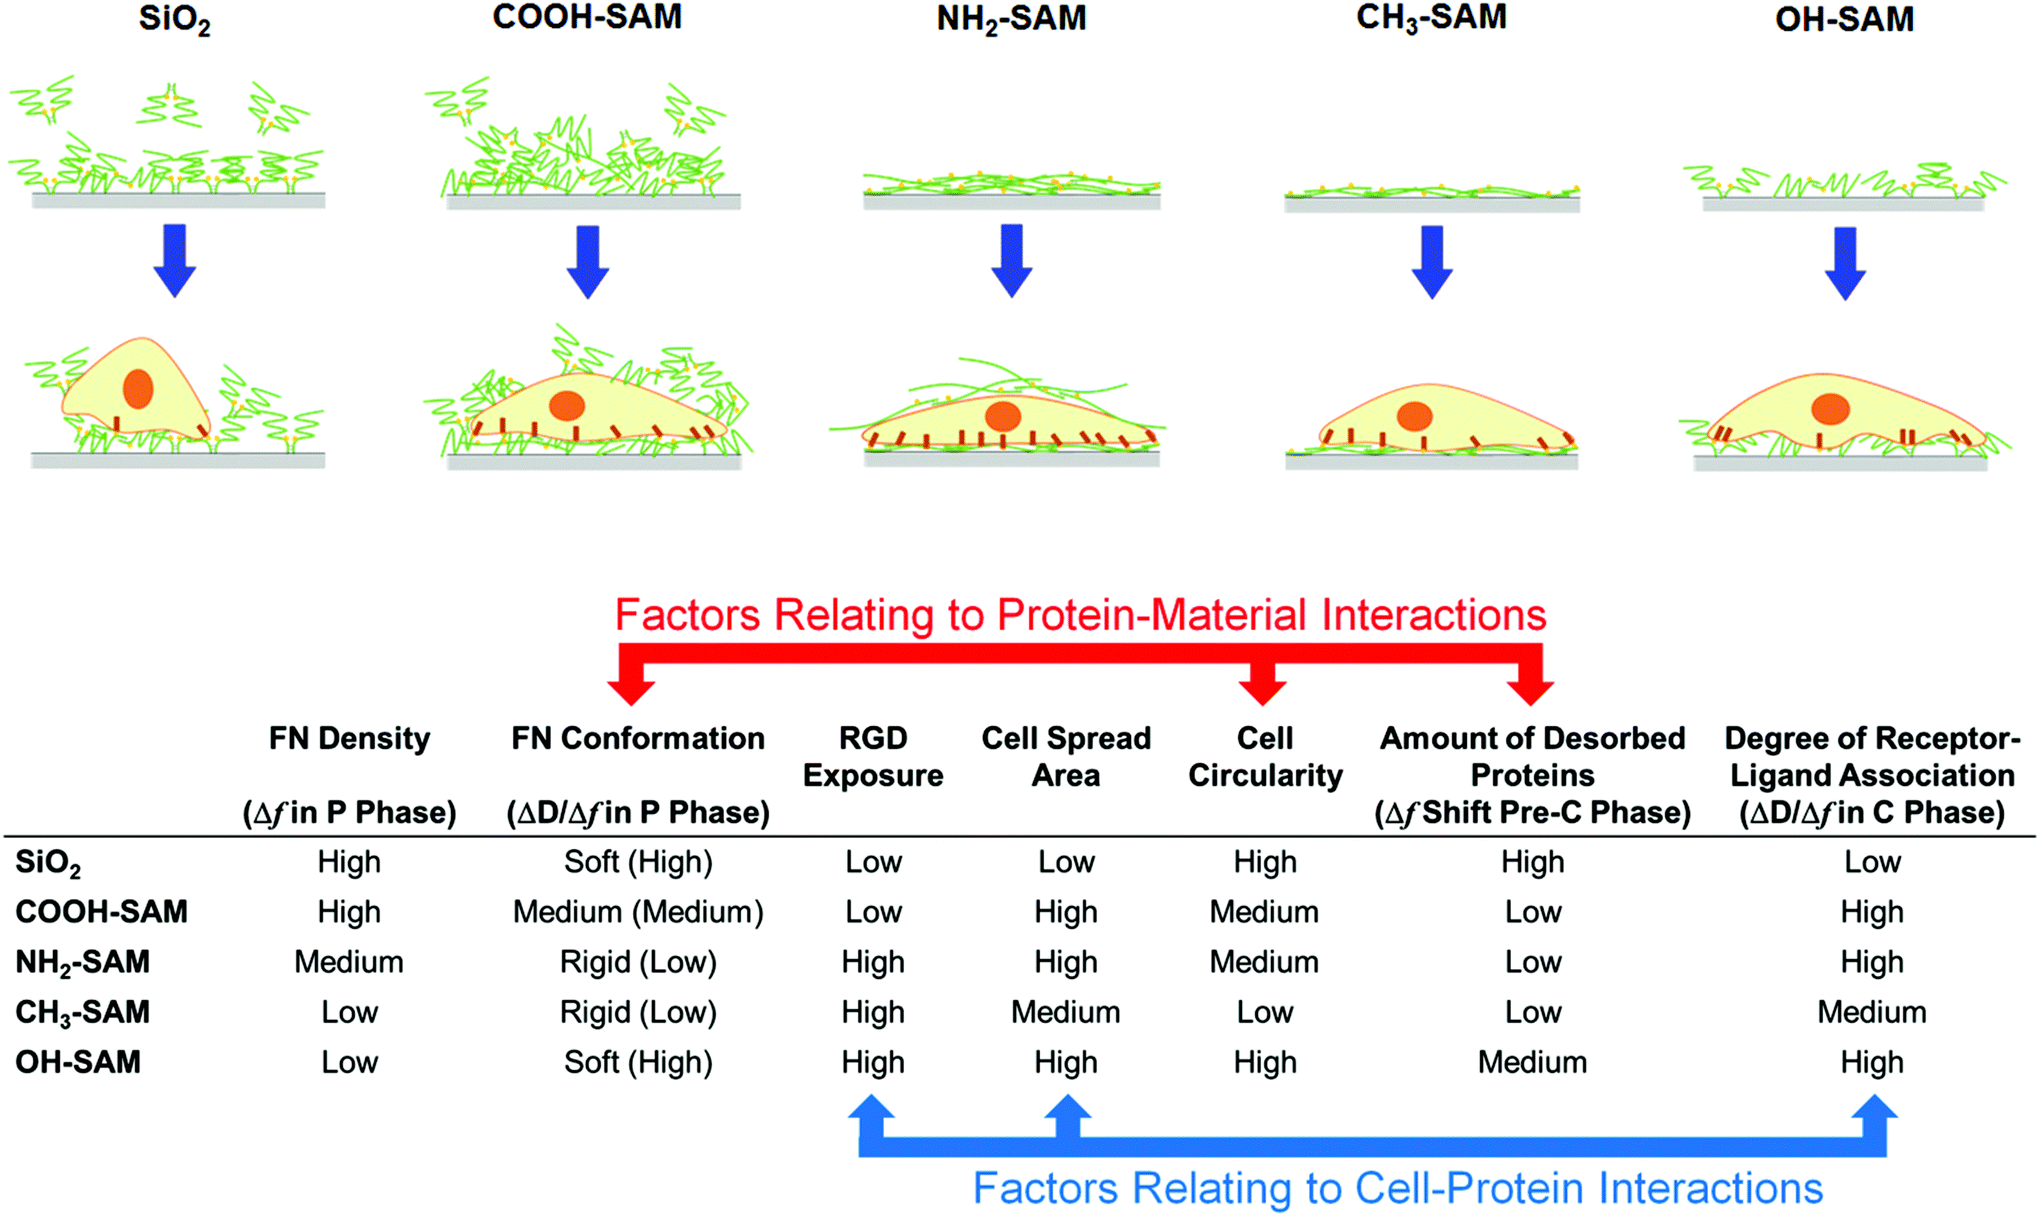 | ||
| Fig. 6 A summary of material–protein–cell interactions based on QCM-D signal changes and their relationships to RGD exposure in FN and cell adhesion behaviours. In general, the protein–material interactions correlated well with the FN conformation, cell circularity and the amount of desorbed proteins, and the cell–protein interactions correlated well with the RGD exposure of the FN molecules, cell spread area and the degree of ligand–receptor association. | ||
4. Conclusions
QCM-D was utilized to analyse how chemical functional groups on the material surface could modulate the conformation and bioactivity of the adsorbed FN, which played an important role in determining the subsequent cell adhesion behaviour. More specifically, a rigid FN layer and high RGD exposure led to robust cell–surface interactions that eventually promoted cell spreading and polarization. In contrast, a soft FN layer and low RGD exposure led to weak protein–surface and cell–surface interactions that hindered cell spreading and polarization. Furthermore, despite the confounding factors, subtle differences in QCM-D plots could distinguish and clarify the complex protein–material and cell–protein interactions on different surfaces. Because it is sometimes difficult to distinguish the subtle differences in the morphology of cells adhered on different surfaces, QCM-D has great potential as a quick rule of thumb for evaluating or gaining new insights into material–protein–cell interactions for the purpose of developing novel biomaterials.Acknowledgements
This work was partly supported by the Grant-in-Aid for Young Scientists (B), the Grant-in-Aid for Scientific Research (A) and the Grant-in-Aid for Scientific Research on Innovative Areas “Molecular Soft-Interface Science” from the Ministry of Education, Culture, Sports, Science and Technology of Japan.Notes and references
- K. Anselme, Biomaterials, 2000, 21, 667 CrossRef CAS PubMed.
- V. Vogel and M. Sheetz, Nat. Rev. Mol. Cell Biol., 2006, 7, 265 CrossRef CAS PubMed.
- M. Balcells and E. R. Edelman, J. Cell Physiol., 2002, 191, 155 CrossRef CAS PubMed.
- A. S. Goldstein and P. A. DiMilla, J. Biomed. Mater. Res., Part A, 2002, 59, 665 CrossRef CAS PubMed.
- A. S. Curtis and J. V. Forrester, J. Cell Sci., 1984, 71, 17 CAS.
- Y. Tamada and Y. Ikada, J. Colloid Interface Sci., 1993, 155, 334 CrossRef CAS.
- J. H. Lee, G. Khang, J. W. Lee and H. B. Lee, J. Colloid Interface Sci., 1998, 205, 323 CrossRef CAS PubMed.
- N. Faucheux, R. Schweiss, K. Lützow, C. Werner and T. Groth, Biomaterials, 2004, 25, 2721 CrossRef CAS PubMed.
- B. G. Keselowsky, D. M. Collard and A. J. García, J. Biomed. Mater. Res., Part A, 2003, 66, 247 CrossRef PubMed.
- J. H. Seo, K. Sakai and N. Yui, Acta Biomater., 2013, 9, 5493 CrossRef CAS PubMed.
- Y. Arima and H. Iwata, Biomaterials, 2007, 28, 3074 CrossRef CAS PubMed.
- A. G. Hemmersam, M. Foss, J. Chevallier and F. Besenbacher, Colloids Surf., B, 2005, 43, 208 CrossRef CAS PubMed.
- P. J. Molino, M. J. Higgins, P. C. Innis, R. M. Kapsa and G. G. Wallace, Langmuir, 2012, 28, 8433 CrossRef CAS PubMed.
- X. B. Yang, H. I. Roach, N. M. Clarke, S. M. Howdle, R. Quirk, K. M. Shakesheff and R. O. Oreffo, Bone, 2001, 29, 523 CrossRef CAS PubMed.
- A. K. Shah, R. K. Sinha, N. J. Hickok and R. S. Tuan, Bone, 1999, 24, 499 CrossRef CAS PubMed.
- A. Rezania and K. E. Healy, Biotechnol. Prog., 1999, 15, 19 CrossRef CAS PubMed.
- E. Watarai, R. Matsuno, T. Konno, K. Ishihara and M. Takai, Sens. Actuators, B, 2012, 171–172, 1297 CrossRef CAS.
- J. Wegener, A. Janshoff and H. J. Galla, Eur. Biophys. J., 1999, 28, 26 CrossRef CAS PubMed.
- J. Redepenning, T. K. Schlesinger, E. J. Mechalke, D. A. Puleo and R. Bizios, Anal. Chem., 1993, 65, 3378 CrossRef CAS PubMed.
- J. Fatisson, F. Azari and N. Tufenkji, Biosens. Bioelectron., 2011, 26, 3207 CrossRef CAS PubMed.
- C. Fredriksson, S. Kihlman, M. Rodahl and B. Kasemo, Langmuir, 1998, 14, 248 CrossRef CAS.
- J. Y. Chen, M. Li, L. S. Penn and J. Xi, Anal. Chem., 2011, 83, 3141 CrossRef CAS PubMed.
- M. S. Lord, C. Modin, M. Foss, M. Duch, A. Simmons, F. S. Pedersen, F. Besenbacher and B. K. Milthorpe, Biomaterials, 2008, 29, 2581 CrossRef CAS PubMed.
- Y. Arima and H. Iwata, J. Mater. Chem., 2007, 17, 4079 RSC.
- S. P. Massia and J. A. Hubbell, J. Cell Biol., 1991, 114, 1089 CrossRef CAS PubMed.
- L. Baugh and V. Viola, J. Biomed. Mater. Res., Part A, 2004, 69A, 525 CrossRef CAS PubMed.
- C. González-García, S. R. Sousa, D. Moratal, P. Rico and M. Salmerón-Sánchez, Colloids Surf., B, 2010, 77, 181 CrossRef PubMed.
- K. A. Bush, P. F. Driscoll, E. R. Soto, C. R. Lambert, W. G. McGimpsey and G. D. Pins, J. Biomed. Mater. Res., 2009, 90A, 999 CrossRef CAS PubMed.
- J. E. Schwarzbauer and J. L. Sechler, Curr. Opin. Cell Biol., 1999, 11, 622 CrossRef CAS PubMed.
- A. Dolatshahi-Pirouz, T. Jensen, M. Foss, J. Chevallier and F. Besenbacher, Langmuir, 2009, 25, 2971 CrossRef CAS PubMed.
- C. Fredriksson, S. Khilman, B. Kasemo and D. M. Steel, J. Mater. Sci. Mater. Med., 1998, 9, 785 CrossRef CAS PubMed.
- M. S. Lord, C. Modin, M. Foss, M. Duch, A. Simmons, F. S. Pedersen, B. K. Milthorpe and F. Besenbacher, Biomaterials, 2006, 27, 4529 CrossRef CAS PubMed.
- M. V. Voinova, M. Rodahl, M. Jonson and B. Kasemo, Phys. Scr., 1999, 59, 391 CrossRef CAS.
- J. Wegener, J. Seebach, A. Janshoff and H. J. Galla, Biophys. J., 2000, 78, 2821 CrossRef CAS PubMed.
- C. Steinem, A. Janshoff, J. Wegener, W. P. Ulrich, W. Willenbrink, M. Sieber and H. J. Galla, Biosens. Bioelectron., 1997, 12, 787 CrossRef CAS PubMed.
- N. Tymchenko, E. Nilebäck, M. V. Voinova, J. Gold, B. Kasemo and S. Svedhem, Biointerphases, 2012, 7, 1 CrossRef PubMed.
- G. Nimeri, C. Fredriksson, H. Elwing, L. Liu, M. Rodahl and B. Kasemo, Colloids Surf., B, 1998, 11, 255 CrossRef CAS.
- C. Fredriksson, S. Khilman, B. Kasemo and D. M. Steel, J. Mater. Sci. Mater. Med., 1998, 9, 785 CrossRef CAS PubMed.
- M. Lin, H. Wang, C. Ruan, J. Xing, J. Wang, Y. Li, Y. Wang and Y. Luo, Biomacromolecules, 2015, 16, 973 CrossRef CAS PubMed.
- X. Q. Brown, K. Ookawa and J. Y. Wong, Biomaterials, 2005, 26, 3123 CrossRef CAS PubMed.
- T. Yeung, P. C. Georges, L. A. Flanagan, B. Marg, M. Ortiz, M. Funaki, N. Zahir, W. Ming, V. Weaver and P. A. Janmey, Cell Motil. Cytoskeleton, 2005, 60, 24 CrossRef PubMed.
- R. R. Seigel, P. Harder, R. Dahint, M. Grunze, F. Josse, M. Mrksich and G. M. Whitesides, Anal. Chem., 1997, 69, 3321 CrossRef CAS.
- R. A. Latour, J. Biomed. Mater. Res., Part A, 2015, 103, 949 CrossRef PubMed.
Footnote |
| † Electronic supplementary information (ESI) available: Optical time-lapse images of cell adhesion on QCM sensors and additional QCM-D ΔD–Δf plots. See DOI: 10.1039/c5bm00613a |
| This journal is © The Royal Society of Chemistry 2016 |