z-Scores and other scores in chemical proficiency testing—their meanings, and some common misconceptions
Analytical Methods Committee, AMCTB No. 74
First published on 5th July 2016
Abstract
z-Scores were devised to provide a transparent but widely-applicable scoring system for participants in proficiency tests for analytical laboratories. The essential idea is to provide an appropriate scaling of the difference between a participant’s result and the ‘assigned value’ for the concentration of the analyte. Interpretation of a z-score is straightforward but some aspects need careful attention to avoid misconception. Over time several related scores have been devised to cope with a diversified range of applications. The main types of score have recently been codified in ISO 13528 (2015).
Proficiency tests are regular interlaboratory studies designed to identify a noteworthy inaccuracy in any participant's result. Wherever possible, results are converted into scores, the purpose of which is to provide a basis for instigating remedial action where necessary. Initially there was a diversity of scoring methods based on different arbitrary transformations of the result. However, it was soon evident that a single straightforward scoring method would allow analysts to interpret a score uniformly across different test materials, analytes, concentration ranges, and measurement principles, even across different proficiency testing schemes.1 This insight gave rise to the ISO/IUPAC/AOAC Harmonised Protocol.2,3 So in the beginning (or shortly after) there was the z-score and the q-score (or their equivalents) and everyone understood them.
The widespread proliferation of proficiency testing in the wake of accreditation, however, generated the need for some small variations on the z-scoring theme to cope with different applications. As an outcome there are now z-scores, z′-scores, zeta (ζ) scores, zL-scores, D-scores and En scores. Successive authors and documents have used old names for new meanings and new names and symbols for old meanings. That's confusing. So let's have a quick look at the current state of play, as laid down in ISO 13528 (2015).4
The z-score
The z-score, probably the most widely used score, given by z = (x − xpt)/σpt, is calculated from the participant's result x, the assigned value xpt, and σpt, the ‘standard deviation for proficiency testing’ (SDPT). The scheme provider determines the numerical values for xpt and σpt. z-Scores are typically interpreted as questionable outside the range ±2 and actionable outside the range ±3 (the rationale for this interpretation is described below in the section ‘What does a z-score tell us?’).The assigned value is the provider's best available estimate of the true quantity value, often a participant consensus. An assumption underlying the z-score is that the uncertainty on the assigned value is negligible in comparison with that on the participant's result. The SDPT (originally called the ‘target value’) is best taken as the standard uncertainty that is regarded as optimally fit for purpose in the relevant sector (see AMCTB No. 68) and must be known in advance by the participants. Other options for evaluating the SDPT are recognised by the ISO standard but all have one or more practical shortcomings.
The D and D% score and δE
This score, D = (x − xpt)/xpt (and the derived D% = 100D), the relative difference of the result from xpt, was until recently called the q-score.2D% is essentially the relative deviation from the assigned value, expressed as a percentage—familiar to analysts but lacking a ‘fitness-for-purpose’ interpretation unless the reader already understands typical performance in terms of the desired relative standard deviation. It has the benefit of simplicity but two drawbacks: (a) scores from different concentration ranges for the same determination may not be comparable, and (b) it does not address fitness for purpose. The latter shortcoming can be overcome by introducing an extra term δE, although that in effect merely converts the D-score into a z-score.The z′-score
A modification to the z-score, , is suggested for use when the uncertainty u(xpt) on an independent assigned value is sufficiently large to affect the z-score appreciably. This is usually taken to happen when u(xpt) > 0.3σpt, in which case the z-score would be reduced by more than 4% relative. The z′-score correctly serves to standardise the deviation from the assigned value, but fails to differentiate between a poor result and a poor assigned value.
The zeta-score and En
The zeta score, can be used in instances where the participant submits a result with an uncertainty estimate u(x), and the assigned value xpt is a certified reference value with an uncertainty u(xpt). Like z, zeta scores outside ±2 are often regarded as questionable and values outside ±3 are cause for action or at least concern.
Zeta scores increase as either the deviation from the assigned value increases or as the reported uncertainty gets smaller, so a larger zeta score can indicate a large error, an underestimated uncertainty, or both. This ambiguity leaves the zeta score open to improper manipulation should participants choose to reduce their score by overstating u(x).
E n is essentially similar to the zeta score but replaces the standard uncertainties with expanded uncertainties. En scores are therefore about half of the corresponding zeta scores, so a value outside ±1 is usually taken as questionable. En is used more in calibration laboratories than analytical laboratories.
The zL-score
This score, zL = (x − xpt)/uf, was devised to accommodate participants for whom the scheme provider's SDPT was inappropriate for a particular customer's use of the result (see AMCTB No. 2). The essential idea is for the participant and customer jointly to set a different SDPT, a standard uncertainty uf that is appropriate to the application, and to use that to calculate the modified score. Use of a zL-score would be a scientifically sound practice so long as (a) its origin was made clear to third parties and (b) the PT scheme's published assigned value was used in the calculation (note: this score is not part of ISO 13528. It was originally called the ‘zeta (ζ)-score’, but that term was subsequently appropriated for other purposes (see above)).What does a z-score tell us?
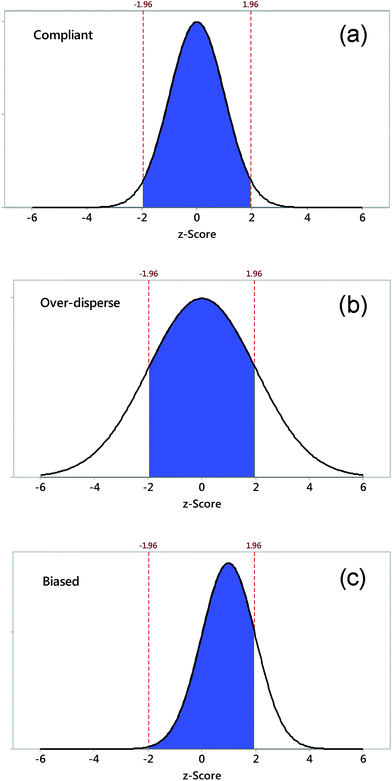
z-Scores are interpreted as if successive outcomes for a compliant participant laboratory were drawn at random from a normal distribution with zero mean and unit standard deviation. In such a laboratory, scores outside the range ±2 would occur with a probability of about 0.05, which, as an isolated event should be interpreted as no more than a warning limit. Scores outside the range ±3 would be much rarer under the standard normal assumption (p ≈ 0.003) and can safely be taken as action limits to instigate an investigation into the cause of the problem. Non-compliant laboratories, namely those with a dispersion greater than σpt or a biased mean, could expect a higher proportions of scores outside those ranges. Fig. 1 illustrates these possibilities.It is essential to emphasise that interpreting z-scores thus does not assume the participants' results in a round are normally distributed. That is a common misconception among statisticians and regulators unfamiliar with proficiency testing. The interpretation of z-scores relies rather on the idea that, if all the laboratories performed similarly and exactly in accordance with the requirement set by the assigned value and the SDPT, their results would be approximately normally distributed with mean xpt and standard deviation σpt. z-Scores would then show a normal distribution with zero mean and unit standard deviation. Notice that this does not assume that the actual participant results are normally distributed; only that idealised performance from all participants would have led to a standard normal distribution of scores. So over time, z-scores compare a participant with the PT provider's criterion of good performance.
In the longer term
Proficiency testing can readily demonstrate bad performance, but has far less power to demonstrate competence. While a z-score outside the range of ±3 clearly calls for action, a score within the range of ±2 does not in itself say that all is well. Fig. 1 shows why. Even with an uncertainty of twice σpt, a participant would still receive a z-score in the range of ±2 with a probability of about 0.67. With a compliant standard deviation but a bias equal to σpt, the probability of a score within the range of ±2 would be about 0.83. That is why it is incorrect to say that we can demonstrate competence via a single acceptable z-score, or even several in succession. We have to undertake a longer-term view of z-scores in combination with other factors to demonstrate competence.A simple and effective long-term view for a participant is provided by plotting successive z-scores on a control chart based on a zero mean and unit standard deviation, either a Shewhart chart or, better still, a range chart (see AMCTB Nos. 12 and 16).
Michael Thompson (Birkbeck University of London)
This Technical Brief was prepared for the Analytical Methods Committee and approved on 14/05/16.
References
- Analytical Methods Committee, Analyst, 1992, 117, 97–104 RSC.
- M. Thompson and R. Wood, Pure Appl. Chem., 1993, 65, 2123–2144 CrossRef CAS.
- M. Thompson, S. L. R. Ellison and R. Wood, Pure Appl. Chem., 2006, 78, 145–196 CrossRef CAS.
- ISO 13528, 2015.
| This journal is © The Royal Society of Chemistry 2016 |


