
 Open Access Article
 This Open Access Article is licensed under a
 Creative Commons Attribution 3.0 Unported Licence
Ultrasound-assisted micellar extraction of phenolic antioxidants from spices and antioxidant properties of the extracts based on coulometric titration data
Guzel
Ziyatdinova
*,
Endzhe
Ziganshina
,
Phuc Nguyen
Cong
and
Herman
Budnikov
Analytical Chemistry Department, A.M. Butlerov Institute of Chemistry, Kazan Federal University, Kremlyevskaya 18, 420008 Kazan, Russian Federation. E-mail: Ziyatdinovag@mail.ru
First published on 15th September 2016
Abstract
Ultrasound-assisted micellar extraction of phenolic antioxidants from spices has been developed for the first time. The effect of the surfactant nature and its concentration on the extraction efficiency has been evaluated. Electrogenerated hexacyanoferrate(III) ions have been used as coulometric titrants owing to their selectivity towards phenolic antioxidants. The best recovery of phenolic antioxidants has been obtained using nonionic 0.1 mol L−1 Brij® 35 micellar medium by single extraction for 10 min with ultrasound treatment. The spice/extractant ratio that provided maximum recovery of phenolic antioxidants was found for 20 spices. Comparisons with ethanolic and methanolic extracts have been performed. Micellar extracts show significantly higher recovery of phenolic antioxidants. Reactivities of the individual phenolic antioxidants of the spices with electrogenerated hexacyanoferrate(III) ions, bromine and Ce(IV) in Brij® 35 micellar medium have been found. The antioxidant properties of the spices' micellar extracts have been estimated using total antioxidant capacity (TAC), ferric reducing power (FRP) and ceric reducing/antioxidant capacity (CRAC) based on their reactions with coulometric titrants (the electrogenerated bromine, hexacyanoferrate(III) ions and Ce(IV), respectively). Positive correlations of these parameters with antioxidant activity towards 2,2-diphenyl-1-picrylhydrazyl (DPPH˙) (r = 0.8676, 0.9502 and 0.8855 for TAC, FRP and CRAC, respectively) have been obtained.
1. Introduction
Plant raw materials including spices and aromatic herbs are important objects of investigation and analysis in life sciences due to a wide spectrum of their biological activity and useful properties. They are the sources of a great variety of compounds of different natures, including antioxidants. Many of the compounds that have been isolated from spices and aromatic herbs, including some vitamins, flavonoids, terpenoids, carotenoids, and phytoestrogens, render them or their antioxidant components useful as preservative agents in food.1,2 Therefore, the investigation of spices' antioxidant properties is of interest.Spices are used as food additives in the form of whole or ground spices, and as isolates from their extracts. The extraction procedure is determined by the types of antioxidant compounds to be extracted. The choice of an extraction procedure significantly affects the final product properties. For polyphenols and other antioxidants in plant materials, three principal extraction techniques may be used: liquid, solid-phase and supercritical extraction. These are discussed in detail in the review.1
In recent years, ultrasound-assisted extraction is often applied for the extraction of plant material using liquid solvents, providing higher yields of target analytes.3–5 Moreover, it is more environmentally-friendly, simple and inexpensive and also improves the extract quality, making it an efficient alternative to conventional extraction techniques.3,4 The use of ultrasound-assisted extraction may prevent possible chemical degradation of target compounds due to the decreased chemical involvement and reduction in extraction time.5 This approach has been successfully applied to the extraction of bioactive principals from herbs,6 capsaicinoids from chili peppers,7 hesperidin from Penggan peel,8 polyphenols from orange peel,9 anthocyanins from mulberry,10 polyphenols from grape seeds,11 and phenolic compounds from sage,12etc.
Organic media, methanol in particular, ethanol and non-polar solvents are usually applied for the extraction of active components from spices. Over the last decade, green chemistry concept based on substitution of organic solvents with non-toxic water media has risen in interest. Surfactant micellar media is one of the possibilities to realize this approach.13 On the other hand, the micellar extraction of spices' active components simulates partially the conditions during cooking. A mixed micelle-mediated cloud point extraction system has been developed for the extraction and preconcentration of synthetic phenolic antioxidants (propyl gallate, tert-butylhydroquinone, butylated hydroxyanisole and octyl gallate) in the cakes. A mixture of two non-ionic surfactants, polyoxyethylene (7) nonylphenyl ether and polyoxyethylene (9) nonylphenyl ether, has been utilized as a suitable micellar medium for the preconcentration and extraction of the analytes.14
There is a lack of investigations regarding the combination of micellar media and ultrasound treatment for the extraction of active components from plant raw materials. An ionic liquid surfactant-mediated, ultrasonic-assisted extraction coupled to HPLC has been successfully applied for the analysis of tanshinones in Salvia miltiorrhiza bunge.15 Triton X100 micellar medium under ultrasound treatment has been used for the spices' phenolic antioxidants extraction and their ferric reducing power (FRP) estimation based on the reaction of phenolic antioxidants with electrogenerated hexacyanoferrate(III) ions. The maximum recovery has been achieved by a single extraction with 0.25 mM Triton X100 solution for 10 min.16
The aim of this work is the development of ultrasound-assisted surfactant micellar extraction of the phenolic antioxidants from spices and estimation of the extracts' antioxidant properties. The efficiency of extraction has been checked by coulometric titration with hexacyanoferrate(III) ions showing selectivity towards phenolic compounds.17 The antioxidant properties of the extracts have been characterized by total antioxidant parameters, particularly, total antioxidant capacity (TAC), FRP and ceric reducing/antioxidant capacity (CRAC) based on reactions with the coulometric titrants (electrogenerated bromine, hexacyanoferrate(III) ions and Ce(IV), respectively). It should be noted, that coulometric titration with electrogenerated titrants is characterized by high sensitivity, simplicity, accuracy, cost-efficiency and reliability, as well as the possibility of miniaturization. Coulometry and coulometric titration are absolute methods similar to gravimetry and do not require chemical standards or calibration. Besides, it is also a very attractive form of providing reagents for systems based on in situ generation by electrolysis and further reactions with the substances being determined. Therefore, in fact, the electrons play the role of titrant. This analytical method is widely employed in product quality assay and in process control in various industrial areas.18 Constant-current coulometry is successfully applied in the evaluation of total antioxidant parameters such as TAC using titration with electrogenerated bromine19 and FRP using hexacyanoferrate(III) ions.17 In this case, the coulometric data allow to characterized the sample as a whole avoiding the time-consuming identification and quantification of each component, as in chromatography.
2. Experimental
2.1. Reagents and chemicals
Surfactants Triton X100 and Brij® 35 from Sigma (Germany), sodium dodecylsulfate (SDS) from Panreac (Spain) and cetylpyridinium bromide (CPB) from Aldrich (Germany) were used. Their 0.1 mol L−1 stock solutions (0.005 mol L−1 for CPB) were prepared by dissolving a definite amount of the appropriate substance in 250 mL of water. More dilute solutions were prepared by exact dilution of the stock solution.Gallic (99% purity), caffeic (98%), rosmarinic (98%), and p-coumaric (98%) acids, vanillin (99%), quercetin (95%), catechin hydrate (98%), thymol (99.5%), curcumin (65%) from Curcuma longa and capsaicin (50%) were purchased from Sigma (Germany). Chlorogenic (95% purity) and ferulic (99%) acids, eugenol (99%) and syringaldehyde (98%) were obtained from Aldrich (Germany). Rutin trihydrate (97% purity) from Alfa Aesar (UK) and tannin of Ph.Eur. purity from Fluka (Germany) were used. Their 0.40–10.0 mmol L−1 stock solutions were prepared by dissolving a definite amount of the substance in 0.1 mol L−1 Brij® 35 with sonication for 10 min.
DPPH˙ was purchased from Aldrich (Germany). Its stock solution (100 μmol L−1) was prepared by dissolving a definite amount in methanol (chemical grade purity).
All other chemicals were analytical reagent grade purity and used as received. The experiments were carried out at laboratory temperature (20–23 °C). All solutions of compounds under investigation were prepared exactly before the measurements.
2.2. Apparatus
Coulometric measurements were carried out using coulometric analyzer “Exper-006” (Econix-Expert, Moscow, Russia) with four-electrode two-compartment electrochemical cell. A bare platinum wire with 0.5 cm2 surface area was used as the working electrode, and a platinum wire separated from the anodic compartment with a semipermeable membrane as the auxiliary electrode. A pair of polarized platinum electrodes was used for detection of the titration end-point (ΔE = 200 mV). The surface of the platinum electrodes was cleaned by HNO3 and then rinsed thoroughly with double distilled water.WiseClean WUC-A03H (DAIHAN Scientific Co., Ltd, Republic of Korea) ultrasonic bath was used for the extraction.
Spectrophotometric measurements were performed on spectrophotometer PE-5300 (NPO Ecros, Russia).
2.3. Procedures
Electrochemical generation of bromine was carried out from 0.2 mol L−1 KBr in 0.1 mol L−1 H2SO4, hexacyanoferrate(III) ions from 0.1 mol L−1 K4Fe(CN)6 in 2 mol L−1 KOH and Ce(IV) from 0.1 mol L−1 Ce(NO3)3 in 3 mol L−1 H2SO4, at the current density of 5 mA cm−2 providing 100% current yield.17,19,20
Coulometric titration was carried out in a 50 mL cell containing 20.0 mL of the supporting electrolyte. The generating circuit was switched on and a certain value of the indicator current was attained. Then, an aliquot portion (20–500 μL) of antioxidant standard solution or spices' micellar extract was added to the cell and the timer was simultaneously started. The titration end-point was detected by the attainment of the initial value of the indicator current. The timer was stopped, and the generating circuit was turned off. The times of titration were used for the TAC, FRP and CRAC calculations.
TAC, FRP and CRAC were expressed as Coulombs (C) per gram of dry spices.
A volume of 3.0 mL of 100 μmol L−1 DPPH˙ methanol solution was used. The reaction was started by the addition of 5 μL of spices' micellar extracts. After incubation at room temperature in the dark for 20 min, the remaining DPPH˙ was determined by absorbance at 515 nm, and the radical scavenging activity of each sample was expressed using the ratio of the absorption decrease of DPPH˙ (%) to that of the control DPPH˙ solution (100%) in the absence of the sample. 5 μL of 0.1 mol L−1 Brij® 35 were added to the control DPPH˙ solution in order to take into account the surfactant medium effect on the DPPH˙ absorbance.
2.4. Sample preparation
The spices available in the local market were studied. A representative portion of the milled samples (0.1000 ± 0.0003 g) was weighed and preliminary ultrasonic liquid extraction with surfactant micellar media was used. Extraction conditions were varied in order to find the best recovery of phenolic antioxidants. Then, extracts were filtered and used for further measurements.2.5. Data treatment
Coulometric measurements were performed in five replications and spectrophotometry in triplicate. Statistical evaluation was performed at a significance level of 5%. All data are expressed as the X ± ΔX with X as average value and ΔX as confidence interval.Correlation analysis was performed using OriginPro 8.0 (OriginLab, USA) software.
3. Results and discussion
3.1. Ultrasound-assisted micellar extraction of phenolic antioxidants from spices
The applicability of surfactant micellar media with ultrasound treatment for phenolic antioxidants' extraction from spices was tested. Cationic CPB, anionic SDS and nonionic Triton X100 and Brij® 35 micellar media were used as the extractants. Three spices with different contents and types of major antioxidants, clove in particular, nutmeg and caraway, were chosen as model systems. The ultrasound treatment was applied for 10 min for extraction intensification. The effect of the surfactant's nature and concentration on the extraction yield of phenolic antioxidants was studied by coulometric titration with hexacyanoferrate(III) ions that were selective towards this class of antioxidants. The extraction efficiency was expressed as a quantity of electricity required for the titration of the extract. As one can see from Table 1, the highest extraction was obtained for the 0.1 mol L−1 Brij® 35 micellar media. Therefore, it was used for further investigations. Extraction time of 5–15 min under ultrasound treatment was tested (Fig. 1). The maximum extraction was achieved at 10 min, which was used for further measurements.| Spice | Surfactant | c surfactant/mmol L−1 | Q/C | RSD/% |
|---|---|---|---|---|
| Clove | SDS | 10.0 | 7.3 ± 0.1 | 1.62 |
| 100 | 8.9 ± 0.3 | 2.62 | ||
| Triton X100 | 10.0 | 5.8 ± 0.2 | 3.03 | |
| 100 | 8.4 ± 0.2 | 1.60 | ||
| Brij® 35 | 10.0 | 8.5 ± 0.4 | 3.74 | |
| 100 | 9.65 ± 0.09 | 0.72 | ||
| CPB | 0.500 | 7.5 ± 0.4 | 4.82 | |
| 5.00 | 7.6 ± 0.2 | 2.22 | ||
| Nutmeg | SDS | 10.0 | 0.55 ± 0.03 | 4.85 |
| 100 | 1.42 ± 0.02 | 1.41 | ||
| Triton X100 | 10.0 | 0.93 ± 0.05 | 4.00 | |
| 100 | 1.58 ± 0.03 | 1.32 | ||
| Brij® 35 | 10.0 | 0.92 ± 0.03 | 2.57 | |
| 100 | 2.1 ± 0.1 | 3.87 | ||
| CPB | 0.500 | 0.75 ± 0.01 | 1.31 | |
| 5.00 | 0.94 ± 0.07 | 5.81 | ||
| Caraway | SDS | 10.0 | 0.35 ± 0.01 | 2.79 |
| 100 | 0.28 ± 0.02 | 5.74 | ||
| Triton X100 | 10.0 | 0.33 ± 0.01 | 2.85 | |
| 100 | 0.34 ± 0.02 | 3.84 | ||
| Brij® 35 | 10.0 | 0.38 ± 0.01 | 1.08 | |
| 100 | 0.47 ± 0.01 | 1.05 | ||
| CPB | 0.500 | 0.28 ± 0.01 | 3.74 | |
| 5.00 | 0.34 ± 0.03 | 6.28 |
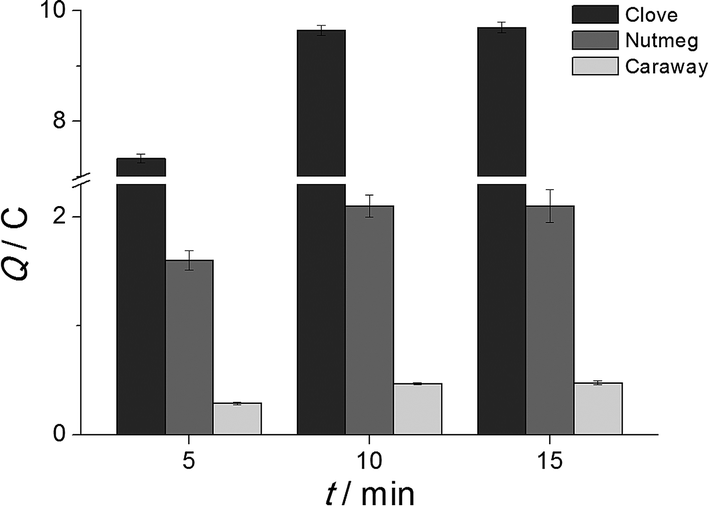 | ||
| Fig. 1 The effect of time on the phenolic antioxidants extraction efficiency. | ||
This approach was applied for 20 spices and the spice/extractant ratio providing the maximum recovery of phenolic antioxidants was found (Fig. 2). The highest recovery was varied in a wide range depending on the spices' nature. The best results were obtained at 1![[thin space (1/6-em)]](https://www.rsc.org/images/entities/char_2009.gif) :20 ratio for nutmeg and caraway, 1:30 for cinnamon, clove, rosemary, anise and black turmeric, 1:40 for basil, cumin, coriander and red hot pepper, 1:60 for oregano, black cardamom, turmeric, black pepper and star anise, 1:80 for green cardamom and 1:100, 1:110 and 1:120 for ginger, paprika and white pepper, respectively.
:20 ratio for nutmeg and caraway, 1:30 for cinnamon, clove, rosemary, anise and black turmeric, 1:40 for basil, cumin, coriander and red hot pepper, 1:60 for oregano, black cardamom, turmeric, black pepper and star anise, 1:80 for green cardamom and 1:100, 1:110 and 1:120 for ginger, paprika and white pepper, respectively.
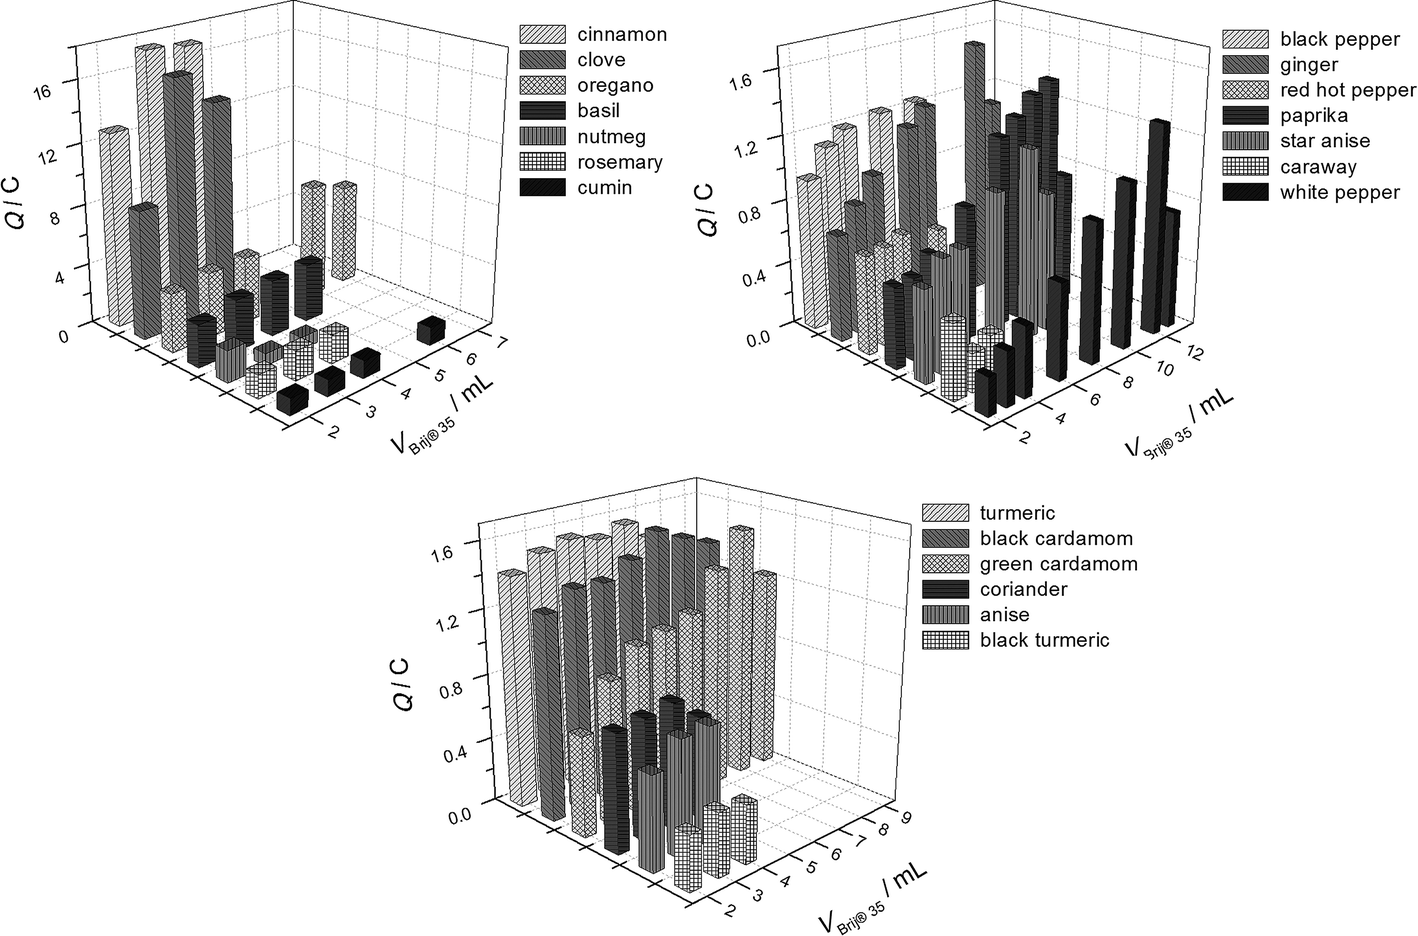 | ||
| Fig. 2 The effect of extractant volume on the phenolic antioxidants recovery from spices using 0.1 mol L−1 Brij® 35 micellar medium. | ||
Micellar extraction is much more effective than ethanolic extraction under the same conditions using ultrasound treatment (Fig. 3) due to the higher extraction power of Brij® 35 micellar medium. Moreover, Brij® 35 ultrasound-assisted micellar extraction for 10 min provides statistically significant higher recovery of phenolic antioxidants (P < 0.05) than methanolic extraction for 48 hours.22 The corresponding data are presented in Table 2. The improvement of the extraction rate is attributed to several mechanisms, including cavitation and cell wall disruption.5 The higher efficiency and yield of the ultrasound-assisted process over traditional extraction are caused by cell wall disruption that increases and improves the mass transfer and, consequently, decreases the extraction time. Thus, ultrasound-assisted micellar extraction can be considered as a good alternative to organic solvents that are usually used for preparation of spice extracts.
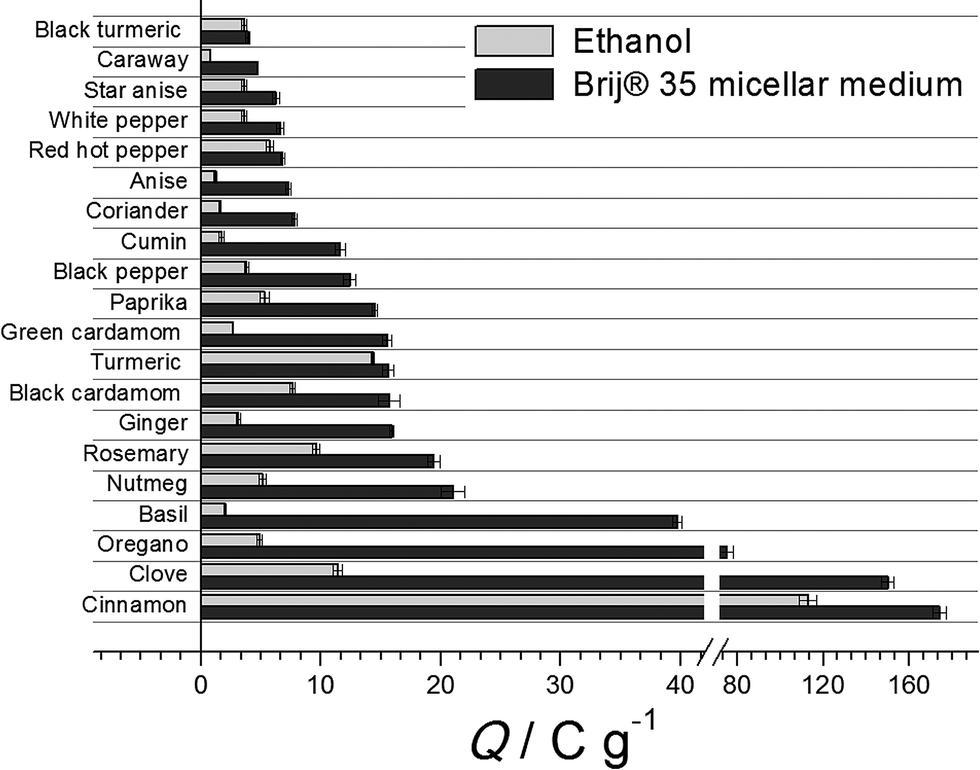 | ||
| Fig. 3 The effect of extractant nature on the phenolic antioxidants extraction efficiency under ultrasound treatment for 10 min. | ||
| Spice | Brij® 35 ultrasound-assisted micellar extract | Methanolic extract | ||
|---|---|---|---|---|
| Q/C g−1 | RSD/% | Q/C g−1 | RSD/% | |
| Cinnamon | 174 ± 3 | 1.5 | 137 ± 3 | 1.8 |
| Clove | 150 ± 3 | 1.6 | 64 ± 27 | 2.6 |
| Oregano | 75 ± 3 | 3.2 | 18.1 ± 0.5 | 2.2 |
| Basil | 39.7 ± 0.4 | 0.81 | 9.4 ± 0.3 | 2.2 |
| Nutmeg | 21 ± 1 | 3.9 | 20 ± 1 | 3.7 |
| Rosemary | 19.4 ± 0.5 | 2.1 | 37 ± 2 | 3.7 |
| Ginger | 15.9 ± 0.2 | 0.94 | 5.9 ± 0.2 | 2.9 |
| Turmeric | 15.6 ± 0.5 | 2.5 | 14.5 ± 0.3 | 1.4 |
| Paprika | 14.5 ± 0.2 | 0.92 | 2.02 ± 0.08 | 3.1 |
| Black pepper | 12.4 ± 0.5 | 3.0 | 3.2 ± 0.2 | 4.0 |
| Cumin | 11.6 ± 0.4 | 2.9 | 8.8 ± 0.2 | 1.9 |
| Coriander | 7.8 ± 0.2 | 2.1 | 2.0 ± 0.1 | 4.4 |
| Red hot pepper | 6.8 ± 0.2 | 2.2 | 1.8 ± 0.1 | 5.7 |
In order to test the antioxidant properties of the extracts obtained, the reactions of individual phenolic antioxidants of spices with the electrogenerated oxidants were studied in Brij® 35 micellar medium.
3.2. Reactions of phenolic antioxidants with the electrogenerated oxidants in Brij® 35 micellar medium
The reactivity of individual phenolic antioxidants of spices with electrogenerated hexacyanoferrate(III), bromine and Ce(IV) ions in micellar media is an important parameter that is required for the evaluation of a spices' antioxidant properties.The main phenolic antioxidants of spices (rutin, quercetin, catechin, tannin, gallic, rosmarinic and hydroxycinnamic acids, curcumin, capsaicin, eugenol and thymol) were investigated. Their standard solutions were prepared in 0.1 mol L−1 Brij® 35. All the antioxidants under investigation interacted with the coulometric titrants (hexacyanoferrate(III), bromine and Ce(IV) ions) fast and quantitatively. The number of electrons participating in the reactions was calculated according to Faraday's law (Table 3). The data for hexacyanoferrate(III) ions correspond well to those reported earlier in Triton X100 micellar medium.16
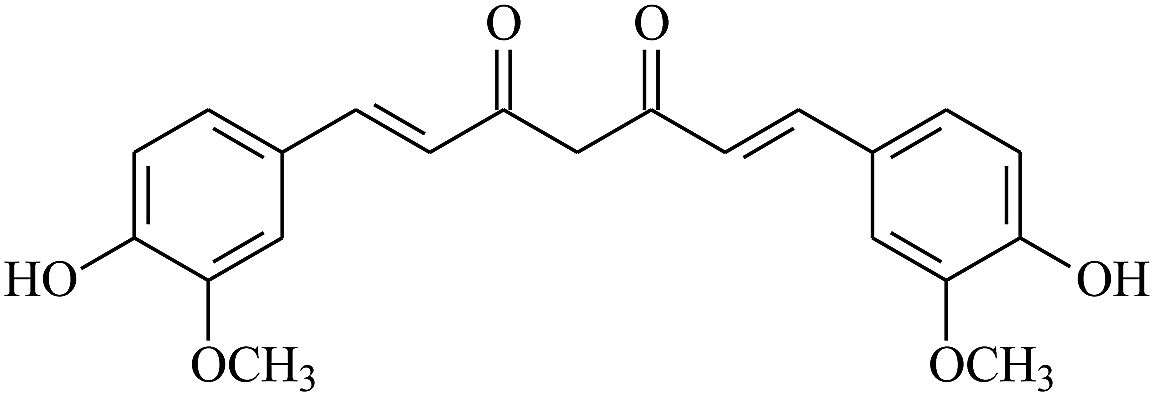
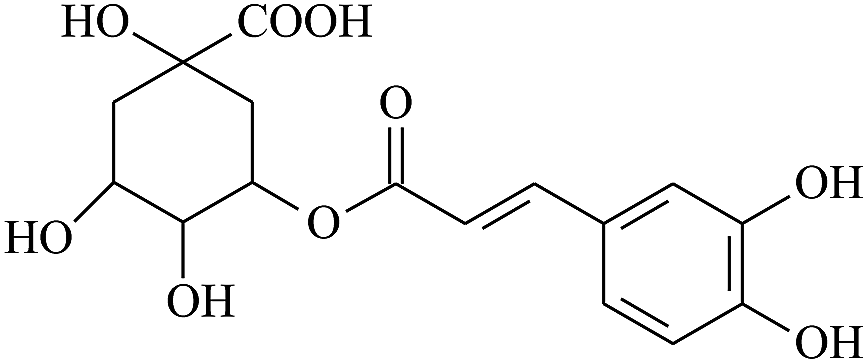
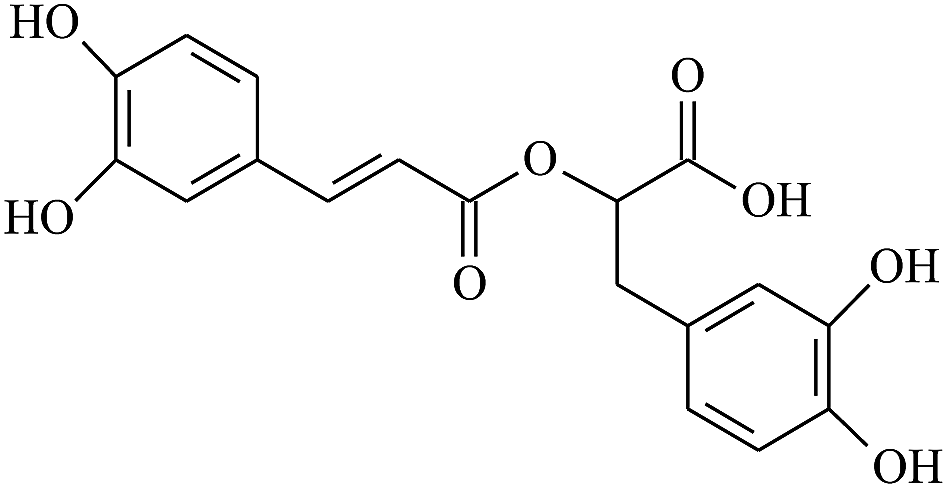
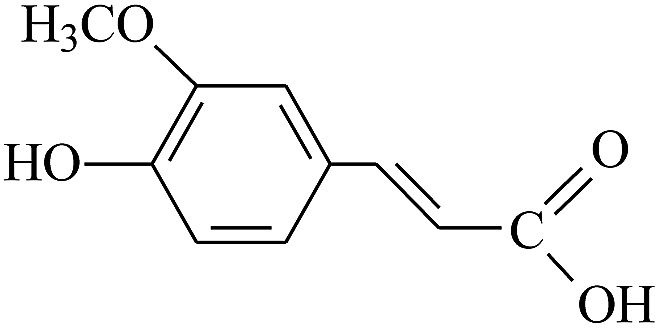
| Antioxidant | Structure | Number of electrons participating in the reaction | ||
|---|---|---|---|---|
| Fe(CN)63− | Br2 | Ce(IV) | ||
| Gallic acid |
|
4 | 4 | 3 |
| Tannin |
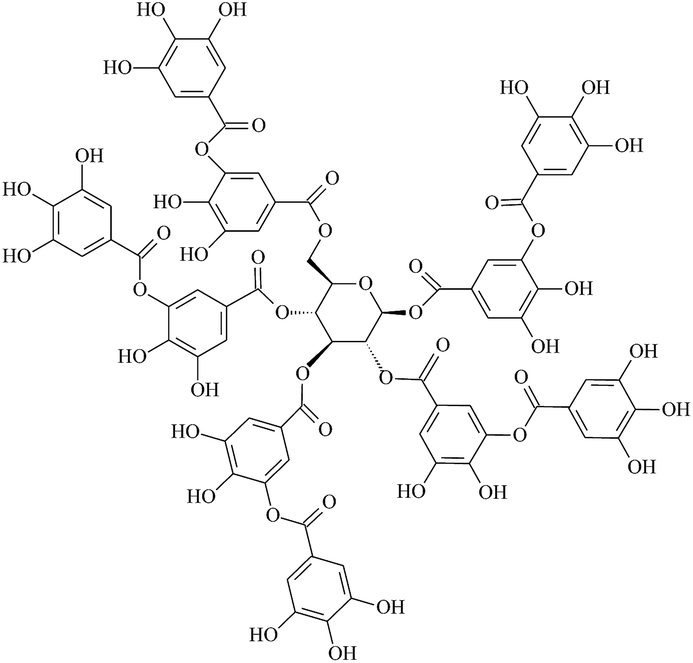
|
28 | 30 | 150 |
| Catechin |
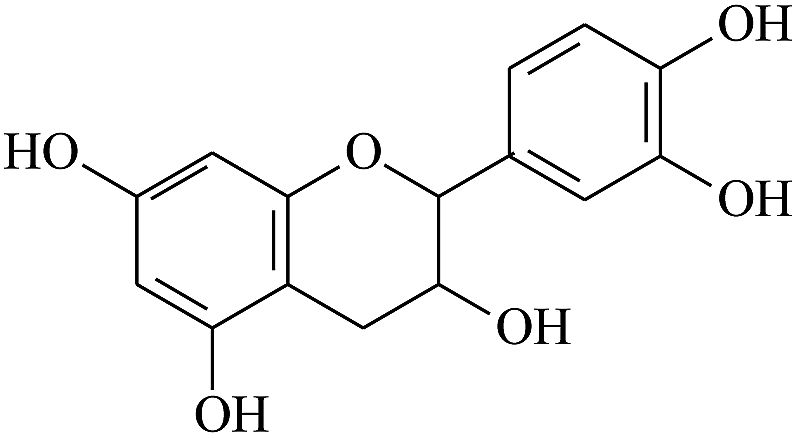
|
4 | 9 | 5 |
| Quercetin |
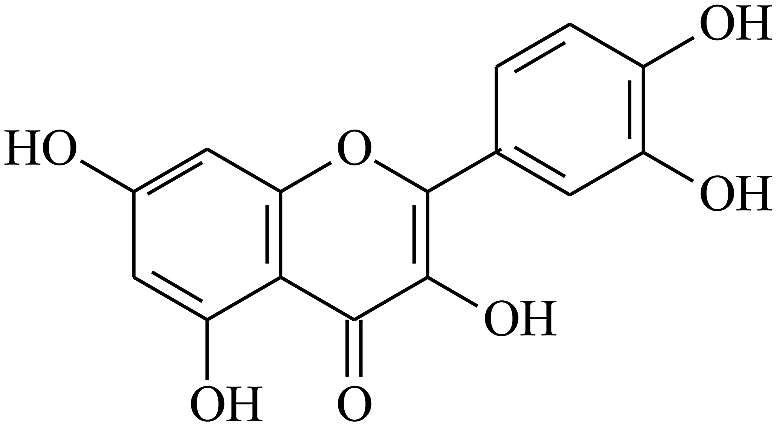
|
2 | 10 | 4 |
| Rutin |
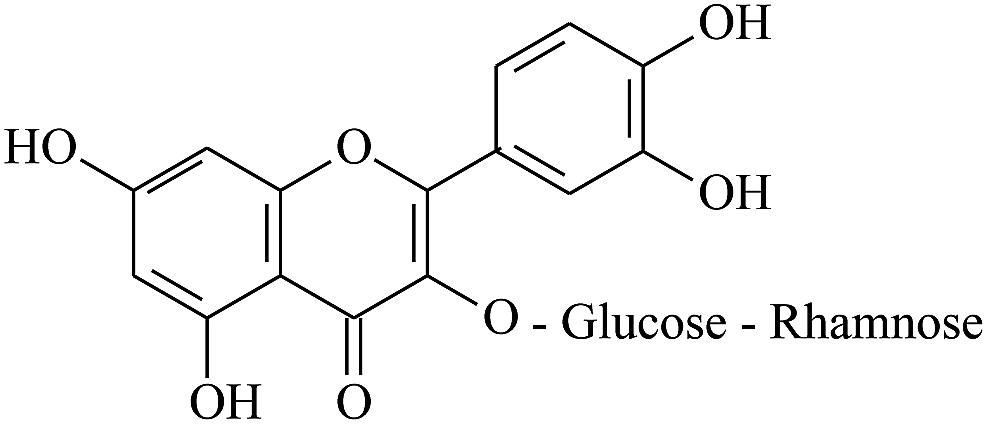
|
4 | 8 | 3 |
| Curcumin |
|
4 | 11 | 6 |
| Capsaicin |
|
1 | 6 | 6 |
| Thymol |
|
1 | 4 | 5 |
| Eugenol |
|
1 | 4 | 4 |
| p-Coumaric acid |
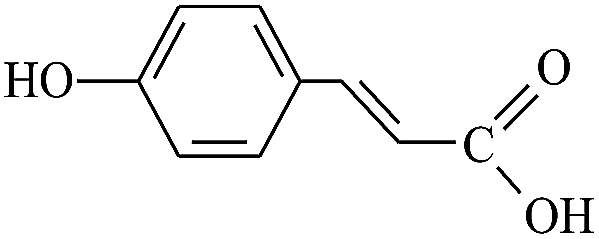
|
1 | 4 | 2 |
| Caffeic acid |
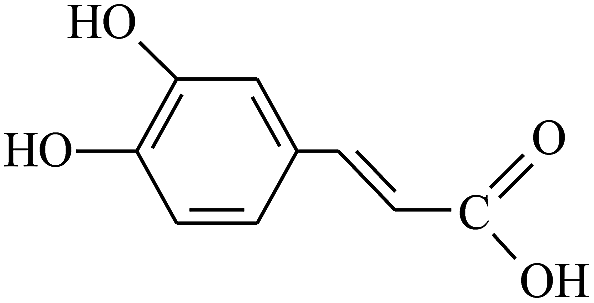
|
2 | 4 | 2 |
| Chlorogenic acid |
|
2 | 4 | 2 |
| Rosmarinic acid |
|
4 | 4 | 4 |
| Ferulic acid |
|
1 | 4 | 2 |
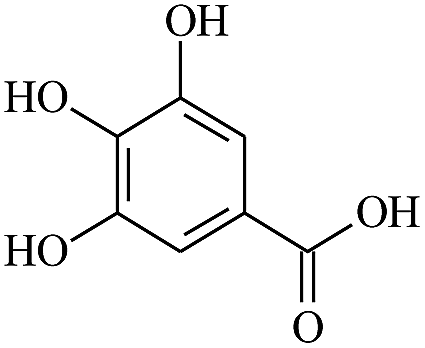
The electrogenerated hexacyanoferrate(III) ions react with hydroxyl groups of analyte molecules. The number of electrons participating in the reaction depends on the structure of compound. Thus, one electron is involved in reactions of monophenols (thymol and p-coumaric acid) as well as capsaicin, eugenol and ferulic acid, resulting in formation of the corresponding phenoxyl radical. Flavonoids are oxidized with participation of the aromatic hydroxyl groups. The glycoside moiety does not react with the titrant, as has been shown on example of rutin (quercetin glycoside). Chlorogenic, caffeic and rosmarinic acids are oxidized to the corresponding o- and di-o-quinones involving two and four electrons, respectively. In a basic medium under the air, gallic acid undergoes dimerization forming dehydrodigallic acid, which is then oxidized by hexacyanoferrate(III) ions to the corresponding di-o-quinone. As for curcumin, it is unstable in basic medium and is decomposed to form feruloylmethane and ferulic acid23 that react with the titrant too.
Electrooxidation of bromide ions in acidic medium leads to the formation of Br3−, Br2 and short-lived bromine radicals (Br˙el.) adsorbed on the generating electrode surface.19 These species can take part in radical and redox reactions, as well as electrophilic substitution and addition to multiple bonds. Therefore, a large number of electrons participate in the reactions of phenolic antioxidants with electrogenerated bromine. Moreover, further reactions of the primary products can also occur. Oxidation of hydroxyl groups with formation of the corresponding quinones probably occurs first. In the case of flavonoids (catechin, rutin, and quercetin), oxidation of hydroxyl groups of ring B takes place initially. Gallic acid is oxidized to o-quinone, which is unstable and may undergo further reactions, for instance, condensation and dimerization.
Electrogenerated Ce(IV) is the most powerful oxidant, providing very deep oxidation of the antioxidants under investigation. This is reflected by the number of electrons participating in the corresponding reactions. In the case of flavonoids and hydroxycinnamic acids, the oxidation of hydroxyl groups takes place with the formation of corresponding quinoid structures.
On the basis of data obtained, the coulometric titrants can be successfully applied for the evaluation of antioxidant properties of different samples in Brij® 35 micellar media.
3.3. Antioxidant properties of spices' micellar extracts
Coulometric titration with hexacyanoferrate(III) ions, bromine and Ce(IV) was used for the evaluation of spices' micellar extracts antioxidant properties via the total parameters FRP, TAC and CRAC, respectively. An important advantage of the total parameters is the possibility to consider a sample of complex matrix as a whole, excluding determination of each individual component. This approach also allows to take into account the synergetic or antagonistic effects of individual compounds that can usually take place in the case of polycomponent samples.The results of the evaluation of spices' micellar extracts antioxidant parameters are presented in Table 4. All the antioxidant parameters are found to vary significantly (P < 0.001) depending on the spices' nature. TAC and CRAC are significantly higher than FRP for all the samples investigated. This is caused by the reactivity of the titrants used, as well as the type of antioxidants extracted with Brij® 35 micellar medium. Moreover, different mechanisms of reactions occur depending on the titrant nature (see Section 3.2.). Cinnamon and clove are characterized by the highest FRP, TAC and CRAC among the spices tested, which corresponds well with their antioxidant activity24 and FRP reported earlier for Triton X100 micellar extracts.16 The FRPs of the spices studied agree with the total phenolics contents presented in the literature.24–26 The phenolic constituents of the spices are discussed in detail earlier.1,26,27 These are mainly phenolic acids and flavonoids as well as some specific phenolic antioxidants like malabaricones B and C in nutmeg28 or gingerols, shogaols, paradols and zingerone in ginger29etc.
| Spice | Spice/extractant ratio (w/v) | FRP/C g−1 | RSD/% | TAC/C g−1 | RSD/% | CRAC/C g−1 | RSD/% |
|---|---|---|---|---|---|---|---|
| Cinnamon | 1:30 |
174 ± 3 | 1.5 | 237 ± 9 | 2.9 | 443 ± 6 | 1.1 |
| Clove | 1:30 |
150 ± 3 | 1.6 | 429 ± 17 | 1.6 | 561 ± 8 | 1.1 |
| Oregano | 1:60 |
75 ± 3 | 3.2 | 81 ± 4 | 4.2 | 79 ± 4 | 4.6 |
| Basil | 1:40 |
39.7 ± 0.4 | 0.81 | 55 ± 2 | 2.2 | 53 ± 1 | 1.6 |
| Nutmeg | 1:20 |
21 ± 1 | 3.9 | 115 ± 3 | 2.1 | 219 ± 4 | 1.4 |
| Rosemary | 1:30 |
19.4 ± 0.5 | 2.1 | 22.6 ± 0.8 | 3.2 | 22.0 ± 0.8 | 1.6 |
| Ginger | 1:100 |
15.9 ± 0.2 | 0.94 | 53 ± 3 | 4.6 | 38.2 ± 0.4 | 0.42 |
| Black cardamom | 1:60 |
15.7 ± 0.9 | 5.1 | 56 ± 2 | 3.3 | 72 ± 2 | 1.8 |
| Turmeric | 1:60 |
15.6 ± 0.5 | 2.5 | 112 ± 7 | 5.1 | 192 ± 6 | 1.8 |
| Green cardamom | 1:80 |
15.5 ± 0.4 | 2.3 | 31 ± 2 | 6.4 | 69 ± 4 | 2.5 |
| Paprika | 1:110 |
14.5 ± 0.2 | 0.92 | 88 ± 4 | 1.8 | 26 ± 2 | 3.6 |
| Black pepper | 1:60 |
12.4 ± 0.5 | 3.0 | 61 ± 2 | 2.9 | 41 ± 3 | 2.9 |
| Cumin | 1:40 |
11.6 ± 0.4 | 2.9 | 37 ± 1 | 2.9 | 23.3 ± 0.5 | 1.7 |
| Coriander | 1:40 |
7.8 ± 0.2 | 2.1 | 55 ± 3 | 3.9 | 69.0 ± 0.9 | 0.80 |
| Anise | 1:30 |
7.3 ± 0.2 | 2.5 | 24 ± 1 | 3.6 | 41.6 ± 0.7 | 1.3 |
| Red hot pepper | 1:40 |
6.8 ± 0.2 | 2.2 | 84 ± 3 | 3.3 | 46.5 ± 0.5 | 0.85 |
| White pepper | 1:120 |
6.6 ± 0.3 | 3.5 | 57 ± 1 | 1.1 | 38 ± 2 | 2.6 |
| Star anise | 1:60 |
6.2 ± 0.3 | 4.4 | 49 ± 3 | 2.8 | 79 ± 1 | 1.1 |
| Caraway | 1:20 |
4.70 ± 0.06 | 1.0 | 14.2 ± 0.2 | 1.0 | 5.9 ± 0.3 | 1.8 |
| Black turmeric | 1:30 |
3.9 ± 0.2 | 4.1 | 30 ± 2 | 5.7 | 37.5 ± 0.6 | 1.2 |
Comparison of antioxidant parameters for spices' micellar extracts with their antioxidant activity towards DPPH˙ has been performed. Similar to the coulometric assay, the highest antioxidant activity has been observed for clove and cinnamon, which corresponds well to the data reported for organic extracts of these spices.24 Antioxidant activity towards DPPH˙ decreased as follows: basil < oregano < black pepper < nutmeg < rosemary ≈ coriander < star anise < anise. Other spices showed relatively low (<5%) antioxidant activity towards DPPH˙. These results can be explained by the reactivity of the spices' individual antioxidants towards DPPH˙. Some antioxidants do not interact, or react slowly or reversibly with the DPPH˙, which leads to falsely low values of antioxidant activity. The positive correlations (Fig. 4) between FRP, TAC and CRAC and antioxidant activity towards DPPH˙ have been obtained with r = 0.9502, 0.8676 and 0.8855 (rcrit = 0.444 at n = 20 and P = 0.95), respectively, which confirms the accuracy of the parameters obtained. Therefore, the coulometric method adequately reflects the antioxidant properties of spices' micellar extracts.
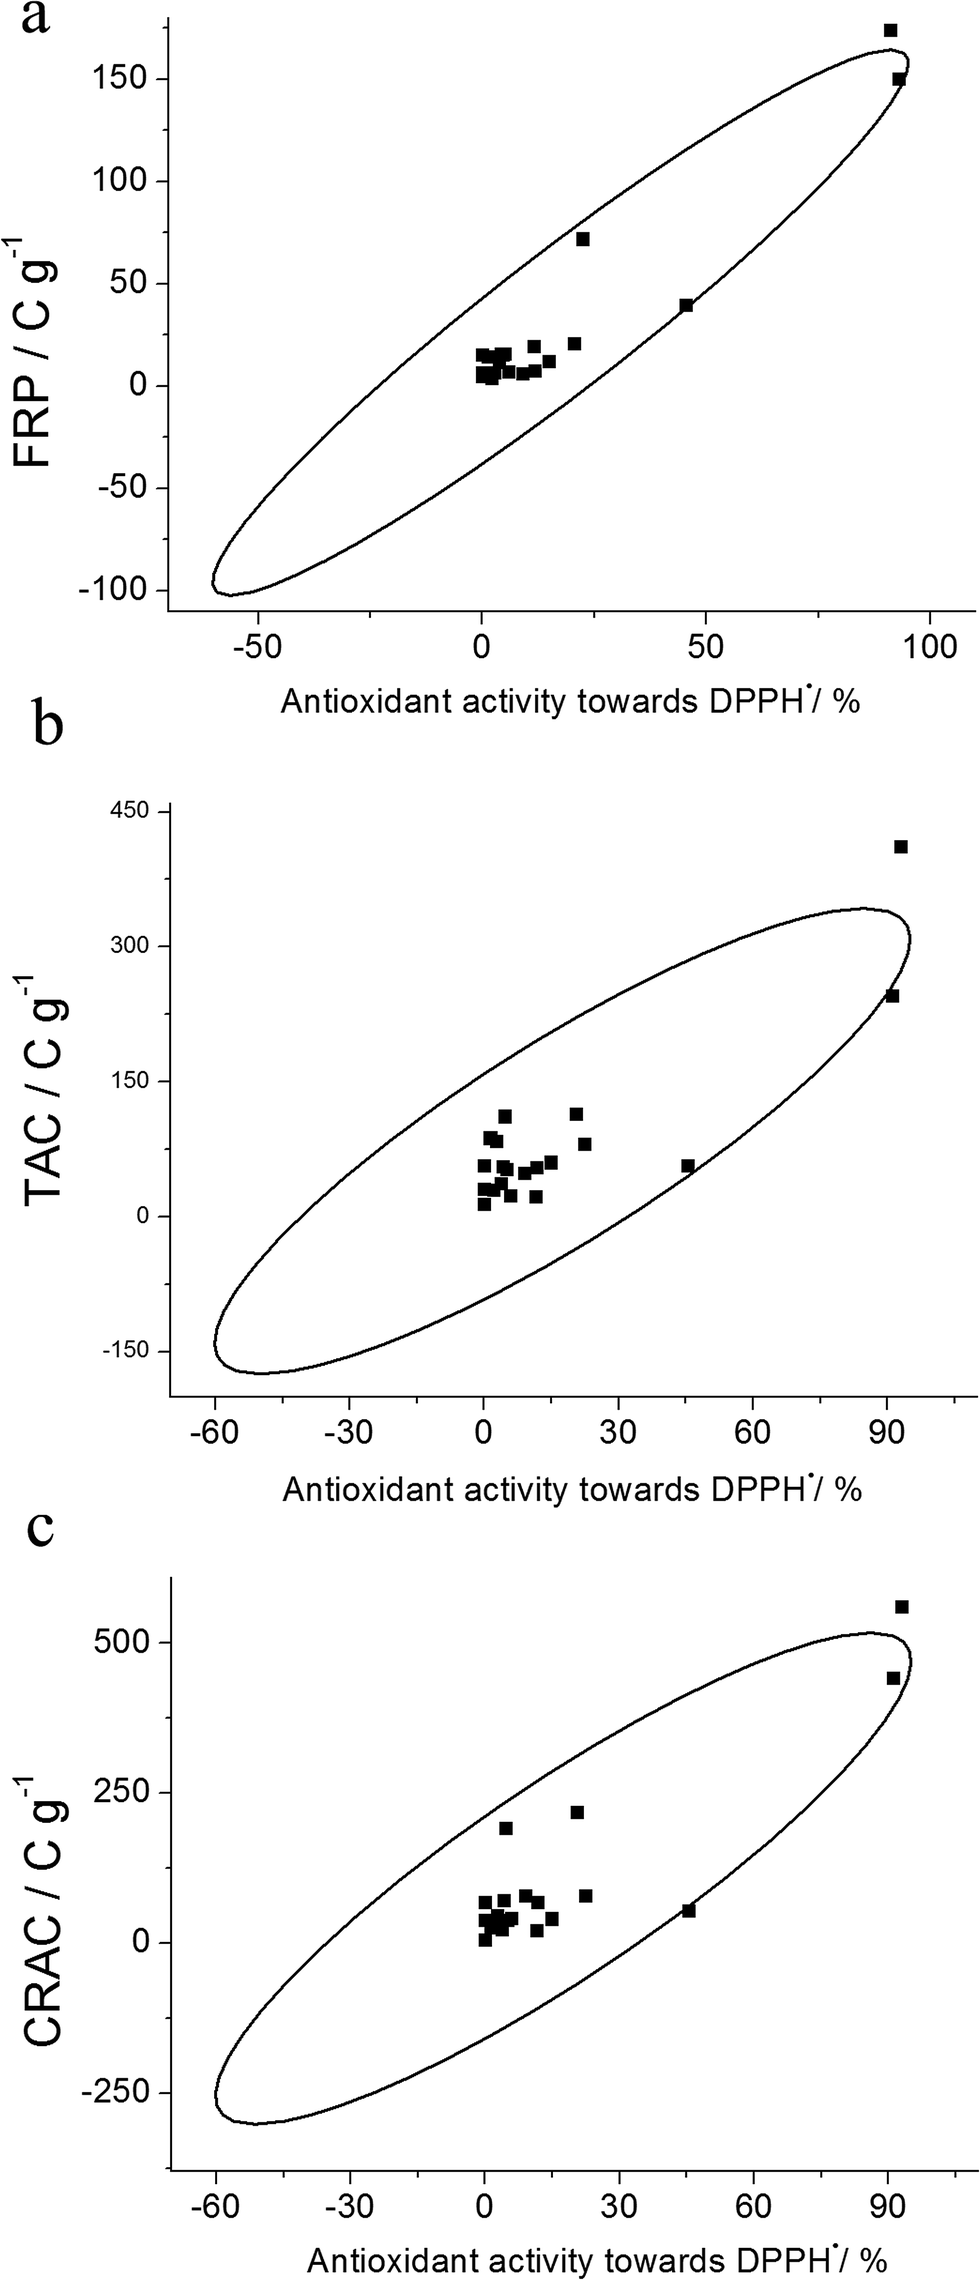 | ||
| Fig. 4 Correlation plots for FRP (a), TAC (b) and CRAC (c) of spices micellar extracts vs. antioxidant activity towards DPPH˙. | ||
4. Conclusions
Phenolic antioxidants of spices are dissolved in micellar media and their antioxidant properties are retained. The surfactant micellar media in combination with ultrasound treatment can be successfully applied as an alternative extractant, providing high yield of phenolic antioxidants and avoiding organic solvents usage. The highest recovery of phenolic antioxidants was achieved using nonionic surfactant Brij® 35. The application of ultrasound-assisted extraction significantly reduces the time and solvent consumption. The approach developed is simple, green, cheap, rapid and reliable, which allows its use for the extraction of active principals from spices and other plant materials.Acknowledgements
This work was funded by the subsidy allocated to Kazan Federal University for the project part of state assignment in the sphere of scientific activities.References
- M. Suhaj, J. Food Compos. Anal., 2006, 19, 531–537 CrossRef CAS.
- L. Calucci, C. Pinzino, M. Zandomeneghi, A. Capocchi, S. Ghiringhelli, F. Saviozzi, S. Tozzi and L. Galleschi, J. Agric. Food Chem., 2003, 51, 927–934 CrossRef CAS PubMed.
- K. Vilkhu, R. Mawson, L. Simons and D. Bates, Innovative Food Sci. Emerging Technol., 2008, 9, 161–169 CrossRef CAS.
- Y. Picó, TrAC, Trends Anal. Chem., 2013, 43, 84–99 CrossRef.
- L. Wang and C. L. Weller, Trends Food Sci. Technol., 2006, 17, 300–312 CrossRef CAS.
- M. Vinatoru, Ultrason. Sonochem., 2001, 8, 303–313 CrossRef CAS PubMed.
- A. Paduano, N. Caporaso, A. Santini and R. Sacchi, J. Food Res., 2014, 3, 51–59 CrossRef CAS.
- Y. Ma, X. Ye, Y. Hao, G. Xu, G. Xu and D. Liu, Ultrason. Sonochem., 2008, 15, 227–232 CrossRef CAS PubMed.
- M. K. Khan, M. Abert-Vian, A.-S. Fabiano-Tixier, O. Dangles and F. Chemat, Food Chem., 2010, 119, 851–858 CrossRef CAS.
- T.-B. Zou, M. Wang, R.-Y. Gan and W.-H. Ling, Int. J. Mol. Sci., 2011, 12, 3006–3017 CrossRef CAS PubMed.
- C. Da Porto, E. Porretto and D. Decorti, Ultrason. Sonochem., 2013, 20, 1076–1080 CrossRef CAS PubMed.
- M. Dent, V. Dragović-Uzelac, I. Elez Garofulić, T. Bosiljkov, D. Ježek and M. Brnčić, Chem. Biochem. Eng. Q., 2015, 29, 475–484 CrossRef CAS.
- G. K. Ziyatdinova, E. R. Ziganshina and H. C. Budnikov, J. Anal. Chem., 2012, 67, 869–879 CrossRef CAS.
- P. Wang, D. Meng, C. Liu and Y. Yang, J. Chem. Soc. Pak., 2013, 35, 1268–1274 Search PubMed.
- K. Wu, Q. Zhang, Q. Liu, F. Tang, Y. Long and S. Yao, J. Sep. Sci., 2009, 32, 4220–4226 CrossRef CAS PubMed.
- G. K. Ziyatdinova, F. N. Cong and H. C. Budnikov, J. Anal. Chem., 2015, 70, 974–982 CrossRef CAS.
- G. Ziyatdinova, A. Nizamova and H. Budnikov, Food Anal. Methods, 2011, 4, 334–340 CrossRef.
- G. Ziyatdinova, E. Ziganshina and H. Budnikov, Anal. Chim. Acta, 2012, 744, 23–28 CrossRef CAS PubMed.
- G. K. Ziyatdinova, H. C. Budnikov, V. I. Pogorel'tzev and T. S. Ganeev, Talanta, 2006, 68, 800–805 CrossRef CAS PubMed.
- J. J. Lingane, Electroanalytical Chemistry, Interscience, New York, 1958 Search PubMed.
- W. Brand-Williams, M. E. Cuvelier and C. Berset, LWT--Food Sci. Technol., 1995, 28, 25–30 CrossRef CAS.
- T. Oya, T. Osawa and S. Kawakishi, Biosci., Biotechnol., Biochem., 1997, 61, 263–266 CrossRef CAS PubMed.
- Curcumin, Chemical and Technical Assessment (CTA), 61st JECFA, 2004 Search PubMed.
- V. A. Parthasarathy, B. Chempakam and T. J. Zachariah, Chemistry of Spices, CABI, 2008 Search PubMed.
- D. J. Charles, Antioxidant Properties of Spices, Herbs and Other Sources, Springer, New York, 2013 Search PubMed.
- B. Shan, Y. Z. Cai, M. Sun and H. Corke, J. Agric. Food Chem., 2005, 53, 7749–7759 CrossRef CAS PubMed.
- M. E. Embuscado, J. Funct. Foods, 2015, 18, 811–819 CrossRef CAS.
- J. P. Hou, H. Wu, Y. Wang and X. C. Weng, Czech J. Food Sci., 2012, 30, 164–170 CAS.
- P. A. Vasala, in Handbook of Herbs and Spices, ed. K. V. Peter, CRC Press, Boca Raton, 2004, vol. 1, pp. 195–206 Search PubMed.
| This journal is © The Royal Society of Chemistry 2016 |