
 Open Access Article
 This Open Access Article is licensed under a
 Creative Commons Attribution 3.0 Unported Licence
Metrics for green analytical chemistry
Marek
Tobiszewski
Department of Analytical Chemistry, Chemical Faculty, Gdańsk University of Technology (GUT), 11/12 G. Narutowicza St., 80-233 Gdańsk, Poland. E-mail: marektobiszewski@wp.pl
First published on 4th March 2016
Abstract
Green analytical chemistry, although not being a new concept, does not have a greenness metrics system. Green chemistry metrics are not suitable for analytical procedure assessment because they often refer to the mass of the product. Some efforts have been made to develop suitable metrics for analytical chemistry. Some are simple to use but do not cover all aspects of analytical methods’ environmental impact. Others are more comprehensive but may be difficult to be applied. The analytical reagents were not assessed but some clues about their greenness can be obtained from assessments from other branches of chemistry. New reagents and solvents applied in analytical chemistry require their detailed assessment in terms of greenness. Environmental issues have to be taken into consideration during reagent and solvent selection, analytical waste disposal practices, the energetic requirements of analytical processes and the development or selection of analytical procedures, and, for that reason, metrics systems are required.
1. Introduction
Green analytical chemistry is the philosophical movement that incorporates sustainable development values to analytical laboratories.1 There are many ways of introducing the GAC concept, the most important ones are the miniaturization of the sample preparation techniques2 and final determination devices,3 the application of solventless extraction techniques4 and the introduction of less toxic solvents.5 These practices are well established and are common practice in scientific and academic laboratories.It is a well established practice that during analytical procedure development performance merits are considered, such as LOD, recovery, precision, and linear range. It should be noted that also green analytical chemistry aspects should point the direction in procedure development. It has been shown that with analytical procedure selection based on different aspects – analytical performance, green analytical chemistry values and economic costs – different results in terms of preferable analytical methods may be obtained.6 It is clear that during analytical method selection all of these factors have to be considered.
2. Analytical process in the light of green chemistry
A simple question can be asked: why bother about the environmental impact of analytical laboratories? In the common sense there is an opinion that the impact of analytical chemistry is small compared to pharmaceutical or petrochemical industries. The main reasons why this problem is important and urgent are listed below:One typical liquid chromatograph generates more than 1 L of organic waste daily; it is estimated that 130![[thin space (1/6-em)]](https://www.rsc.org/images/entities/char_2009.gif) 000 are in operation, which gives the considerable amount of 34 million litres annually.7 This amount of solvent waste is from the operation of liquid chromatographs only. The waste originating from sample preparation should be added to this number.
000 are in operation, which gives the considerable amount of 34 million litres annually.7 This amount of solvent waste is from the operation of liquid chromatographs only. The waste originating from sample preparation should be added to this number.
Analytical chemistry emissions, because of the number of analytical laboratories, are very dispersed in terms of locations. The control of this kind of pollution is hard to be performed.
Green analytical chemistry is analytical chemists' contribution to the concept of sustainable development. All specialists should introduce sustainability values to their activities and fields of expertise.
The E-factors of typical processes in different branches of chemistry vary from 0.1 for oil refining to 100 for pharmaceutical production8 and even 100000 for nanomaterial synthesis.9 The E-factor is calculated by giving the mass of generated waste per mass of obtained product, usually expressed in kg waste per kg product.
The calculated E-factor for analytical chemistry tends to infinity. The product of the analytical process is the result that does not have weight, so the mass of the product is zero. But obtaining the analytical results requires material inputs that become waste. It is a good presentation that analytical chemistry is environmentally troublesome and there is a potential wide field for activities to reduce its environmental impact.
To show how complex the environmental impact of analytical procedures can be, it is convenient to use the Ishikawa or fishbone diagram, well known to analysts. As an example, a generic liquid chromatographic method with sample preparation based on extraction will be investigated.10Fig. 1 presents the Ishikawa diagram of the factors influencing the performance of the method. Fig. 2 shows the Ishikawa diagram of the environmental impact of the same procedure. It should be noted that all steps of the procedure contribute to the total quality of the analytical result. Similarly, all activities build the total environmental impact. Material and energetic inputs are presented. As it was stated before, the material inputs to obtain the result of the analysis become waste.
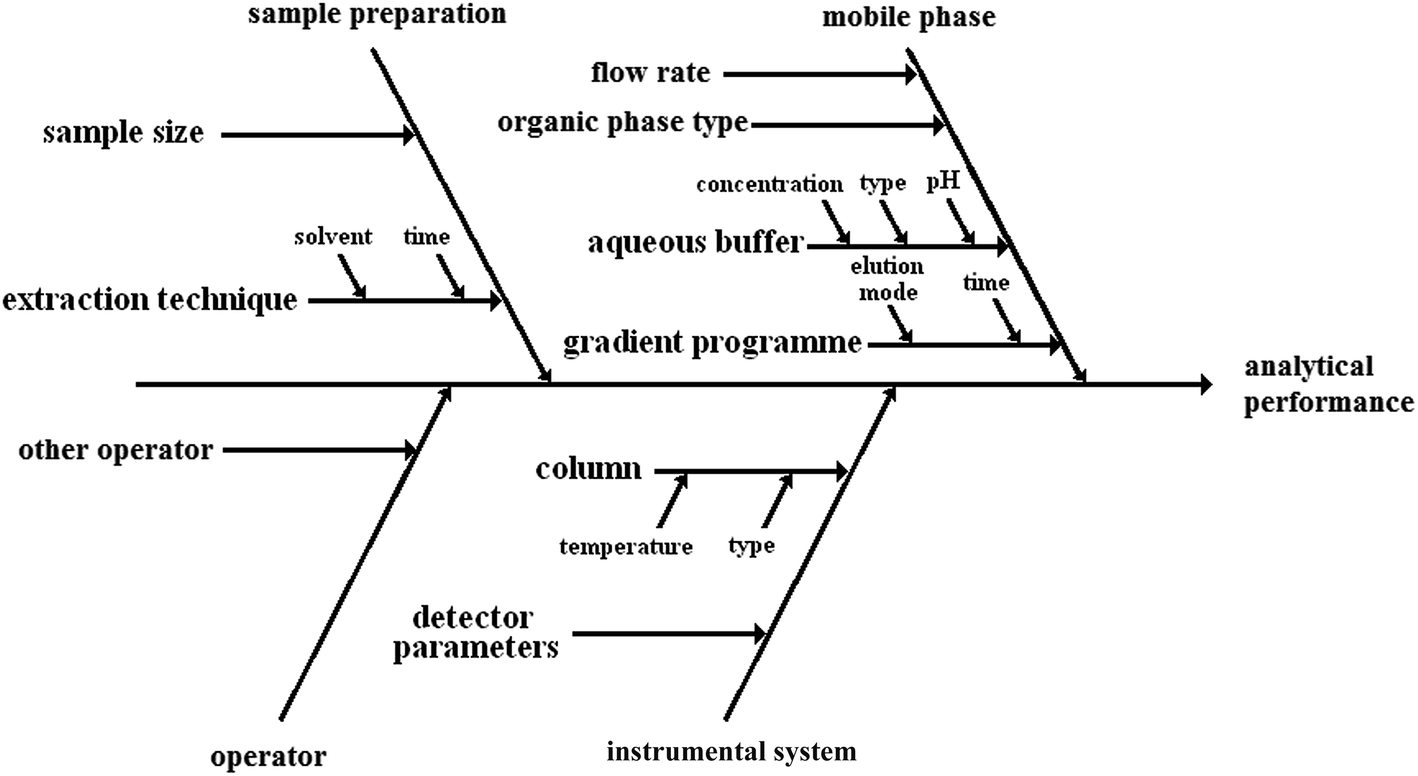 | ||
| Fig. 1 Ishikawa diagram showing the factors influencing the analytical performance of a generic LC method. Modified from Sun et al., (2015).10 | ||
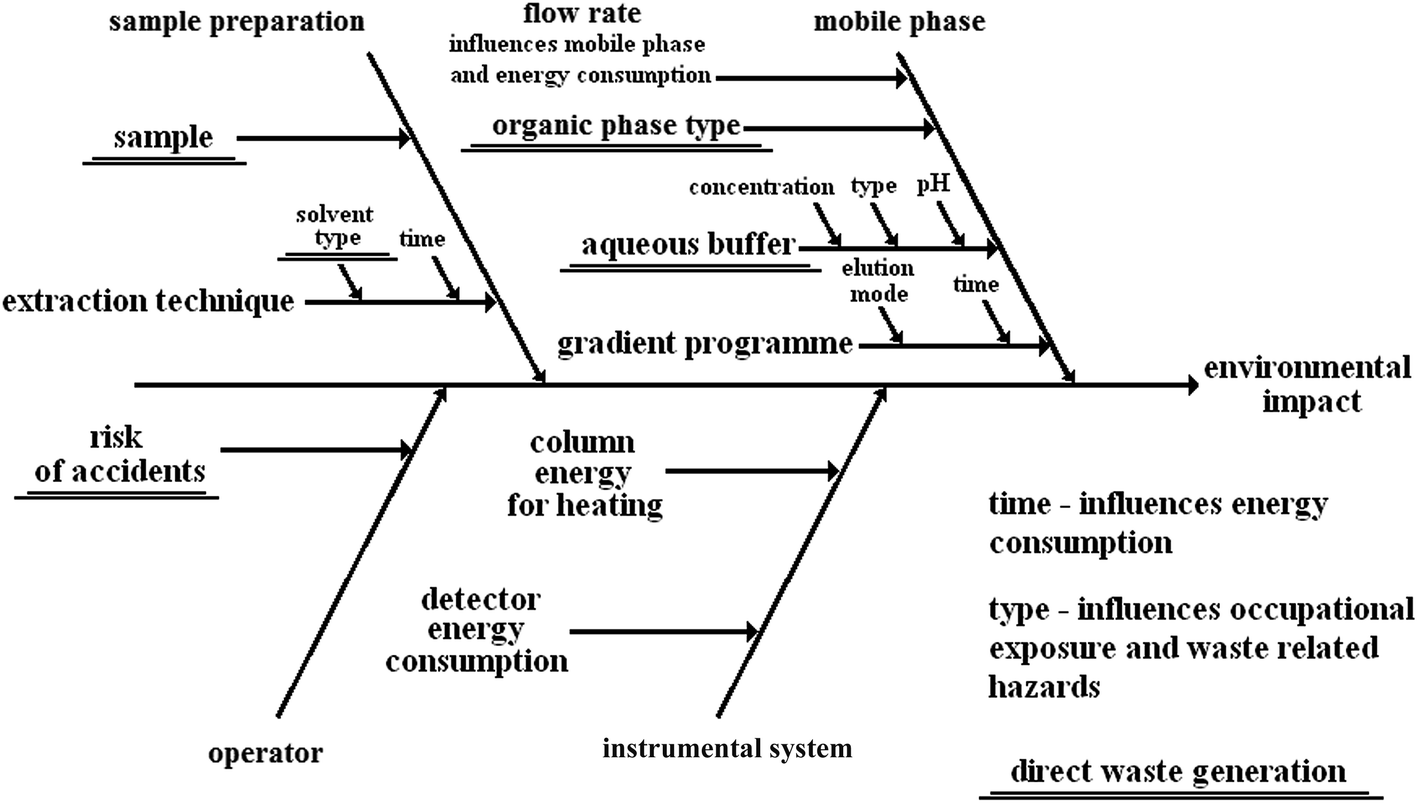 | ||
| Fig. 2 Ishikawa diagram presenting the environmental impact of a generic LC method. | ||
3. Green analytical chemistry without metrics?
A recent article states a very important question: “Do we need green analytical chemistry?”11 As the answer to this question seems to be positive, it is important to state another, naturally occurring question: “How to measure the greenness of analytical methods ?” One of the main GAC problems is that there are no well-established methods of “greenness” assessment. There is a significant gap in green analytical chemistry as a scientific area. In the literature, there are numerous examples of analytical procedures that are claimed to be green by their authors. Unfortunately, it is a common practice that such statements are not supported by any evidence, in the form of applied greenness metrics, and comparisons with previously developed analytical or standard procedures. The statements of procedure greenness are often based on the authors’ impressions or uncertain assumptions. There are some examples from the literature where this kind of reasoning is absolutely wrong.Although the example does not refer to analytical chemistry, some interesting conclusions can be made from the comparison of preparative HPLC and SFC methodologies applied in the pharmaceutical industry.12 The intuitive comparison result (as it was stated before, intuition is so far the most commonly used greenness assessment tool) would indicate that preparative SFC strongly prevails over preparative HPLC in terms of greenness. For traditional material efficiency, SFC is indeed 26.3% better than HPLC. However, if energy is considered HLPC is 34.3% better than SFC. This is because of the huge energetic demand for heating and cooling in SFC.
Green chemistry has some already developed metrics systems.13 Atom economy, environmental impact factor, and reaction mass efficiency are the most common tools to assess the greenness of chemical reactions, applicable in organic synthesis.14 Other tools can be more branch specific, like in the case of the fragrance15 or pharmaceutical16 industries. As these metrics refer to the mass of the reaction product,17 it is impossible to apply them directly in green analytical chemistry. In this case the metrics can refer to energetic and material inputs and can be calculated “per analytical result”.18
4. Overview of the developed metrics
There are just few published and universal methods for greenness assessment of analytical procedures. The first one is NEMI labelling19 that results in a very simple to read pictogram stating if hazardous or corrosive reagents are used or procedure generates significant amounts of wastes. The respective part of the NEMI pictogram is coloured green if:The reagents are not persistent, bioaccumulative and toxic. None of the reagents or solvents used during the analytical procedure are not present on the EPA's TRI list.
The reagents applied in the procedure are not hazardous. They are not present on the respective Resource Conservation and Recovery Acts lists.
The environment during the sample treatment and analysis remains noncorrosive. The pH is not less than 2 and not higher than 12.
The amount of waste generated during the whole analytical procedure is less than 50 g.
An example of a NEMI pictogram is presented in Fig. 3. Assessment of an analytical procedure with NEMI is problematic as it involves excessive searches for every reagent used, to be present in lists with toxic, hazardous or persistent chemicals. What is more, the result of the analysis is qualitative only; it does not carry any information about the quantity of hazards. However the NEMI pictogram approach is one of the very first approaches to green analytical chemistry metrics.
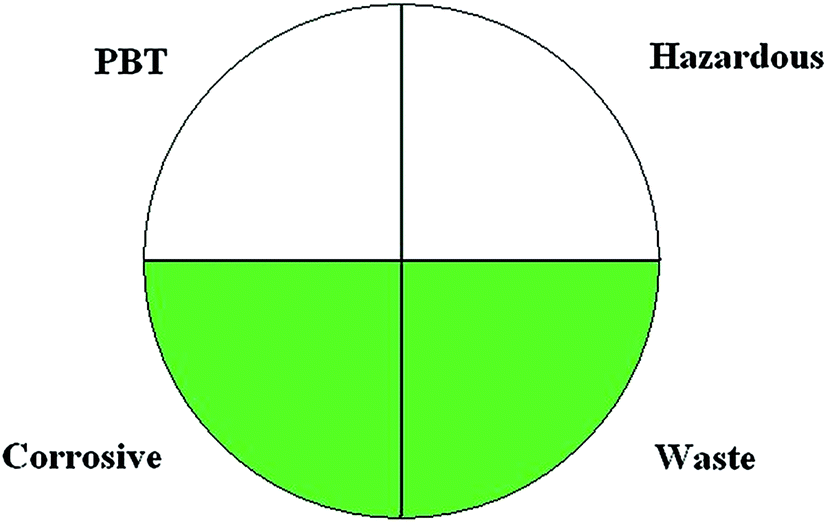 | ||
| Fig. 3 The example of the assessment score with the NEMI procedure. | ||
The second assessment procedure is the Analytical Eco-scale,20 which involves more environmental impact parameters than NEMI. The eco-scale assessment procedure is based on penalty points subtracted from a base of 100. The penalty points are given for each reagent type and amount that may cause environmental problems, potential occupational exposure of the analyst, the amount of energy consumed by the electrical devices and the way of analytical waste treatment (and more importantly the lack thereof).
The approach to scoring reagents is very intuitive. A penalty point is given for every hazard pictogram that corresponds to a chemical. Additionally, if the chemical is described with the word “danger”, the number of hazard pictograms is multiplied by two, while the score does not change when the chemical is described with the word “warning”. The number of penalty points related to the chemical hazards are multiplied by the amount of the chemical. If the amount of a reagent or solvent is less than 10 mL or 10 g the hazard score is multiplied by 1, in case of an amount of 10–100 mL (g) and above 100 mL or 100 g the multiplication factors are 2 and 3, respectively. The emission of vapours to the air during the analytical process is additionally punished by 3 penalty points. The generation of waste in the amount less than 1 mL or 1 g results in 1 penalty point; waste generated in a 1–10 mL or 1–10 g amount results in assigning 3 penalty points, whereas greater amounts of generated waste give 5 penalty points. If the waste is not treated in any way, 3 additional points are given.
The penalty points related to the chemicals21 used are easily available as hazard pictograms are placed on the containers of chemicals. The information about hazard pictograms are also placed in safety sheets which additionally increases the availability of information. The result of scoring is easy to read, gives ease of comparison of the different analytical methodologies. On the other hand, the important drawback of this approach is that the score does not carry any information about the structure of the hazards. In this sense the Eco-scale score cannot be applied to identify the weak aspects of the procedure to improve it. Another disadvantage is that the assessment procedure considers hazards in semi-quantitative way.
As the two previously mentioned assessment techniques are for assessment of any analytical procedure, HPLC-EAT (environmental assessment tool) is dedicated to the assessment of liquid chromatographic procedures in terms of mobile phase consumption and its disposal.6 The assessment involves summing the safety, health and environmental hazards of all solvents used in the procedure. The HPLC-EAT tool was validated with the results of solvent scoring with GSK's solvent selection guide. The drawback of this assessment approach is that it considers only one aspect of potential environmental impact – solvents.
For every analyte and matrix, there are at least a few analytical procedures developed. For some of analytes that are well characterized, there are dozens of procedures available. For example, searches in the databases show that there are more than 40 procedures for chloroorganic pesticide determination in water samples or polycyclic aromatic hydrocarbons in bottom sediments. One can take benefit from this fact and apply an approach that is based on the comparison of procedures within such a set.
The first of the approaches is based on a well-known tool in chemistry, which is multivariate statistics. The aim of the analysis is to group the analytical procedures according to similarity. If the variables applied to describe the analytical procedures refer to their greenness or environmental impact, chemometrics can be used in green analytical chemistry metrics. The relatively simple chemometric techniques, such as cluster analysis and principal component analysis can be successfully applied to group analytical procedures.22 More advanced chemometric tools, such as self-organizing maps (SOMs), give more valuable results since they allow the identification of outlying objects that are usually the greenest or least green ones. SOMs allow to easily distinguish between positive and negative correlation between variables.23 The results of assessment with self-organizing maps are in agreement with the NEMI and Eco-scale assessment results.24 Apart from grouping according to greenness, the results can often reveal other interesting dependencies in the set. As an example, the results show that number of analytes determined in a single chromatographic run is not correlated with any other variable, it means that it is independent from the procedural material and energetic inputs.
A less known tool in chemistry is the multicriteria decision analysis (MCDA).25 Contrary to the chemometrics approach, where grouping is performed, it allows the ranking of analytical procedures according to their greenness. The general scheme of application of MCDA methods can be presented in several steps.26 After stating the goal of the analysis, quantitative criteria (analytical performance, greenness criteria) are chosen that describe the goal. The next step is the identification of possible alternatives to reach the goal; in the case of analytical chemistry, the assessment alternatives can be different analytical procedures. As the criteria are not always of the same importance, each criterion is given a weight. Then the proper MCDA algorithm is applied and the ranking of alternatives – analytical methodologies is obtained. The main advantages of MCDA are the translation of many criteria into a single, easy to interpret score and the simultaneous assessment of multiple analytical procedures.
One of the MCDA tools is the Technique for Order of Preference by Similarity to Ideal Solution.27 TOPSIS was applied to assess the set of analytical methodologies for pharmaceutical determination in wastewater samples.28 The nineteen analytical methodologies were described with eight criteria, mainly describing the analytical performance and greenness. Most of the procedures were based on the solid phase extraction technique and one of them was selected as being the most appropriate. What is interesting is that its performance was the best only in the multianalyte analysis; with the other criteria the procedure performed well but was not the best. This first choice procedure involved the utilization of a small amount of methanol, which is considered as being less harmful compared to dichloromethane or hexane.
The second MCDA tool applied as a green analytical chemistry metric is the Preference Ranking Organization Method for Enrichment Evaluation (PROMETHEE).29 Similarly to TOPSIS, it is an outranking method with a full ranking on alternatives as an output. It has been applied to assess 25 methodologies for chloroorganic pesticide determination in water samples with 9 input criteria.30 The ranking results showed that the procedure based on SPME followed by GC-ECD was characterized with the best overall performance. It is worth mentioning that the ranking results in this study were in agreement with the Eco-scale results and did not show any correlation with the NEMI results. Analytical methods highly ranked with PROMETHEE were also highly scored with the Eco-scale assessment procedure.
When standard methods are assessed with any kind of metrics, it occurs that these methods are not green. It is absolutely wrong, that green analytical chemistry principles are not considered during standard method development. They are used in commercial analytical laboratories, they are applied in all routine analyses. The bulk of reagents, solvents as well as emissions and wastes come from the application of standard methods. The possibility to base the assessment on various criteria and the possibility to obtain information on how experts value each criterion makes MCDA an attractive tool in standard analytical method assessment or even selection.31 Apart from the greenness and typical analytical parameters, the costs of reagents and the presence or lack of sophisticated equipment were included as input criteria. The simplicity of the assessment of the relative importance of the criteria allows the obtaining of data from many analysts, which can be the basis of an environmentally friendly standard method selection.
5. Metrics for analytical reagents
Although the previously described metrics systems consider in their algorithms the environmental issues related to reagents and solvents, they need dedicated assessment approaches. Environmentally assessed chemicals give the possibility of proper choices at the level of procedure optimization, identification and replacement of particularly harmful chemicals.One of the main environmental problems in analytical chemistry is the need to apply solvents. As the application of solventless techniques32 is not always possible, solvents have to be chosen with environmental consciousness. There are solvent selection guides, developed by pharmaceutical companies33–35 that may give some clues for optimization methods in terms of solvents. All of these solvent selection guides are based on environmental, health and safety criteria. The results of the assessment is the categorization of the solvent as “recommended”, “recommended or problematic?”, “problematic”, “problematic or hazardous?”, “hazardous” and “highly hazardous”. Generally, “recommended” solvents are water, alcohols and some of the esters. Hazardous or highly hazardous are hydrocarbons, chlorinated solvents and some of the ethers. There are some efforts to combine them into one guide and to include “less common” solvents.36 The advantage of the application of these solvent selection guides is that it is easy to interpret the assessment result. The main disadvantage is that these results are available for limited amounts of solvents. Another approach is to use a solvent selection guide based on the previously described MCDA and grouping chemometric tool.37 Cluster analysis grouped 151 solvents into three clusters according to their similarity in terms of properties – the first one and the least green one consisting of “nonpolar and volatile” solvents, the second one intermediate in terms of greenness, “nonpolar and nonvolatile” solvents and the third one, consisting of greener “polar” solvents. Within every group, a detailed ranking was performed with TOPSIS. Contrary to other solvent selection guides, this one is the most flexible, as it allows user to choose solvents for the analysis, and the assessment criteria and set their relative importance. This gives the possibility to adjust the analysis conditions to the given analytical problem. On the other hand, it requires some knowledge from the user to perform the ranking reasonably. Fig. 4 summarized the greenness of commonly used solvents in analytical applications.
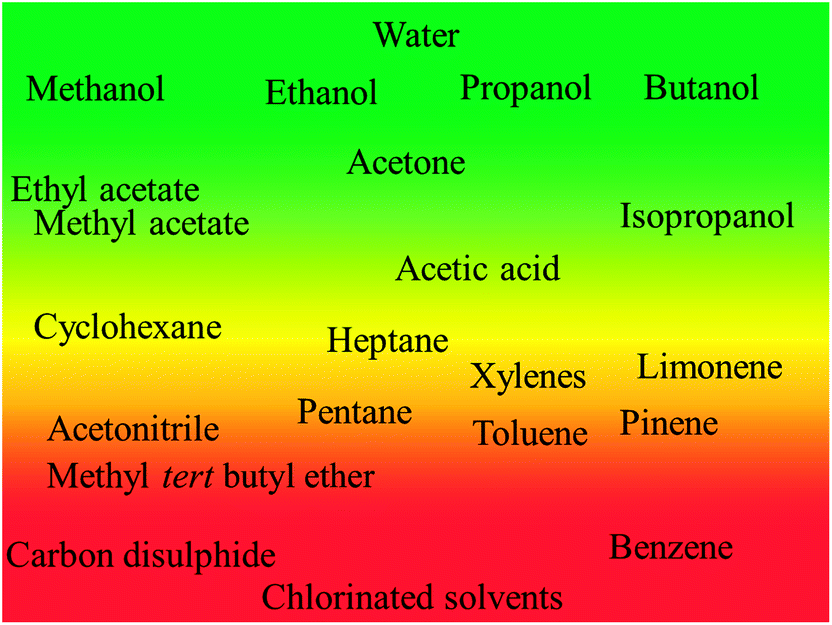 | ||
| Fig. 4 The scheme showing greenness of solvents commonly used in analytical chemistry. Based on solvent selection guides.35–39 | ||
For solvent waste, it is important to establish good disposal practices. The comparison of solvent distillation vs. incineration with the life cycle analysis (LCA) was performed.38 For most of the solvents included in the analysis, it is beneficial to perform distillation. Spent solvents widely applied in analytical chemistry, such as acetonitrile, tetrahydrofuran, acetone, acetic acid cyclohexane or toluene, should be recycled via distillation. Analytical solvent wastes originating from application of methanol, ethanol, pentane, hexane or heptane should be treated by incineration.
The scoring system of the analytical methods in terms of solvent consumption was developed.39 The tool is based on a system scoring industrial chemicals.40 Each solvent is given a score (the lower the more environmentally friendly the solvent is) calculated by the multiplication of the sum of the toxicological hazards with the sum of the exposure factors. In this sense it is a risk-based assessment of solvents.41 Solvent scores can be used to calculate the procedural impact by multiplying with the unit of solvent volume, the most convenient one being the millilitre. The disadvantage of this metrics system is that it refers only to one aspect of the environmental impact of analytical methods. Other approaches to assess traditional solvents were not focused on analytical applications. The results of persistence and special range indicators show that common analytical reagents are rather not persistent in the environment.42
The trend in solvent application in analytical chemistry is to apply new types of solvents, such as bio-based ones,43 deep-eutectic solvents44 or ionic liquids.45 Ionic liquids found different applications in analytical chemistry but they are mainly applied in various types of extraction processes.46 They are (or maybe were?) considered as green solvents. Their unwavering green status was questioned since it occurred that some of them were toxic to humans and to aquatic organisms.47 Such conclusions were possible to be drawn because of the consideration of different aspects of the application of ionic liquids. Detailed assessment studies should be performed before applications as solvents in analytical applications.
Similarly to ionic liquids, bio-base solvents are considered to be green alternatives to more traditional ones. The typical solvents used in laboratories, such as methanol or acetone can be derived from the lignocellulose feedstock.48 LCA results show that the greenness of lignocellulose-derived solvents vary from case to case, depending mainly on the geographical region. In analytical chemistry, limonene found its application to extract fats and oils with the Soxhlet apparatus. Limonene is a by-product from the citrus industry, obtained via azeotropic distillation, so it is considered as a renewable resource.49 Limonene gave similar extraction efficiencies to hexane. It was stated that limonene is a green solvent and hexane is not but it is not supported by any metrics, only with statement about the higher hexane toxicity. In fact, solvent selection guides state that hexane and limonene are not green, but limonene is a greener alternative for hexane. There are many efforts to introduce bio-based solvents to extraction, including analytical extraction;50 however it has to be considered that the renewability of the feedstock is not the only parameter to assess solvent greenness. The example of hexamethylenediamine obtained from fossil based and renewable resources shows that bio-based chemicals are not automatically green.51 Life cycle assessment shows that the fossil based method of manufacturing is more economically and environmentally beneficial than the bio-based way, no matter if rice, maize or potatoes are taken as a feedstock.
Another new group of solvents that are recently applied in analytical chemistry are deep-eutectic solvents.52 They have been so far applied as extraction solvents and in electrochemical applications. They consist of at least two substances in different molar ratios, so assessment of their greenness can be stymied.
Another aspect of analytical reagents is the application of acids and bases, for digestion53 and as various auxiliary chemicals. Due to different chemical properties, acids and bases require the application of slightly different parameters during their greenness assessment. Again, no metrics system was developed for analytical chemistry applications but we can obtain some clues in choosing green alternatives from the GlaxoSmithKline acid and base selection guides.54 The assessment systems are based on environmental, safety and health issues and problems with the occurrence of hazardous by-products or disposal problems. The assessment results of reagents used in analytical chemistry are presented in Fig. 5.
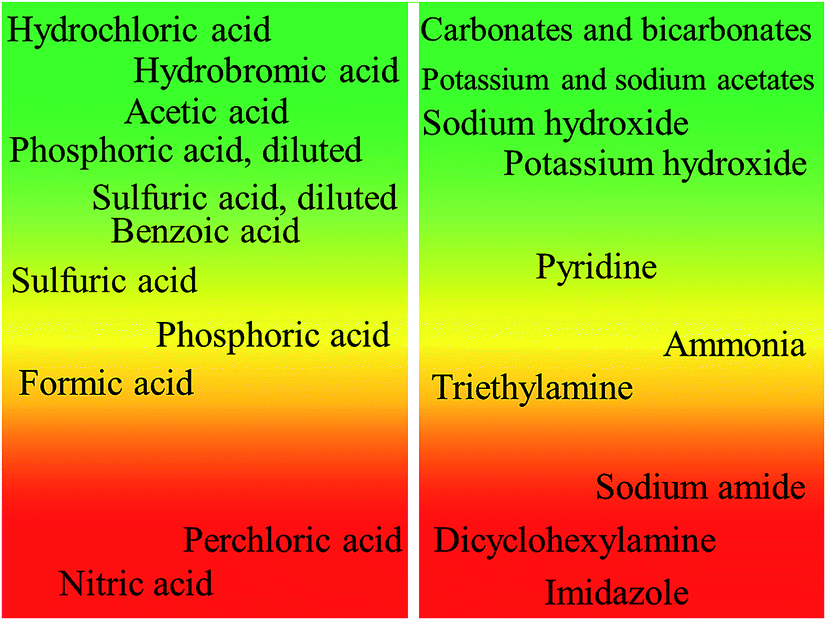 | ||
| Fig. 5 Greenness of acids and bases used in analytical chemistry. Based on the GSK selection guide.56 | ||
Another analytical aspect that has not been recognized by greenness assessments is the application of derivatization agents. Eight of the twelve principles state that derivatization should be avoided55 and this statement is valid also for green analytical chemistry.56 There are some attempts to make analytical derivatization greener, based on finding greener derivatization agents themselves, the replacement of organic solvents with water or enzymatic derivatization.57
6. Conclusions
Green analytical chemistry at the moment does not have well-established and widely applied metrics. There are some greenness metrics developed, however they do not fully cover the present needs. They should be easy to perform and easy to interpret, and at the same time gathering complex environmental impact data about analytical methods or analytical reagents. As the scientific domain is relatively new, significant gaps are still present. The concepts of assessment for analytical reagents, analytical procedures and even the environmental performance of whole analytical laboratories need to be developed. There is a necessity to develop analytical chemistry specific solvent selection systems, digestion chemicals and assessment system of derivatization agents. The environmental impact of analytical procedures is the factor that has to be considered during solvent and reagent selection in optimization processes.The recent trends in analytical chemistry to apply new chemicals, such as ionic liquids, bio-based solvents or deep eutectic solvents, require their careful and comprehensive assessment before commenting about their greenness. There are some examples of application of LCA in the area of green chemistry but it has not been used for assessment in analytical chemistry. The numerous examples show that application of LCA gives a holistic view on the environmental impact of the process. LCA seems to be the most comprehensive tool to assess the application of analytical reagents or analytical procedures.
References
- S. Armenta, S. Garrigues and M. de la Guardia, Trends Anal. Chem., 2008, 27, 497–511 CrossRef CAS.
- A. Rıos and M. Zougagh, Trends Anal. Chem., 2013, 43, 174–188 CrossRef.
- F. T. G. van den Brink, W. Olthuis, A. van den Berg and M. Odijk, Trends Anal. Chem., 2015, 70, 40–49 CrossRef CAS.
- F. Pena-Pereira, I. Lavilla and C. Bendicho, Trends Anal. Chem., 2010, 29, 617–628 CrossRef CAS.
- H. M. Mohamed, Trends Anal. Chem., 2015, 66, 176–192 CrossRef CAS.
- R. Jędrkiewicz, A. Orłowski, J. Namieśnik and M. Tobiszewski, Talanta, 2016, 147, 282–288 CrossRef PubMed.
- Y. Gaber, U. Tornvall, M. A. Kumar, M. A. Amin and R. Hatti-Kaul, Green Chem., 2011, 13, 2021–2025 RSC.
- R. A. Sheldon, Green Chem., 2007, 9, 1273–1283 RSC.
- M. J. Eckelman, J. B. Zimmerman and P. T. Anastas, J. Ind. Ecol., 2008, 12, 316–328 CrossRef CAS.
- X.-T. Sun, Q.-J. Tan, S.-X. Wang, J.-F. Shan and J.-L. Jiang, Anal. Methods, 2015, 7, 5428–5435 RSC.
- M. Koel, Green Chem., 2016, 18, 923–931 RSC.
- G. van der Vorst, H. Van Langenhove, F. De Paep, W. Aelterman, J. Dingenen and J. Dewulf, Green Chem., 2009, 11, 1007–1012 RSC.
- D. J. C. Constable, A. D. Curzons and V. L. Cunningham, Green Chem., 2002, 4, 521–527 RSC.
- J. Andraos, Org. Process Res. Dev., 2005, 9, 149–163 CrossRef CAS.
- T. V. T. Phan, C. Gallardo and J. Mane, Green Chem., 2015, 17, 2846–2852 RSC.
- D. Cespi, E. S. Beach, T. E. Swarr, F. Passarini, I. Vassura, P. J. Dunn and P. T. Anastas, Green Chem., 2015, 17, 3390–3400 RSC.
- J. Andraos, Org. Process Res. Dev., 2005, 9, 404–431 CrossRef CAS.
- C. Turner, Pure Appl. Chem., 2013, 85, 2217–2229 CrossRef CAS.
- H. K. Lawrence, L. U. Gron and J. L. Young, Chem. Rev., 2007, 107, 2695–2708 CrossRef PubMed.
- A. Gałuszka, P. Konieczka, Z. M. Migaszewski and J. Namieśnik, Trends Anal. Chem., 2012, 37, 61–72 CrossRef.
- M. Ruiz-de-Cenzano, M. L. Cervera and M. de la Guardia, Curr. Green Chem., 2014, 1, 232–238 CrossRef CAS.
- M. Tobiszewski, S. Tsakovski, V. Simeonov and J. Namieśnik, Green Chem., 2013, 15, 1615–1623 RSC.
- A. Astel, S. Tsakovski, P. Barbieri and V. Simeonov, Water Res., 2007, 41, 4566–4578 CrossRef CAS PubMed.
- M. Tobiszewski, S. Tsakovski, V. Simeonov and J. Namieśnik, Talanta, 2014, 130, 449–455 CrossRef CAS PubMed.
- M. Cinelli, S. R. Coles and K. Kirwan, Ecol. Indic., 2014, 46, 138–148 CrossRef.
- J.-J. Wang, Y.-Y. Jing, C.-F. Zhang and J.-H. Zhao, Renewable Sustainable Energy Rev., 2009, 13, 2263–2278 CrossRef.
- M. Behzadian, S. K. Otaghsara, M. Yazdani and J. Ignatius, Exp. Sys. Appl., 2012, 39, 13051–13069 CrossRef.
- H. Al-Hazmi, J. Namieśnik and M. Tobiszewski, Curr. Anal. Chem., 2016 DOI:10.2174/1573411012666151009194541.
- M. Behzadian, R. B. Kazemzadeh, A. Albadvi and M. Aghdasi, Eur. J. Oper. Res., 2010, 200, 198–215 CrossRef.
- M. Tobiszewski and A. Orłowski, J. Chromatogr. A, 2015, 1387, 116–122 CrossRef CAS PubMed.
- M. Tobiszewski, F. Pena-Pereira, A. Orłowski and J. Namieśnik, Trends Anal. Chem., 2015 DOI:10.1016/j.trac.2015.08.011.
- A. Spietelun, Ł. Marcinkowski, M. de la Guardia and J. Namieśnik, J. Chromatogr. A, 2013, 1321, 1–13 CrossRef CAS PubMed.
- R. K. Henderson, C. Jimenez-Gonzalez, D. J. C. Constable, S. R. Alston, G. G. A. Inglis, G. Fisher, J. Sherwood, S. P. Binks and A. D. Curzons, Green Chem., 2011, 13, 854–862 RSC.
- D. Prat, O. Pardigon, H.-W. Flemming, S. Letestu, V. Ducandas, P. Isnard, E. Guntrum, T. Senac, S. Ruisseau, P. Cruciani and P. Hosek, Org. Process Res. Dev., 2013, 17, 1517–1525 CrossRef CAS.
- K. Alfonsi, J. Colberg, P. J. Dunn, T. Fevig, S. Jennings, T. A. Johnson, H. P. Kleine, C. Knight, M. A. Nagy, D. A. Perry and M. Stefaniak, Green Chem., 2008, 10, 31–36 RSC.
- D. Prat, A. Wells, J. Hayler, H. Sneddon, C. R. McElroy, S. Abou-Shehada and P. J. Dunn, Green Chem., 2016, 18, 288–296 RSC.
- M. Tobiszewski, S. Tsakovski, V. Simeonov, J. Namieśnik and F. Pena-Pereira, Green Chem., 2015, 17, 4773–4785 RSC.
- C. Capello, U. Fischer and K. Hungerbühler, Green Chem., 2007, 9, 927–934 RSC.
- M. Tobiszewski and J. Namieśnik, Ecotoxicol. Environ. Saf., 2015, 120, 169–173 CrossRef CAS PubMed.
- M. B. Swanson, G. A. Davis, L. E. Kincaid, T. W. Schultz, J. E. Bartmess, S. L. Jones and E. L. George, Environ. Toxicol. Chem., 1997, 16, 372–383 CrossRef CAS.
- M. Poliakoff, J. M. Fitzpatrick, T. R. Farren and P. T. Anastas, Science, 2002, 297, 807–810 CrossRef CAS PubMed.
- S. Hellweg, U. Fischer, M. Scheringer and K. Hungerbühler, Green Chem., 2004, 6, 418–427 RSC.
- F. Pena-Pereira, A. Kloskowski and J. Namieśnik, Green Chem., 2015, 17, 3687–3705 RSC.
- T. Khezeli, A. Daneshfar and R. Sahraei, Talanta, 2016, 150, 577–585 CrossRef CAS PubMed.
- Ł. Marcinkowski, F. Pena-Pereira, A. Kloskowski and J. Namieśnik, Trends Anal. Chem., 2015, 72, 153–168 CrossRef.
- F. Pena-Pereira and J. Namieśnik, ChemSusChem, 2014, 7, 1784–1800 CrossRef CAS PubMed.
- M. Cvjetko Bubalo, K. Radošević, I. Radojčić Redovniković, J. Halambek and V. Gaurina Srček, Ecotoxicol. Environ. Saf., 2014, 99, 1–12 CrossRef CAS PubMed.
- H. H. Khoo, W. L. Ee and V. Isoni, Green Chem., 2016 10.1039/C5GC02065D.
- M. Virot, V. Tomao, C. Ginies, F. Visinoni and F. Chemat, J. Chromatogr. A, 2008, 1196–1197, 147–152 CrossRef CAS PubMed.
- Z. Li, K. H. Smith and G. W. Stevens, Chin. J. Chem. Eng., 2016, 24, 215–220 CrossRef.
- A. B. Dros, O. Larue, A. Reimond, F. De Campo and M. Pera-Titus, Green Chem., 2015, 17, 4760–4772 RSC.
- M. Espino, M. de los Angeles Fernandez, F. J. V. Gomez and M. Fernanda Silva, Trends Anal. Chem., 2016, 76, 126–136 CrossRef CAS.
- D. L. Rocha, A. D. Batista, F. R. P. Rocha, G. L. Donati and J. A. Nobrega, Trends Anal. Chem., 2013, 45, 79–92 CrossRef CAS.
- R. K. Henderson, A. P. Hill, A. M. Redman and H. F. Sneddon, Green Chem., 2015, 17, 945–949 RSC.
- P. Anastas and N. Eghbali, Chem. Soc. Rev., 2010, 39, 301–312 RSC.
- A. Gałuszka, Z. Migaszewski and J. Namiesnik, Trends Anal. Chem., 2013, 50, 78–84 CrossRef.
- I. Lavilla, V. Romero, I. Costas and C. Bendicho, Trends Anal. Chem., 2014, 61, 1–10 CrossRef CAS.
| This journal is © The Royal Society of Chemistry 2016 |