Nanoporous anodic aluminum oxide films for UV/vis detection of noble and non-noble metals†
Yuliya E.
Silina
*a,
Tatiana A.
Kychmenko
b and
Marcus
Koch
a
aChemical Analytics, INM-Leibniz Institute for New Materials, Campus D2 2, 66123 Saarbrücken, Germany. E-mail: yuliya.silina@leibniz-inm.de; Fax: +49 681 9300 242; Tel: +49 681 9300 117
bVoronezh State University of Engineering Technologies, Voronezh, Russia
First published on 27th November 2015
Abstract
In this study, a simple, rapid and inexpensive approach for the screening of heavy metals with photometric reagents was developed based on porous, anodic aluminium oxide (AAO) films, with detection limits of 0.45 mg L−1 (Co2+), 0.25 mg L−1 (Pb2+) and 0.59 mg L−1 (Ni2+). Noble metal ions Ag+ and Pd2+, as well as Cu2+, formed nanoparticles within the AAO channels during micro-solid phase extraction driven by galvanic electroless displacement followed by UV detection.
Introduction
Industrial galvanic production often results in severe environmental pollution by heavy metals.1 Moreover, the environmental protection laws of many countries do not regulate the maximum concentrations of metal nanoparticles (NPs) in matrices such as waste water in the vicinity of galvanic manufacturing plants.2–5Routine analytical procedures for monitoring heavy metals are often based on inductively coupled plasma optical emission spectroscopy (ICP-OES),6 which are strongly influenced by matrix interferents and usually require elaborate sample preparation routines for environmental samples.2,6 Solid-phase spectrophotometry techniques are often less affected by interferents, as they perform metal sorption and direct spectrophotometric detection of the trapped analytes from the same material.7–12 The solid materials applied for sorption are, for example, gelatin gels, polyacrylamide fibres and carbon nanotubes.8–12 Their utility in the direct spectrophotometric measurement is often restricted by the limited sorption capacity for metals, however, which then requires very sensitive instrumental detection techniques, e.g. X-ray fluorescence or ultraviolet spectroscopy.7 Furthermore, for rapid detection of heavy metals in environmental samples, whole-cell biosensors based on metallothionein promoters as well as DNA sensors using metal-mediated DNA duplexes have been proposed.13–19 Unfortunately, the required homogeneity of the reactions and the elaborate detection equipment make them unsuitable for rapid on-site, in situ analysis.
In this study, we have developed a simple and rapid method for screening heavy metals from water samples by solid phase micro-extraction of metals with subsequent visual detection. We propose the use of anodic aluminium oxide (AAO) nanoporous films for this purpose. AAO can be readily formed by anodic oxidation of aluminium, resulting in highly porous materials with adjustable structures. AAO has been utilized in many applications, including molecular separations, catalysis, energy generation/storage, electronics and photonics, sensors, hybrid nanomaterials and templates, drug delivery and template syntheses.20–27 AAO exhibits both active acidic and basic centres on the surface, making non-covalent attachment of analytes readily possible through donor–acceptor interactions and hydrogen bonding to the AAO surface via appropriate anchor groups.26 Also, AAO matrices have been successfully utilized as templates for biosensors28–30 and as substrate materials for analysis of peptides by surface assisted laser desorption/ionisation mass spectrometry (SALDI-MS).31
Furthermore, metals such as Au, Ag, Cu, etc. are readily deposited within the pores of AAO substrates by electrochemical deposition on anodic aluminium oxide templates with high efficiency to obtain protective and decorative coatings.32–34 No particular attention has been paid so far to the use of both electrochemical and chemical deposition of metals on anodic aluminium oxide surfaces as a means of analytical sampling and detection. We have investigated the analysis of metal ions with different reduction potentials (E0); viz., Ag+, Pd2+, Cu2+, Co2+, Ni2+ and Pb2+. The approach allowed the screening of non-noble metals (Ni2+, Co2+, and Pb2+) with photometric reagents and UV-detection of noble Ag+, Pd2+ and Cu2+ due to their chemical reduction to nanoparticles in the solid AAO matrix.
Experimental
Chemicals and materials
CoSO4, Pb(NO3)2, NiSO4, CuSO4, H2PdO2, AgNO3, 1-nitroso-2-naphthol-3,6-disulfonic acid disodium salt (nitroso-R-salt, NRS), dithizone, murexide, alizarin red, KI, dimethylglyoxime, and sulfosalicylic acid were purchased from Merck (Darmstadt, Germany), 60 μm Al foil (nominal composition of Al98Mg2%) and platinum plates (99.99%) were from VWR (Darmstadt, Germany), granular Al2O3 (TU 2163-011-51444844-2005, grain size 2–4 mm, pore diameter 0.2–0.5 μm) was from AM3 Ltd. (Chelyabinsk, Russia), and isopropanol, HCl, acetone, and ethanol were from Sigma-Aldrich (Steinheim, Germany). Organic-free, deionized water was generated by an Elga PureLab (Celle, Germany) water purification system.Preparation of the AAO matrix
The properties of the synthesized AAO films, such as morphology, fragility, inherent colour, and porosity, prepared from aluminium foil, strongly depend on the nature of the electrolyte solution as well as parameters such as electrolysis time (tel) and current (Ia). For the preparation of anodic films, a two-step procedure was applied using oxidation of aluminium foil in 0.6 M sulfosalicylic acid as it was optimized in our previous study involving analytical application of AAO.26 Al foil was initially polished using a series of abrasive papers (9 → 6 → 3 μm). To remove the native layer, an anodic current density of Ia = 1 A dm−2 for tel(1) = 10 min (first oxidation) was initially applied; during the second oxidation step, the current density ranged from Ia = 0.5 to 1.5 A dm−2 for tel(2) = 40 min. The anode was aluminium, while the cathode was a platinum plate. Anodizing of samples was carried out in a glass bottle using a two-electrode electrochemical cell and a P-5827 M potentiostat (Gomel, Belarus) in galvanostatic mode. The prepared anodic films were cleaned in acetone and ethanol, and stored under room conditions not more than 30 days before metal immobilization (see below).Scanning electron microscopy (SEM) and X-ray spectral analysis (EDX)
For the determination of pore diameters (Dpor, nm) and verifying that noble metals were reduced to nanoparticles during solid phase extraction in the AAO channels, a FEI (Hillsboro, OR, USA) Quanta 400 FEG scanning electron microscope equipped with an EDAX (Mahwah, NJ, USA) Genesis V 6.04 EDX X-ray spectral analysis system was used. SEM images were taken at an accelerating voltage of 10 kV and image size of 1024 × 884 pixels.Inductively coupled plasma mass spectrometry (ICP MS)
To verify the chemical stability of the produced anodic films, ICP MS analysis with ELEMENT XR (Thermo Fisher Scientific, Bremen, Germany) of 5 mL water in high resolution mode (HR) before and after AAO (2 × 0.5 cm2) immersion for 30 minutes was used with the following source parameters: cool gas: 16.00 L min−1; sample gas: 1.24 L min−1; faraday deflection: −217 V; plasma power: 1250 W; peri. pump speed: 10 rpm; torch X-Pos.: 1.9 mm; torch Y-Pos.: 0.8 mm; torch Z-Pos.: −3.3 mm.Micro-solid phase extraction in AAO channels
Metal stock solutions were prepared at 10 mg mL−1. After dilution of the stock solutions down to concentration levels near the limit of detection (LOD), immobilization within the AAO matrix under static (24 h) and dynamic (ultrasonic bath for 30 min) conditions was carried out using several approaches:(1) initial treatment of AAO (plate size 1 × 2 cm2) with photometric reagents (NRS, dithizone, murexide, alizarin red, KI, and dimethylglyoxime) followed by sorption of the targeted ions;
(2) sorption (saturation) of the pre-formed photometric complex from water by the AAO surface;
(3) initial sorption of ions by the AAO surface followed by treatment with photometric reagents.
Photometric analysis
To qualitatively confirm the presence of nanoparticles of noble metals after immobilization in AAO pores, photometric analyses were carried out using a CV-2000-02 (Spectra Ltd., St. Petersburg, Russia) spectrophotometer. To transform AAO into the transparent form, the porous layer of AAO (area 1 × 2 cm) was separated from the aluminium barrier layer by placing the film for 30 s in 10 mM HCl. The transparent AAO films were removed from the solution, deposited on quartz plates by the Schaeffer method (horizontal lift35), placed into cuvettes for photometry and investigated in the wavelength range from 200 to 1100 nm (step size, 1 nm). Blank, empty AAO matrices, prepared under the same conditions, were used in these experiments.Sorption capacities of non-transparent AAO films were evaluated using adsorption values (a, mol g−1):25
 | (1) |
Residual concentrations of metal ions in solution after immersion of AAO matrices were determined by conventional photometry: by reacting Pb2+ and Ag+ with dithizone, Co2+ with NRS, and Cu2+ with alizarin red.36,37 To compare the sorption capacity of AAO films granular Al2O3 was used.
Potentiometric pH measurements
As the reference system to measure the pH values of the solutions, a potentiometric sensor Multitest IPL-301 with combined electrode ESC-10603 (Cemiko Ltd., Novosibirsk, Russia) was used. The acidity of the solutions was adjusted using pH buffer mixtures.Results and discussion
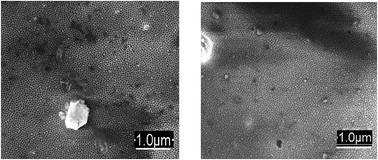
Under the applied electrochemical conditions, regular porous structures were generated inside the utilized Al foils, with average diameters of 40–60 nm and channel lengths of up to 25 μm (Fig. 1). The pore density of AAO films was 1010 to 1011 pores per cm2, with no visible external structure defects on the surface. EDX analysis of Al-films after anodization revealed the presence of Mg (due to the used Al alloy) and S (sulfosalicylic electrolyte) besides Al and O lines (ESI, Fig. S1†). Subsequent ICP MS analysis showed significant migration of Al (approx. 2.5 ppb) and Mg (approx. 300 ppt) from the films after anodization in water (ESI, Table S1†). We interpret the increased amounts of Al and Mg in water after AAO immersion as a result of ion transport/migration through the micro-cracks occurring between the barrier layer and porous matrix (ESI, Fig. S2†). Due to the combined presence of oxidized and free metallic Al within the AAO matrices, interesting properties such as reduction/oxidation abilities during metal immobilisation were expected.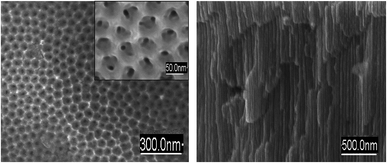 | ||
| Fig. 1 SEM images of the AAO matrix: (left) surface; (right) cross-section showing 25 μm length of porous channels. | ||
Optimization of micro-solid phase extraction
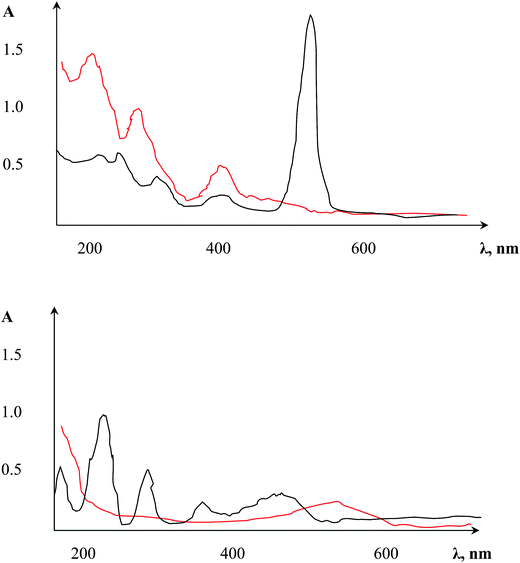
As summarized in the Experimental section, three different experimental approaches for metal sorption on the AAO micro-solid extraction material were compared. The first two strategies, i.e., preliminary modification of AAO with the photometric reagents followed by metal ion sorption, and sorption of the preformed photometric complex from water, unfortunately did not exhibit sufficient efficiency.In the first approach, dithizone produced a complex with the free Al3+ ions that was accompanied by unstable colouring of the film surface. AAO modification with reagents containing fewer functional groups (murexide) exhibited indeed a colour change of the material, showing that a stable complex was created between the target surface and photometric agent; unfortunately, after applying metal ions onto this modified surface, no visual analytical effects were seen. Similarly, immobilized NRS (3%) exhibited significant changes in the UV spectrum of the three main lines (β-, π) of the naphthoquinone forms. Moreover, the additional line at λ = 527 nm along with an increased molar extinction coefficient (Fig. 2, top) can be linked to intramolecular charge transfer initiated by the AAO matrix, readily demonstrating complex formation between Al3+ and functional NRS groups. NRS has a branched structure with functional groups still available after immobilization on the AAO surface. After immersion of this modified AAO matrix in CoSO4 solution, a new line at λ436 indicated the complex formation of Co(II) and NRS (Fig. 2, bottom) was observed. Despite the complex formation of Co(II), useful visual changes of the colour were not obtained below 0.01 mg mL−1; we speculate that this was due to the partial shielding of the photometric reagent's functional groups by Al3+ (see above).
The second approach (immobilization of the preformed photometric complexes of the metal and reagent from water) did not give any visible effects, probably due to geometrical size restrictions, where the complex did not properly enter the AAO pores.
The third approach (sorption of metal ions on the AAO film, followed by treatment with photometric reagents) provided efficient immobilization of metal ions within the AAO pores regardless of whether the saturation of the AAO was performed under static or dynamic conditions (see the Experimental section). The AAO films gave beneficial colour changes that were readily detected for the quantification of the metal ions. Co(II) immobilized within AAO after dithizone treatment was measured down to 0.00059 mg mL−1; NRS gave 0.00045 mg mL−1; Pb(II) was determined at a limit of 0.00026 mg mL−1 using KI for visualization (Fig. 3, shown for films saturated under dynamic conditions). The obtained colours were stable for at least 6 months. The limits of visual detection for Co(II), Ni(II) and Pb(II) with different photometric reagents are summarized in Table 1.
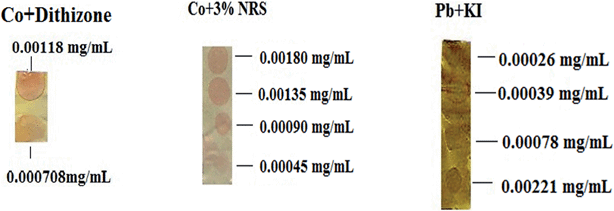 | ||
| Fig. 3 Images of AAO films after immobilization of non-noble ions at different concentration levels followed by photometric reagent visualization. | ||
| Metal ion | Photometric reagent | Color | LODa (mg mL−1) |
|---|---|---|---|
| a LOD defined as the limit concentration of element in waste water. | |||
| Co2+ | Dithizone | Yellow-red | 0.00059 |
| Co2+ | Nitroso-R-salts | Rose | 0.00045 |
| Pb2+ | Dithizone | Bright rose | 0.00025 |
| Pb2+ | Alizarin red | Violet (in ammonium buffer) | 0.00030 |
| Pb2+ | KI | Bright yellow | 0.00026 |
| Ni2+ | Dimethylglyoxime | Rose | 0.00059 |
Equally no visible changes for the reported above concentrations during non-noble metal immobilisation to blank aluminium foil (before anodization) or granular Al2O3 were detected.
Sorption of noble metals
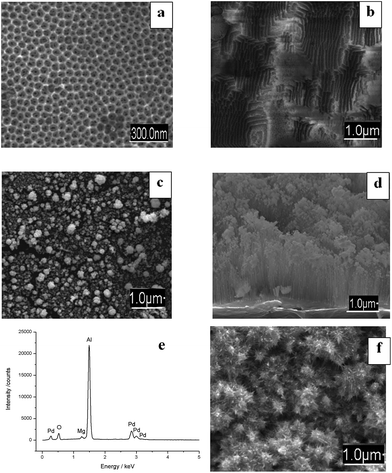
In the next experiment, AAO films were applied for micro-solid phase extraction of metal ions that are located right of hydrogen in the Beketov metal displacement series; i.e., noble metal ions that are readily reduced to the metallic elements, for example, Ag+, Cu2+ and Pd2+. In our experiments, these ions were chemically reduced within the AAO channels, formed nanoparticular structures (Fig. 4) and could not be visualized by using photometric reagents as it was described above for non-noble metals.The SEM images clearly showed visible globules of Cu-NPs and Ag-NPs of 100–1000 nm sizes on the AAO surface. UV measurements exhibited additional bands in the absorbance spectra, corresponding to metallic NPs (Table 2). The presence of multiple additional lines in the spectra of each of the tested ions probably corresponded to nanoparticle species with different diameters on the solid AAO matrix. We explain the observed effect by the presence of free Al and Mg ions (ESI, Table S1†), resulting in chemical reduction of noble metal ions. The existence of metallic NPs on AAO was confirmed by means of SEM (Fig. 4), EDX analysis (Fig. 5e) and UV-spectroscopy (Table 2) independently. The sorption capacity of the AAO film for noble metal ions (Cu2+, Ag+, and Pd2+) was estimated. It was found that in comparison to granular Al2O3 the sorption capacity (RSD ≤ 10%) of AAO was approx. 13-fold larger under static, and almost 18-fold larger under dynamic conditions (Table 3). The behaviour of AAO films for noble metal ions can be explained by considering the internal matrix charge transfer between Al0 ↔ Al3+ from the presence of free Al. Free Al is expected to promote surface electrochemistry of AAO and stimulate Cu2+, Ag+, and Pd2+ reduction to NPs by galvanic displacement (electroless deposition).38–40 During electroless deposition, self-assembled metallic structures are formed by galvanic displacement on the semiconductor surface. The reaction is based on in situ electrochemistry which resulted in the reduction of metal ions to NPs on the substrate in the absence of external sources of electric current or chemical reducing agents.40
| Ion | A (Solution) (λmax, nm) | A (AAO + Men+) (λmax, nm) | Note |
|---|---|---|---|
| Cu2+ | 1.21 (515) | 0.21 (355) | Additional lines at λ355,387 nm (Cu2+ → Cu0), λ475–697,943 nm (Ag+ → Ag0), λ496,690,894 nm (Pd2+ → Pd0), indicate formation of NPs within the solid phase/AAO matrix |
| 0.19 (387) | |||
| Ag+ | 1.16 (520) | 0.13 (475) | |
| 0.24 (697) | |||
| 0.16 (943) | |||
| Pd2+ | 1.03 (530) | 0.10 (496) | |
| 0.16 (690) | |||
| 0.18 (894) |
| Me2+a | a , mol g−1 (% RSD) | ||
|---|---|---|---|
| Granular Al2O3 | AAO (static saturation) | AAO (dynamic saturation) | |
| a The metal ion concentration was chosen near the LOD value for these experiments. b Estimated in solutions after contact within non-transparent AAO films. | |||
| Cu2+ (515 nm) | 0.6 (4.5) | 6.9 (3.1) | 9.8 (8.6) |
| Ag+ (520 nm) | 0.2 (7.8) | 4.1 (5.9) | 6.8 (4.2) |
| Pd2+ (530 nm) | 0.7 (2.3) | 8.3 (10.1) | 10.1 (7.3) |
To demonstrate the observed effects occurring in the system in dynamic conditions, we simulated the galvanic displacement of AAO by immersing the anodic films first in 10 mM HCl for 10 s and then directly in the metal ion precursor solutions (Fig. 5, shown for Pd). Immersion of AAO in HCl generated characteristic etched structures, enhancing electron exchange between the Al matrix and precursor solution (Fig. 5b). Direct saturation of AAO with metal precursor solutions (20 mM of Pd2+) leads to spontaneous metal ion reduction to NPs, with regular Pd-NPs and nanoflowers (40–100 nm) visible on the AAO (Fig. 5c). Metal NPs were homogeneously distributed mostly within the AAO surface without deep penetration into the porous structure (Fig. 5d). Increasing the electrolysis time leads to intensive growth of larger NPs (500–800 nm), with the morphology changing from nano- to micro-structures (Fig. 5f).
Quantitative UV-detection of noble metals within AAO
Initially, several different approaches for UV-detection of noble metal ions on AAO films were utilized:(1) saturation of non-transparent AAO in noble metal solutions (accompanied by reduction of noble ions to NPs) followed by removal of the Al-barrier layer and subsequent UV-detection of immobilized NPs within the transparent solid matrix;
(2) prior removal of the Al-barrier layer followed by saturation of transparent AAO in noble metal ion solutions and photometric analyses of the solid matrix;
(3) immersion of non-transparent AAO in the noble metal solutions for 30 min (allowed reduction of noble metal ions to NPs) followed by conventional photometric analysis of the residual ion concentration;
(4) prior immobilization of photometric reagents within transparent AAO films followed by immersion in noble metal ion solutions and subsequent UV-detection of the conventional photometric complex in the transparent solid matrix.
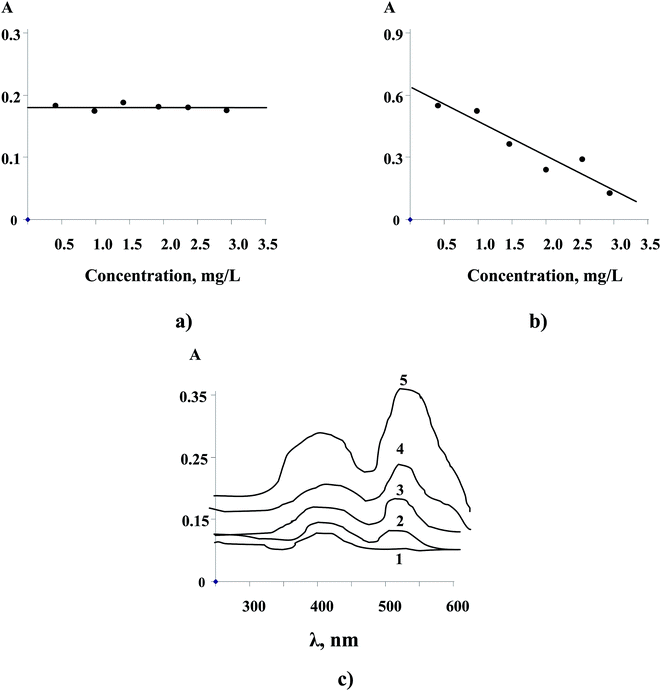
Unfortunately, we have not obtained an accurate calibration for immobilizing NPs directly in the AAO due to the partial dissolution of the reduced NPs during HCl treatment of the matrix (approach 1). Furthermore, prior removal of the Al-barrier layer (approach 2) leading to transparent AAO films and subsequent saturation in noble metal ion solutions also didn't show an appropriate analytical effect (Fig. 6a, shown for Cu2+). This example demonstrated again a role of matrix surface electrochemistry (free Al from the barrier layer) in the NP formation.
Quantitative analysis of noble metal NPs was readily possible after immersion of non-transparent AAO films in the metal model solutions for 30 min (approach 3) followed by conventional photometric analysis (Fig. 6b). Remarkably, the sorption of the noble metals by AAO exhibited a linear trend over the range from 0.3 to 3.0 mg L−1.
In contrast to the approaches described above, it is also highly interesting that a prior immobilization of photometric reagents within transparent AAO films followed by a further immersion in aqueous solutions of noble metals (approach 4) allowed a quantitative analysis of targeted ions in solid matrices (Fig. 6c, shown for NRS and Cu2+).
We believe that the proposed method of noble metal UV-detection within AAO matrices may have important application in controlling environmental NPs in the future.
Conclusions
In this study, a new approach for rapid analysis of non-noble metals (Co2+, Pb2+, and Ni2+) with visual detection based on anodic aluminium oxide films was introduced. Selective electroless galvanic reduction of noble metal ions (Ag+, Cu2+, and Pd2+) within the AAO matrix allowed simultaneous UV-detection of their nanoparticles making AAO films a promising analytical tool for environmental NP monitoring.The next step in our study will involve investigation of sorption behavior of non-noble metals in the presence of interfering noble ions as well as UV-quantification of NPs from the multi model solutions and waste water systems.
Acknowledgements
The authors thank Prof. Eduard Arzt (Leibniz Institute for New Materials, Saarbrücken, Germany) for continuing support of their work at INM. The authors also thank Dr Claudia Fink-Straube (Leibniz Institute for New Materials, Saarbrücken, Germany) and Prof. Dietrich A. Volmer (Institute for Bioanalytical Chemistry, Saarbrücken, Germany) for fruitful discussion and proof-reading the paper.References
- K. S. Golokhvast and A. A. Shvedova, PLoS One, 2014, 9, 1–11 Search PubMed.
- M. E. Andrus, Met. Finish., 2000, 98, 20–23 CrossRef.
- D. Voutsa and C. Samara, Atmos. Environ., 2002, 36, 3583–3590 CrossRef CAS.
- J. E. Silva, A. P. Paiva, D. Soares, A. Labrincha and F. Castro, J. Hazard. Mater., 2005, 120, 113–118 CrossRef CAS PubMed.
- G. Rossini and A. Bernardes, J. Hazard. Mater., 2006, 131, 210–216 CrossRef PubMed.
- A. Hanć, I. Komorowicz, K. Sek and D. Baralkiewicz, J. Environ. Sci. Health, Part A: Toxic/Hazard. Subst. Environ. Eng., 2009, 44, 1441–1448 CrossRef PubMed.
- R. Skorek, B. Zawisza, E. Marguı, I. Queralt and R. Sitko, Appl. Spectrosc., 2013, 67, 204–209 CrossRef CAS PubMed.
- V. M. Ostrovskaya, A. V. Tsygankov, O. A. Prokopenko, A. K. Buryak, E. A. Reshetnyak and N. A. Nikitina, Russ. J. Appl. Chem., 2008, 63, 792–798 CAS.
- A. V. Panteleimonov, N. A. Nikitina, E. A. Reshetnyak, L. P. Loginova, A. A. Bugaevskii and Y. V. Kholin, Methods Objects Chem. Anal., 2008, 3, 128–146 Search PubMed.
- S. Dong, M. Luo, G. Peng and W. Cheng, Sens. Actuators, B, 2008, 129, 94–98 CrossRef CAS.
- Z. Chen and C. Lu, Sens. Lett., 2005, 3, 274–295 CrossRef CAS.
- S. Capel-Cuevas, N. Lypez-Ruiz, A. Martinez-Olmos, M. P. Cullar, M. Pegalajar, A. Palma, I. Orbe-Paub and L. F. Capitan-Vallvey, Sensors, 2012, 12, 6746–6763 CrossRef CAS PubMed.
- F. Amaro, A. P. Turkewitz, A. Martín-González and J. C. Gutiérrez, Microb. Biotechnol., 2011, 4, 513–522 CrossRef CAS PubMed.
- G. H. Clever, C. Kaul and T. Carell, Angew. Chem., 2007, 46, 6226–6236 CrossRef CAS PubMed.
- I. Willner and M. Zayats, Angew. Chem., 2007, 46, 6408–6418 CrossRef CAS PubMed.
- C. X. Tang, Y. Zhao, X. W. He and X. B. Yin, Chem. Commun., 2010, 46, 9022–9024 RSC.
- Y. Xiao, A. A. Rowe and K. W. Plaxco, J. Am. Chem. Soc., 2007, 129, 262–263 CrossRef CAS PubMed.
- T. Li, S. Dong and E. Wang, J. Am. Chem. Soc., 2010, 132, 13156–13157 CrossRef CAS PubMed.
- A. Vallée-Bélisle and K. W. Plaxco, Curr. Opin. Struct. Biol., 2010, 20, 1–9 CrossRef PubMed.
- T. D. Lazzara, K. H. Lau, W. Knoll, A. Janshoff and C. Steinem, Beilstein J. Nanotechnol., 2012, 3, 475–484 CrossRef CAS PubMed.
- S. Shingubara, J. Nanopart. Res., 2003, 5, 17–30 CrossRef CAS.
- M. J. Kao, S. F. Chang, C. C. Chen and C. G. Kuo, World Academy of Science, Engineering and Technology International Journal of Chemical, Molecular, Nuclear, Materials and Metallurgical Engineering, 2012, 6, 441–444 Search PubMed.
- A. Mutalib Md Jani, D. Losic and N. H. Voelcker, Prog. Mater. Sci., 2013, 58, 636–704 CrossRef.
- Y. Kim, B. Jung, H. Lee, H. Kim, K. Lee and H. Park, Sens. Actuators, B, 2009, 141, 441–446 CrossRef CAS.
- Y. E. Silina, B. A. Spiridonov, V. P. Gorshunova and T. A. Kuchmenko, Russ. Anal. Control (Aналитикa и контроль), 2011, 15, 324–329 Search PubMed.
- Y. E. Silina, T. A. Kuchmenko and D. A. Volmer, Analyst, 2015, 140, 771–778 RSC.
- A. M. Jani, D. Losic and N. H. Voelcker, Prog. Mater. Sci., 2013, 58, 636–704 CrossRef.
- D. K. Kim, K. Kerman, H. M. Hiep, M. Saito, S. Yamamura and Y. Takamura, Anal. Biochem., 2008, 379, 1–7 CrossRef CAS PubMed.
- S. Chang, H. Ko, S. Singamaneni, R. Gunawidjaja and V. V. Tsukruk, Anal. Chem., 2009, 81, 5740–5748 CrossRef CAS PubMed.
- X. Fan, I. M. White, S. I. Shopova, H. Zhu, J. D. Suter and Y. Sun, Anal. Chim. Acta, 2008, 620, 8–26 CrossRef CAS PubMed.
- R. Nayak and D. R. Knapp, Anal. Chem., 2007, 79, 4950–4956 CrossRef CAS PubMed.
- Y. A. Barnakov, N. Kiriy, P. Black, H. Li, A. V. Yakim, L. Gu and M. Mayy, Opt. Mater. Express, 2011, 6, 1061–1064 CrossRef.
- J. M. Moon and A. Wei, J. Phys. Chem. B, 2005, 49, 23336–23341 CrossRef PubMed.
- K. Nielsch, F. Muller., A. P. Li and U. Gosele, Adv. Mater., 2000, 8, 582–586 CrossRef.
- G. Roberts, Adv. Phys., 1985, 34, 475–512 CrossRef CAS.
- E. A. Reshetnyak, I. V. Ivchenko and N. A. Nikitina, Cent. Eur. J. Chem., 2012, 10, 1617–1623 CrossRef CAS.
- V. M. Ostrovskaya, E. A. Reshetnyak, N. A. Nikitina, A. V. Panteleimonov and Y. V. Holin, Russ. J. Appl. Chem., 2004, 59, 1101–1108 Search PubMed , in Russian.
- S. K. Wang, S. H. Jeong, O. J. Lee and K. H. Lee, Microelectron. Eng., 2005, 77, 2–7 CrossRef.
- H. Kawasaki, T. Yao, T. Suganuma, K. Okumura, Y. Iwaki, T. Yonezawa, T. Kikuchi and R. Arakawa, Chem.–Eur. J., 2010, 16, 10832–10843 CrossRef CAS PubMed.
- H. W. Tang, K. M. Ng, W. Lu and C. M. Che, Anal. Chem., 2009, 81, 4720–4729 CrossRef CAS PubMed.
Footnote |
| † Electronic supplementary information (ESI) available. See DOI: 10.1039/c5ay02498f |
| This journal is © The Royal Society of Chemistry 2016 |

