 Open Access Article
Creative Commons Attribution 3.0 Unported Licence
Pyrolysis-gas chromatography-mass spectrometry with electron-ionization and resonance-enhanced-multi-photon-ionization for the characterization of terrestrial dissolved organic matter in the Baltic Sea†
Stefan
Otto
a,
Sabrina
Erdmann
a,
Thorsten
Streibel
*ab,
Daniel P. R.
Herlemann
c,
Detlef
Schulz-Bull
d and
Ralf
Zimmermann
ab
aJoint Mass Spectrometry Centre, Chair of Analytical Chemistry, Institute of Chemistry, University of Rostock, 18059 Rostock, Germany. E-mail: thorsten.streibel@uni-rostock.de; Tel: +49 381 498 6536
bJoint Mass Spectrometry Centre, Cooperation Group Comprehensive Molecular Analytics (CMA), Helmholtz Zentrum München-German Research Center of Environmental Health (GmbH), Ingolstädter Landstrasse 1, 85764 Neuherberg, Germany
cBiological Oceanography, Leibniz Institute for Baltic Sea Research, 18119 Warnemünde-Rostock, Germany
dMarine Chemistry, Leibniz Institute for Baltic Sea Research, 18119 Warnemünde-Rostock, Germany
First published on 17th February 2016
Abstract
With the effects of global warming the input of terrigenous material into the oceans is increasing, with unknown consequences for the ecosystem. The Baltic Sea is an ideal research object and observed effects can be transferred to the oceans. This paper combines the influence of biotic and abiotic factors especially for terrigenous dissolved organic matter (tDOM). The study is focused on specific lignin target molecules and reflects the influence of salinity and microbial activity. Samples were taken along the salt gradient. In addition, an incubation experiment, mixing of tDOM-rich river water with Baltic Sea water from three different stations, was carried out. A newly developed pyrolysis gas chromatography mass spectrometry (Py-GC/MS) method using two different mass selective analyzers in one measurement cycle was established for the analysis of tDOM species. It enables the characterization of natural samples by a universal (electron ionization quadrupole MS) as well as an aromatic fingerprint (resonance-enhanced-multi-photon-ionization time-of-flight MS). By thermal desorption (TD) and subsequent pyrolysis the free volatile and high molecular weight structures are accessible. A huge part of the chemical species exists as high molecular structures. The salt content has a high influence on the composition of DOM. Generally, under TD conditions greater changes were observed, especially for the incubation experiment. Under pyrolysis and the chosen experimental conditions, the lignin apparently is hardly degraded by microorganisms.
1. Introduction
The climate change and the associated negative consequences for many ecosystems, particularly the oceans, are discussed worldwide. As a result of the global warming, the temperature in arctic regions increases and the rivers located there have shown trends of a higher water discharge.1 With the enhanced inflow by Nordic rivers, the input of terrigenous material in the oceans rises as well. The structural characterization of this material such as dissolved organic matter (DOM) and the understanding of its alterations while being transported to the oceans has been an increasing area of research over the past few decades.2 Large fractions of terrigenous dissolved organic matter (tDOM) are removed from the river inflow areas towards the open oceans. Possible reasons are abiotic as well as microbial degradation.3–5 While abiotic factors such as salinity or solar radiation are studied in detail,6–10 the microbial degradation is poorly understood and previous experiments showed contrasting results.1,4,11–14Terrestrial DOM is a ubiquitous and dynamic mixture with a characteristic organic chemical signature for every individual region.15,16 A distinction between particulate organic matter (POM) and DOM is operationally defined. The latter is assumed to pass a 0.45 μm filter pore whereas POM is retarded. It is also a combination of refractory and labile marine and terrigenous compounds. The riverine organic matter can be soil-derived and mostly has a terrigenous origin.6 The input of tDOM by freshwater is considerably high,8,17 but only a small fraction (0.7–2.4%) of this introduced total DOM in the oceans is detectable.18 The reason for this could be various elimination processes that are still unclear in detail. This is remarkable, because arctic tDOM seems to be relatively stable over time.19,20
Lignin, as a part of tDOM, is a tracer for terrestrial organic matter, since it is source specific and produced only by vascular plants.2,13,16 The degradation products of lignin are phenolic monomers, which can be divided into four different structural families: p-hydroxy (H building block), syringyl (S building block), vanillyl and cinnamyl family.21 For simplification the last two are taken together as V building blocks, because they have the same aromatic base bodies. The S/V value is often used to distinguish between gymnosperm (non-flowering vascular plants) and angiosperm (flowering vascular plants) sources.13,21 A high amount of H building blocks often represents grass lignins,4 but the free forms can also have a marine origin.22
The influence of an increasing salinity on high-molecular-weight-DOM and the alterations by flocculation, adsorption to suspended matter,23 photochemical transformation7,9,24 and microbial decomposition10 are important removal mechanisms for tDOM on its way from the freshwater input to the oceans. Often a combination of biotic and abiotic factors is responsible for the degradation of DOM. Salinity can play an important role in enhancing the decomposition rate by bacterial communities.4,5,10 In general, the degradation rates of DOM vary tremendously, between 6 and 70%,1,14,25,26 depending on the experimental approach. Moreover, the temperature has a significant influence on the degradation of DOM.27 It is claimed, that colloidal, high-molecular-weight-DOM is more biological and chemical reactive than under low temperature conditions.28
In order to describe the role of tDOM, especially of lignin, its input, transformation and degradation, specific methods are needed to get more detailed information on the structure at a molecular level. In the ocean the concentration of DOM is extremely low with <1 mg L−1.29 Therefore the isolation and purification of DOM is important and often linked to the subsequent analysis. Retention-based methods are enriching the DOM and remove inorganic material (i.e. salt),28,30 which is essential for chromatographic methods. Generally gas chromatography (GC) in combination with alkaline cupric oxidation to yield specific lignin monomers11,13,21 or conversional pyrolytic degradation28,31 are established for characterizing lignin-deriving organics. By using a derivatisation reagent the number of compounds that are identifiable can be increased.4,8,21,32
In this study, a GC separation followed by two distinct MS-methods in parallel was applied for the characterization of tDOM for the first time. The analytical system consists of a quadrupole and a time-of-flight MS (QMS and ToFMS) in combination with electron ionization (EI) and photo ionization (PI), respectively. EI, a hard ionization technique, leads to high fragmentation of the organic molecules. Despite the fact that the characteristic fragmentation pattern can be used for substance identification, sometimes the loss of the molecular ion aggravates the identification. The lack of the molecular ion signal can be prevented by using photo ionization such as resonance-enhanced-multi-photon-ionization (REMPI), a soft ionization method. For a successful ionization via an intermediate state two photons have to be absorbed.33–35 REMPI has a high selectivity and sensitivity for aromatic hydrocarbons, depending on the used photon wavelength and additionally on the ionization energy threshold.36–38 The developed Py-GC/MS method with two different mass selective analyzers combined in one measurement cycle, enables the characterization of natural samples by a universal (EI) as well as an aromatic fingerprint (REMPI) and was successful applied by Otto et al. (2015) to crude oil samples.39 Therefore the aim of the present study was to characterize riverine DOM by the newly developed Py-GC/MS combination39 and its structural and semi-quantitative compositional changes along the gradient of salinity and during decomposition by marine bacterial communities.
2. Experimental section
The experimental part is roughly divided into the sampling along the salt gradient of the Baltic Sea and the incubation experiment on three different stations.2.1. Sample size and sampling
Samples were collected on a research cruise with the Meteor (M87/3a) between Skagerrak (S1 station) and the Gulf of Bothnia (At4 station) in May/June 2012. One part of the sampled water was taken for the salinity gradient measurements (see Fig. 1a).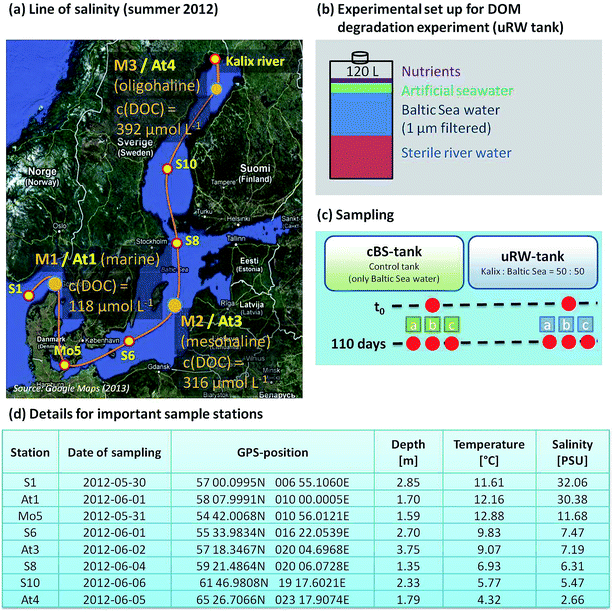 | ||
| Fig. 1 (a) Map of the Baltic Sea displaying the sample stations for the line of salinity and the three sampling sites for the incubation experiment. The sampling of Kalix river water is described in detail by Herlemann et al. (2014).3 The dissolved organic carbon (DOC) concentration on At1, At3 and At4 is shown. (b) Experimental design of the tDOM decomposition culture experiment, (c) the tank setup and the time line for sampling and (d) location sites in detail. | ||
Another important part of the study was the incubation experiment at three representative salinities. The stations are labeled with M1, M2 and M3 (identical with At1, At3 and At4). The selection of the relevant stations was based on the publication of Herlemann et al. (2011), where three suitable bacterial communities in the Baltic Sea, a marine/brackish group (salinity 8–32), brackish group (salinity 3–8) and a freshwater-brackish group (salinity < 3) were identified.40 The microorganisms are able to use tDOM as the carbon source. In order to investigate the degradation of tDOM by microorganisms, tank experiments were conceived.
Kalix river water (located in North Sweden), which is rich in terrigenous dissolved organic material, was mixed with the sampled Baltic Sea water. The river water was sampled during the spring flood in May 2011 (see Herlemann et al. (2014) for detailed information), sterile-filtered and stored at −20 °C. For each sampling station, the river water was at first mixed with artificial seawater to reach the salt content of the current sample station, in order to limit the stress for the microorganisms. Finally, it was filled up with 50% surface water of the current station. This mixing tank contains 120 L water volume and is abbreviated as uRW-tank. In this study the mixed uRW tanks as well as a control tanks (cBS, Baltic Sea water only) were examined for three representative salinities. The reason for utilizing the cBS tank is the fact that Baltic Sea water contains natural DOM and microbial processes are still running. The composition of DOM is also changed. Therefore, the investigation of such changes by added artificial DOM through river water becomes necessary. Three biological replicates from each selected station were stored for 110 days at 10 °C. Sampling was carried out at the beginning and after 110 days. The experimental set up for DOM degradation experiments is illustrated in Fig. 1b and c.
2.2. Sample preparation
All water samples taken along the gradient of salinity and for the degradation experiment were treated in the same way. 1 L was immediately filtered through pre-combusted (400 °C, 6 h) Whatman GF/F filters upon collection and the DOM fraction was concentrated by solid phase extraction (SPE) using reverse phase cartridges according to the protocol of Dittmar et al. (2008). A recovery rate of the reverse phase extraction for DOM is approximately 65 percent.30 The water was acidified with HCl (37%, Carl ROTH, Karlsruhe) to pH = 2 and pumped through the cartridges at a low flow rate of ∼30 mL min−1 by a membrane pump. Then the cartridges were purged twice with 6 mL Milli-Q water (pH = 2) to remove salt residues. The cartridge adsorber material was dried under a stream of N2, extracted with 6 mL of methanol (ultra LC-MS, Carl ROTH, Karlsruhe) and rapidly stored at −20 °C after the extraction. All glassware used was acid-washed (0.1 M HCl) and pre-combusted at 350 °C for 6 h.2.3. Measurement system and sample injection
For the chemical analysis of tDOM, a pyrolysis-gas chromatography/mass spectrometry (Py-GC/MS) system enabling simultaneous application of hard and soft ionization techniques was used (for details see ESI† S1), which had been successfully applied for the investigation of crude oil samples.39Before sample injection, the methanolic extract was preconcentrated under N2 (2 mL to 60 μL approximately), so that 0.5 to 1.0 mg of organic material is present. 10 μL of this extract were injected into the pyrolyzer (Frontier Laboratories, Double-Shot-Pyrolyzer, model: PY-2020iD), which is working with helium as carrier gas (head pressure 1 bar). The samples first undergo a thermal desorption (TD) process at 250 °C for one minute. After the TD process, the same sample is introduced for a second time after the oven was heated up to 500 °C. For analysis of the elevated chemical compounds, the pyrolyzer is coupled directly to a gas chromatograph (HP 5890 Series II), split 1![[thin space (1/6-em)]](https://www.rsc.org/images/entities/char_2009.gif) :
:![[thin space (1/6-em)]](https://www.rsc.org/images/entities/char_2009.gif) 10, equipped with a non-polar column (SGE-BPX-5; 30 m × 0.25 mm × 0.25 μm). The temperature program was conducted as follows: 60 °C (held for 2 min) to 320 °C (held for 12 min) with 10 °C min−1. After the separation process the gas flow was split (by a deactivated press fit 3-way Y-Splitter for FS tubing with 0.20 to 0.75 mm OD) and transferred simultaneously to two different mass spectrometers. One MS system is a QMS using EI with 70 eV. The other one is a ToFMS using [1 + 1]-REMPI (266 nm). The split ratio was 1
10, equipped with a non-polar column (SGE-BPX-5; 30 m × 0.25 mm × 0.25 μm). The temperature program was conducted as follows: 60 °C (held for 2 min) to 320 °C (held for 12 min) with 10 °C min−1. After the separation process the gas flow was split (by a deactivated press fit 3-way Y-Splitter for FS tubing with 0.20 to 0.75 mm OD) and transferred simultaneously to two different mass spectrometers. One MS system is a QMS using EI with 70 eV. The other one is a ToFMS using [1 + 1]-REMPI (266 nm). The split ratio was 1![[thin space (1/6-em)]](https://www.rsc.org/images/entities/char_2009.gif) :
:![[thin space (1/6-em)]](https://www.rsc.org/images/entities/char_2009.gif) 100 in favor of the EI-QMS. This is caused by the different column diameters. If the REMPI system gets the same amount of substance as the EI system, the multi channel plate (MCP) would be overloaded and detection of molecular ions would not be possible.
100 in favor of the EI-QMS. This is caused by the different column diameters. If the REMPI system gets the same amount of substance as the EI system, the multi channel plate (MCP) would be overloaded and detection of molecular ions would not be possible.
For calibration and optimization of the REMPI-ToFMS system a gas standard (Linde AG, Pullach, Germany) containing 1 ppm of each benzene, 1,2,4-trimethylbenzene, benzaldehyde and toluene in N2 was applied. For generating REMPI, a Nd:YAG laser (BIG SKY ULTRA, Quantel, Les Uli Cedex, France) with two frequency doubling units yielding 266 nm photons was employed, which corresponds to a photon energy of 4.11 eV. The laser is operated with 10 ns pulse width and a 20 Hz repetition rate exhibiting a power density of approximately 7 × 10⁶ W cm−2. A reflectron ToF-MS (Reflectron CTF10, Kaesdorf Geräte für Forschung and Industrie, Munich, Germany) is utilized for the detection of the molecular ions. Details about the coupling and more specific device parameters are given in Otto et al. (2015) and Fendt et al. (2012).36,39 The coupling of pyrolyzer and GC/MS with two distinct ionization methods was checked for functionality with an IHSS (International Humic Substances Society) reference sample (Nordic Reservoir NOM). The reference material was dissolved in Milli-Q water and the sample preparation was carried out in the same way as for the water samples. The samples were measured in a mass-to-charge-ratio (m/z) range from 10 to 400. On the one hand the total ion chromatograms (TIC) of EI-QMS were consulted to identify compounds with the help of different MS tools (NIST spectral library, mass spectral interpretation). On the other hand, if the data base information was inaccurate, then standard substances were dissolved (approximately 100 mg L−1) and subjected to chromatographic analysis or a tentative assignment was performed, based only on analysis of the fragmentation patterns. For semi quantitative statements the peak intensity of molecular ions of the REMPI-ToFMS measurements was used.
3. Results and discussion
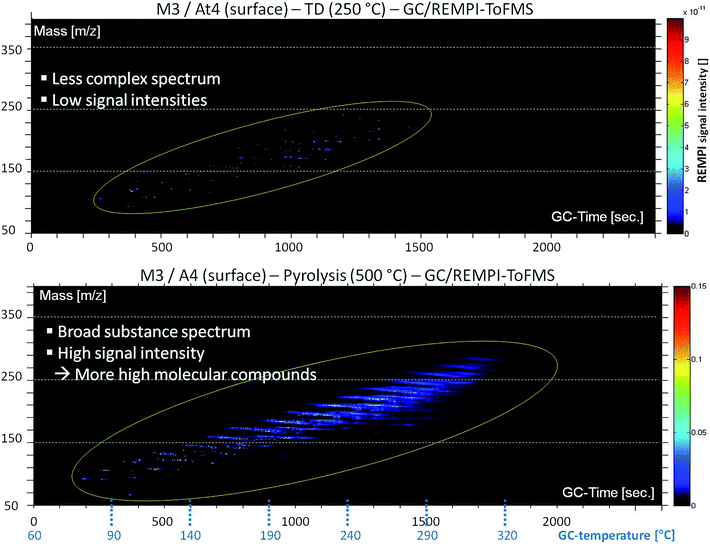
The high complexity of DOM in Baltic Sea water is evident from Fig. 2. It shows an aromatic fingerprint (detection by REMPI-ToFMS) of the sample under TD and pyrolysis conditions, respectively. The m/z ratio is plotted against GC retention time. The intensity of the mass signal is depicted as color display. The surface water of the northernmost station (At4) was analyzed. It has a much higher concentration of DOM in comparison to stations of lower latitudes due to many boreal and subarctic rivers, which drain in the Gulf of Bothnia and influence the water chemistry via a high tDOM input, especially in spring time.15 The TD step shows a less complex spectrum of substances with low signal intensities. Aromatic compounds are present in a mass range between m/z 70 and 250. In the pyrolysis step a broad substance spectrum with higher signal intensities is visible. The aromatic substance spectrum starts with an m/z-value of approximately 60 going up to 330.Fig. 2 illustrates that free evaporable molecular structures are barely present. In contrast, a lot of components are accessible only in the pyrolysis step. Hence, DOM mainly consists of large high molecular complex structures. Many of these are aromatic, especially phenolic compounds, hinting at lignin degradation products.32
With the help of EI-QMS, referring to the fragmentation pattern and database matching, (Wiley, Nist) a classification was successful. Some representatives of possible lignin derivatives are shown in Fig. 3. The GC retention time is displayed against the signal intensity for specific molecular ion tracks. Guaiacol (m/z 124, t(R) = 468 s), p-hydroxyacetophenone (m/z 136, t(R) = 698 s), 2,6-dimethoxyphenol (m/z 154, t(R) = 800 s) and vanillin (m/z 152, t(R) = 152 s) are typical degradation products of lignin. Phenol (m/z 94, t(R) = 370 s) could be a pyrolysis fragment of p-hydroxybenzoic acid, an H-building block of the lignin structure (Fendt et al., 2011; van Heemst et al., 2000).32,41 The direct comparison of the two ionization techniques shows that with EI nearly all structures are detectable, but the chromatograms get very complex. Moreover, fragmentation makes peak evaluation even more difficult, which is obvious for the traces m/z 152 (vanillin) and 154 (2,6-dimethoxyphenol), respectively, where the relevant peaks are difficult to detect. The simultaneously recorded REMPI-ToFMS spectrum depicts only the molecular ions of aromatic structures. The chromatograms become less complex. REMPI shows clear peak intensities for the aromatic structures vanillin (m/z 152) and 2,6-dimethoxyphenol (m/z 154). Therefore REMPI data are used for the subsequent statistical analysis (see below), whereas the EI data are still consulted for structural identification.
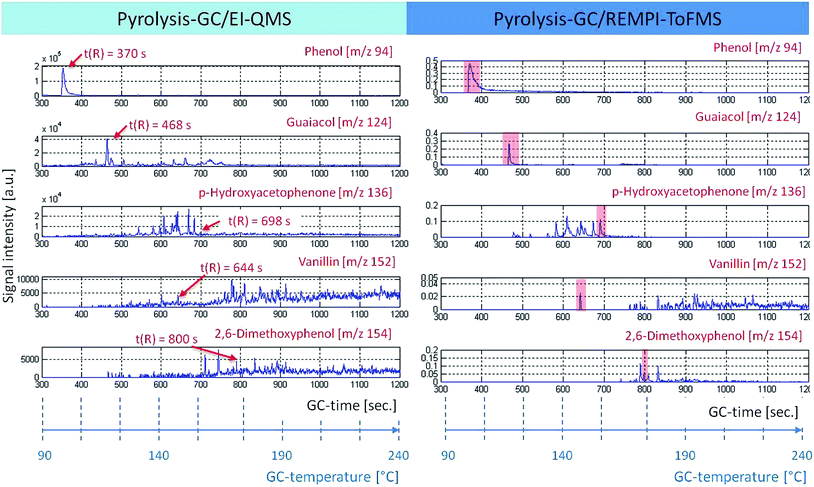 | ||
| Fig. 3 The time course of ion traces under pyrolysis conditions (retention time or GC temperature vs. signal intensity). It allows a direct composition between the two mass-selective detectors, EI-QMS (left) and REMPI-ToFMS (right). In particular, m/z 94, 124, 136, 152 and 154 can be related to possible lignin degradation products, which can be used as tracers for tDOM.32 | ||
3.1. Trends with salinity
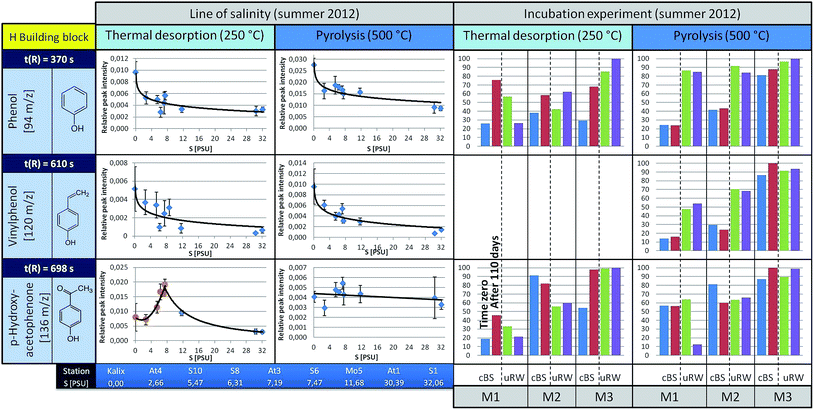
The changes of DOM with salinity as well as during the incubation experiments are discussed in the following on the basis of selected and frequently observed species representing the H-(phenol, vinyl phenol, p-hydroxyacetophenone), V-(guaiacol, 4-vinyl-2-methoxyphenol, vanillin) and S-building blocks (2,6-dimethoxyphenol, 4-vinyl-2,6-dimethoxyphenole, acetosyringone), respectively.2,16,21For data analysis and to obtain semi-quantitative results, the peak intensity from the REMPI-chromatogram of a molecule with a characteristic retention time is used. That was conducted for all stations from the Kalix river (tDOM source, lowest salinity) to the S1 station (highest salinity). On every station three replicates of the surface water samples were measured. The relative peak intensities were calculated and are illustrated in Fig. 4–6. For this, the peak intensity of the REMPI chromatogram of a molecular ion was divided by the total intensities for all nominal masses from 90 to 450 m/z in a certain time window. Under the additional assumption that the North Sea input (via Skagerrak) constitutes no source for the components of tDOM its influence is not considered.18
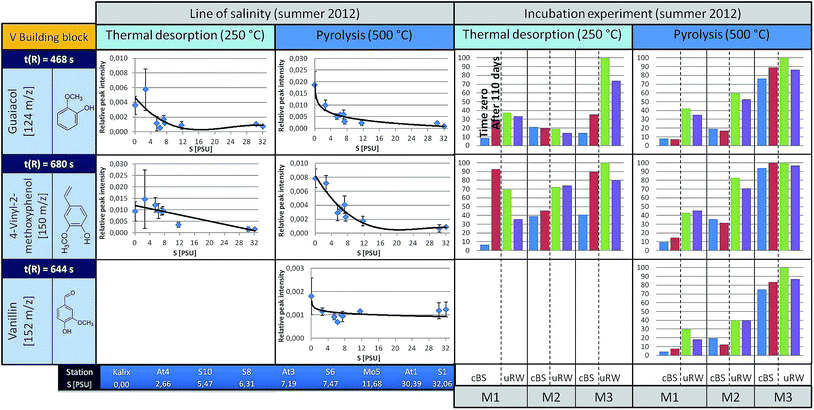 | ||
| Fig. 5 A summary for three representatives of the V building blocks is given (left: the courses along the line of salinity, right: the results of the incubation experiments, under TD and pyrolysis conditions). For detailed information see Fig. 4. In the free areas (the incubation experiment at 250 °C, component m/z 120) no insufficient data for a clean presentation was available. | ||
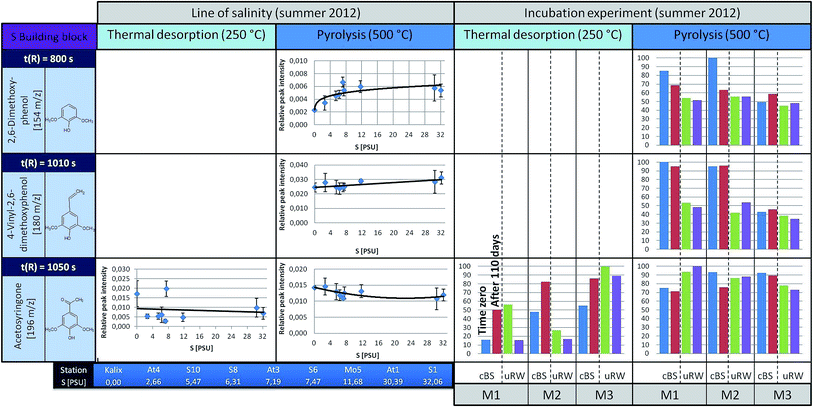 | ||
| Fig. 6 A summary for four representatives of the S building blocks is illustrated (left: the courses along the line of salinity, right: the results of the incubation experiments, under TD and pyrolysis conditions). For detailed information see Fig. 4 and 5. | ||
Phenol (m/z 94, t(R) = 370 s) is observed to show a decreasing trend from the river mouth to the S1 station (under TD conditions). It is feasible that it was released by biotic or abiotic processes from high molecular weight structures (e.g. lignin). To decide about this, incubation experiments were carried out, the results of which are discussed later. Under pyrolysis conditions phenol is also observed, with a slightly falling trend towards the higher salinity. The main origin of pyrolytic phenol is lignin. Similar courses are obtained for other H building block species such as vinylphenol (m/z 120, t(R) = 610 s).
In contrast, p-hydroxyacetophenone (m/z 136, t(R) = 698 s) shows a different pattern. The concentration of the free component clearly increases up to the S6 station and then decreases towards the salt water inflow. However, under pyrolysis conditions, its content remains almost unchanged. This suggests that the free substance (registered under TD conditions) is additionally formed by an alternative mechanism, which superimposes the general mechanisms forming other H-building blocks such as phenol. However, this only holds down to the latitude of the S6 station. The V-building blocks (Fig. 5), under TD as well as pyrolysis conditions, depict a similar decreasing trend along the Baltic Sea transect as the H-building blocks.
The S building blocks were taken into consideration (Fig. 6), although their input sources into the Baltic Sea should be very low, because there is mainly a freshwater surplus from Skandinavian rivers15 with typical vegetation of non-flowering vascular plants.13,21 Therefore, according to a signal-to-noise ≥ 3, the representatives 2,6-dimethoxyphenol and 4-vinyl-2,6-dimethoxyphenol could not be analyzed semi-quantitatively under TD conditions. Acetosyringone as the only detectable relevant substance under TD is represented graphically and shows a constant distribution along the transect. Under pyrolysis conditions the concentration of S-building blocks is generally higher. For 2,6-dimethoxyphenol and 4-vinyl-2,6-dimethoxyphenol a slightly rising trend is visible with increasing salinity. A possible explanation is that lignin components are introduced via the river systems, having their origin in angiosperm tissues. In general, the relative distribution pattern of the S-building blocks along the line of salinity does not change.
3.2. Incubation experiments
But what are the reasons that phenol and vinylphenol (free or macromolecular pyrolysis fragment) tend to decline with higher salt content? In addition to the degradation by sunlight or flocculation,9,23 microorganisms are possibly able to affect the compound concentration along the transect. This hypothesis was studied in the already mentioned tank experiments carried out for three stations, designated as M1, M2 and M3, corresponding to salinities of approximately S = 32, 7, and 3, respectively.The results for selected H-building blocks are also given in Fig. 4. The bars in the diagram represent the relative peak intensity of a molecule at the compound-specific retention time. For each station a control tank (cBS) and a mixing tank (uRW) are compared, both for time zero (blue or green bar) and after approximately 110 days of incubation, equivalent to the end of the experiment (red or purple bars).
The direct comparison between cBS- and uRW-tank at time zero shows that the phenolic fraction (under TD) increases significantly due to the addition of river water. This is obvious at all three stations. Comparing the cBS tank at time zero (cBSt0) with the state at the end of the experiment (cBStEnd) illustrates that the proportion of phenol increases. A similar trend is evident for the mixing tanks uRW (M2 and M3). The differing behavior of the uRW tank cannot be explained with the available data. Nevertheless, the free phenol content shows the tendency to be higher after 110 days. A possible source for this increase could be phenol previously bonded within the lignin structure, which is then released by microbial degradation. In order to prove this hypothesis, pyrolysis measurements were performed. If lignin was indeed degraded during the incubation experiment, the released pyrolytic phenol should decrease significantly after 110 days of incubation time, because it has already been microbially degraded. However, the phenol content between the start and the end time of incubation in all tanks stays nearly the same. This implies that the lignin in the tDOM is not degraded by microbial processes after all. Another source for the increase of the free phenol concentration in the TD step of the sBS and uRW tanks cannot be clearly assigned. For p-hydroxyacetophenone, it is difficult to give a reliable statement. In tendency, there hardly occurs a change under TD and pyrolysis conditions in the tank between time zero and 110 days.
The incubation experiment measurements of the V-building blocks under TD conditions show no clear trend. Vanillin was not detected, because its concentration at all stations is below the limit of detection (LOD) for the TD setup. For guaiacol and 4-vinyl-2-methoxyphenol with the exception of the M2 station a significant increase in concentration is observed in the cBS-tank after 110 days. With the M1 and M3 tanks an opposite trend between cBS and uRW samples is observed. For unraveling these contradicting findings, a broader data basis from additional experiments will be needed. In general, the V-building blocks behave similar to the H-building blocks, especially the absence of significant changes in the pyrolytic experiments is striking, corroborating the findings of the H-building blocks.
In the incubation experiments of the S-building blocks samples under TD conditions exhibited too low peak intensities. Under pyrolysis conditions no clear significant changes are observed between the start and end point of sampling for both the cBS and the uRW tank.
The biggest effect on the chemical composition of the tDOM is caused by the added, salinated river water (see ESI,† S2) in the incubation. In order to take a closer look on these effects, in the next section PCA is applied, which can be a helpful tool for data interpretation.
3.3. Principal component analysis (PCA)
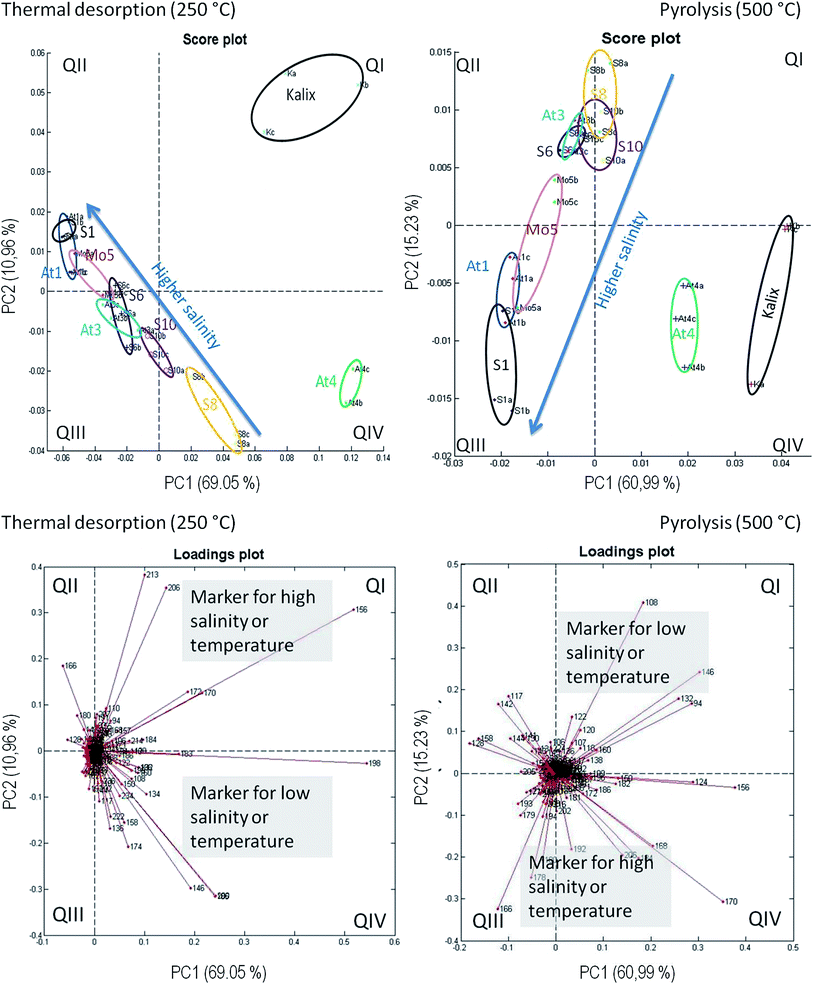
Principal component analysis on the basis of the REMPI-ToFMS data was used as a statistical tool in order to detect structural changes along the salt gradient. In addition, PCA is utilized to evaluate the repeatability of technical replicates. The peak intensities of nominal masses between 50 and 350 m/z of a GC run were taken. For the three technical replicates of each station and between each station the retention times for the peak have to be matched. For this a self-developed specific software routine (in Matlab) is used that allows an automatic correction of the time shifts between the GC runs. Finally, the performed PCAs are resulting in a matrix of 27 measurements (3 replicates × 9 stations), the nominal masses 50–350 m/z and the maxima peak intensities for every ion trace. The data were normalized by the sum peak intensities in the window of the observed mass-to-charge ratio. The reduction to one peak per nominal mass leads to a loss of information, but is necessary for handling and interpreting the huge amount of data.The results are displayed in Fig. 7. The repeatability of technical replicates is quite recognizable, the three measurements from each station are grouped together. An axis assignment for PC1 and PC2 is not clearly possible. Both reflect the trend of salinity as well as of temperature. These parameters decrease accordingly from the southwest to the northeast of the Baltic Sea. This would explain the apparent diagonal course in the diagram. In the TD step the stations extend in a line from the QII to the QIV sector, according to the salinity or temperature pattern. Apparently, except for the stations S8 and S10, a straight relationship between the molecular structure and abiotic parameters exists. In this context, the separation of the stations is not linear and logically grouped with the salinity gradient. The reasons are unclear and difficult to explain by one parameter. The At4 replicates are located in sector IV, but not in line with the other stations. The replicates of Kalix even significantly differ and have an outstanding position in the plot. Roughly the PCA can be divided in two different areas, the Kalix/At4 and the remaining line of salinity from S1 to S10.
The appropriate loadings plot shows some significant m/z values under TD conditions. Those nominal masses are situated in sector QIV, which are present at a lower salinity, for example m/z 136 as a possible lignin building block. In addition m/z 146, 192, 196 and 206 are significant for the location of At4 in this sector, however, a structural characterization for these m/z values was not possible. In sector QII nominal masses are located, which are linked to higher salinities, for example m/z 128 (naphthalene) or 166 (fluorene). They represent typical markers for polycyclic aromatic hydrocarbons (PAH) as a possible result of massive ship traffic in the Kattegat/Skagerak area.42 These two m/z-ratios and m/z 180 (unknown structure) strongly influence the course. The m/z values 156, 170, 172, 206 and 213 are detected in the Kalix river, which are responsible for the location of the replicates in QI. A structural characterization is difficult, but a contamination by a plasticizer cannot be excluded.
The PCA under pyrolysis conditions shows a curve from sector 3 up to 1 along the line of decreasing salinity. Under high salinity conditions, again PAH representatives are responsible for the shift. The loadings plot illustrates that m/z 166 (fluorene) or 178 (phenanthrene) are dominant at a high salinity (QIII). In QI (low salinity) mainly the nominal masses m/z 94, 108, 124, 132, 146, 156 and 170 – all of them representing lignin moieties – are responsible for the At4 and Kalix replicates having high positive PC1 scores and that is the reason why these two stations are differing from the others.
As a summary, the results of the PCA are consistent with those from the trend charts before. The abiotic factor salinity has a high influence on the DOM composition. A further important factor for the separation of sampling stations with respect to DOM mixture is the content of lignin derived species and PAH, indicating the influence of terrestrial material and anthropogenic input.
4. Conclusion
The compositional changes of DOM in the Baltic Sea were studied with respect to two different aspects: first, along a Baltic Sea surface water transect and secondly with a focus on the microbial degradation under various special salinity conditions. The chemical analysis of the water samples were carried out by a new coupled system, which has already been successfully tested on crude oil samples.39Generally along the salinity gradient, referring to the semi-quantitative measurements, a decrease of free and bonded lignin compounds was observed. The PCA underlines that, additionally showing a correlation between salt content and DOM composition. This trend of lignin along salinity is well described in the literature,43 but the used method of TD and pyrolysis in combination with REMPI was applied for the first time for DOM characterization and allows the analysis of aromatic and macromolecular species in a relatively easy way.
Salinity has a crucial influence on DOM concentration and especially on the lignin derived structures. Other compound classes such as PAH are also affected, which is the subject of currently conducted additional analyses. In contrast, microorganisms are hardly breaking the lignin structure. This follows from the semi-quantitative analysis under pyrolysis conditions. Compared to this, under TD conditions changes are quite visible but difficult to interpret. It cannot be ruled out that on different conditions and longer time scales microorganisms would break the lignin structure. Especially several abiotic factors such as wind (continuous mixing, fresh air supply) and UV radiation were excluded in the current setup.
Nonetheless, the coupled system, consisting of a pyrolyzer, a gas chromatograph and two mass selective mass analyzers, has been proven useful to analyze water samples with respect to their DOM content. A sample separation and a combination of universal as well as selective and sensitive detection are advantageous for the characterization of the complex DOM. In particular trace levels of low molecular weight substances (free components or pyrolytic degradation products) can be detected. The analytical method enables a closer look at the molecular composition of natural samples.
The measuring setup could be optimized further by using varying GC columns or a GC × GC system for a higher separation power.44,45 By the use of other relevant wavelengths for REMPI other substances should be accessible. Moving to higher wavelengths, larger aromatic species are ionized more efficiently.37 By an increase of the pulse frequency (femtosecond LASER) short-lived intermediate states of molecules are better stabilized and the sensitivity thus increases.46
Acknowledgements
Leibniz-Gemeinschaft is acknowledged for financial support of the ATKiM project. A special thanks goes to S. Klingbeil for the development of tools for data analysis and I. Hand for the support by planning our cruise. Many thanks goes to V. Trommer for his constructive comments and opinions.References
- T. S. Bianchi, The role of terrestrially derived organic carbon in the coastal ocean: a changing paradigm and the priming effect, Proc. Natl. Acad. Sci. U. S. A., 2011, 108(49), 19473–19481 CrossRef CAS PubMed.
- A. Nebbioso and A. Piccolo, Molecular characterization of dissolved organic matter (DOM): a critical review, Anal. Bioanal. Chem., 2013, 405(1), 109–124 CrossRef CAS PubMed.
- D. P. R. Herlemann, M. Manecki, C. Meeske, F. Pollehne, M. Labrenz, D. Schulz-Bull, T. Dittmar and K. Juergens, Uncoupling of bacterial and terrigenous dissolved organic matter dynamics in decomposition experiments, PLoS One, 2014, 9(4), e93945 Search PubMed.
- V. Kisand, S. Gebhardt, J. Rullkotter and M. Simon, Significant bacterial transformation of riverine humic matter detected by pyrolysis GC-MS in serial chemostat experiments, Mar. Chem., 2013, 149, 23–31 CrossRef CAS.
- V. Kisand, D. Rocker and M. Simon, Significant decomposition of riverine humic-rich DOC by marine but not estuarine bacteria assessed in sequential chemostat experiments, Aquat. Microb. Ecol., 2008, 53, 151–160 CrossRef.
- T. Dittmar and G. Kattner, The biogeochemistry of the river and shelf ecosystem of the Arctic Ocean: a review, Mar. Chem., 2003, 83(3–4), 103–120 CrossRef CAS.
- S. Opsahl and R. Benner, Photochemical reactivity of dissolved lignin in river and ocean waters, Limnol. Oceanogr., 1998, 43(6), 1297–1304 CrossRef CAS.
- D. Rocker, V. Kisand, B. Scholz-Böttcher, T. Kneib, A. Lemke, J. Rullkötter and M. Simon, Differential decomposition of humic acids by marine and estuarine bacterial communities at varying salinities, Biogeochemistry, 2012b, 111(1–3), 331–346 Search PubMed.
- B. Rosenstock, W. Zwisler and M. Simon, Bacterial consumption of humic and non-humic low and high molecular weight DOM and the effect of solar irradiation on the turnover of labile DOM in the Southern Ocean, Microb. Ecol., 2005, 50(1), 90–101 CrossRef CAS PubMed.
- J. Wikner, R. Cuadros and M. Jansson, Differences in consumption of allochthonous DOC under limnic and estuarine conditions in a watershed, Aquat. Microb. Ecol., 1999, 17(3), 289–299 CrossRef.
- P. J. Hernes and R. Benner, Terrigenous organic matter sources and reactivity in the North Atlantic Ocean and a comparison to the Arctic and Pacific oceans, Mar. Chem., 2006, 100(1–2), 66–79 CrossRef CAS.
- E. B. Kujawinski, The impact of microbial metabolism on marine dissolved organic matter, Annual Review of Marine Science, 2011, 3, 567–599 CrossRef PubMed.
- A. Miltner and K. C. Emeis, Terrestrial organic matter in surface sediments of the Baltic Sea, Northwest Europe, as determined by CuO oxidation, Geochim. Cosmochim. Acta, 2001, 65(8), 1285–1299 CrossRef CAS.
- D. Rocker, T. Brinkhoff, N. Gruener, M. Dogs and M. Simon, Composition of humic acid-degrading estuarine and marine bacterial communities, FEMS Microbiol. Ecol., 2012, 80(1), 45–63 CrossRef CAS PubMed.
- C. Humborg, E. Smedberg, S. Blomqvist, C. M. Morth, J. Brink, L. Rahm, A. Danielsson and J. Sahlberg, Nutrient variations in boreal and subarctic Swedish rivers: landscape control of land-sea fluxes, Limnol. Oceanogr., 2004, 49(5), 1871–1883 CrossRef CAS.
- J. R. Ertel, J. I. Hedges and E. M. Perdue, Lignin signature of aquatic humic substances, Science, 1984, 223(4635), 485–487 CAS.
- R. L. Sleighter and P. G. Hatcher, Molecular characterization of dissolved organic matter (DOM) along a river to ocean transect of the lower Chesapeake Bay by ultrahigh resolution electrospray ionization Fourier transform ion cyclotron resonance mass spectrometry, Mar. Chem., 2008, 110(3–4), 140–152 CrossRef CAS.
- S. Opsahl and R. Benner, Distribution and cycling of terrigenous dissolved organic matter in the ocean, Nature, 1997, 386(6624), 480–482 CrossRef CAS.
- R. M. W. Amon and H. P. Fitznar, Linkages among the bioreactivity, chemical composition, and diagenetic state of marine dissolved organic matter, Limnol. Oceanogr., 2001, 46(2), 287–297 CrossRef CAS.
- T. Dittmar, H. P. Fitznar and G. Kattner, Origin and biogeochemical cycling of organic nitrogen in the Eastern Arctic ocean as evident from D- and L-amino acids, Geochim. Cosmochim. Acta, 2001, 65(22), 4103–4114 CrossRef CAS.
- J. I. Hedges and J. R. Ertel, Characterisation of lignin by gas capillary chromatography of cupric oxide oxidation-products, Anal. Chem., 1982, 54(2), 174–178 CrossRef CAS.
- M. A. Goni and J. I. Hedges, Sources and reactivities of marine-derived organic-matter in coastal sediments as determined by alkaline CuO oxidation, Geochim. Cosmochim. Acta, 1995, 59(14), 2965–2981 CrossRef CAS.
- E. R. Sholkovitz, Flocculation of dissolved organic and inorganic matter during mixing of river water and sea water, Geochim. Cosmochim. Acta, 1976, 40(7), 831–845 CrossRef CAS.
- T. Dittmar, K. Whitehead, E. C. Minor and B. P. Koch, Tracing terrigenous dissolved organic matter and its photochemical decay in the ocean by using liquid chromatography/mass spectrometry, Mar. Chem., 2007, 107(3), 378–387 CrossRef CAS.
- R. Benner and K. Kaiser, Biological and photochemical transformations of amino acids and lignin phenols in riverine dissolved organic matter, Biogeochemistry, 2011, 102(1–3), 209–222 CrossRef CAS.
- J. B. Fellman, R. G. M. Spencer, P. J. Hernes, R. T. Edwards, D. V. D'Amore and E. Hood, The impact of glacier runoff on the biodegradability and biochemical composition of terrigenous dissolved organic matter in near-shore marine ecosystems, Mar. Chem., 2010, 121(1–4), 112–122 CrossRef CAS.
- F. Shiah and H. W. Ducklow, Multiscale variability in bacterioplankton abundance, production, and specific growth rate in a temperate salt-marsh tidal creek, Limnol. Oceanogr., 1995, 40(1), 55–66 CrossRef CAS.
- L. D. Guo, D. M. White, C. Xu and P. H. Santschi, Chemical and isotopic composition of high-molecular-weight dissolved organic matter from the Mississippi River plume, Mar. Chem., 2009, 114(3–4), 63–71 CrossRef CAS.
- K. J. Meyersschulte and J. I. Hedges, Molecular evidence for a terrestrial component of organic-matter dissolved in ocean water, Nature, 1986, 321, 61–63 CrossRef CAS.
- T. Dittmar, B. Koch, N. Hertkorn and G. Kattner, A simple and efficient method for the solid-phase extraction of dissolved organic matter (SPE-DOM) from seawater, Limnol. Oceanogr.: Methods, 2008, 6, 230–235 CrossRef CAS.
- H. R. Schulten and G. Gleixner, Analytical pyrolysis of humic substances and dissolved organic matter in aquatic systems: structure and origin, Water Res., 1999, 33(11), 2489–2498 CrossRef CAS.
- J. D. H. van Heemst, J. C. del Rio, P. G. Hatcher and J. W. de Leeuw, Characterization of estuarine and fluvial dissolved organic matter by thermochemolysis using tetramethylammonium hydroxide, Acta Hydrochim. Hydrobiol., 2000, 28(2), 69–76 CrossRef CAS.
- U. Boesl, H. J. Neusser and E. W. Schlag, Multiphoton ionization in the mass-spectrometry of polyaromatic-molecules-cross-sections, Chem. Phys., 1981, 55(2), 193–204 CrossRef CAS.
- U. Boesl, Multiphoton excitation and mass selective ion detection for neutral and ion spectroscopy, J. Phys. Chem., 1991, 95(8), 2949–2962 CrossRef CAS.
- R. Zimmermann, U. Boesl, C. Weickhardt, D. Lenoir, K. W. Schramm, A. Kettrup and E. W. Schlag, Isomer-selective ionization of chlorinated aromatics with LASERs for analytical time-of-flight mass-spectrometry – first results for polychlorinated dibenzo-p-dioxins (PCDD), biphenyls (PCB) and benzenes (PCBZ), Chemosphere, 1994, 29(9–11), 1877–1888 CrossRef CAS.
- A. Fendt, R. Geissler, T. Streibel, M. Sklorz and R. Zimmermann, Hyphenation of two simultaneously employed soft photo ionization mass spectrometers with thermal analysis of biomass and biochar, Thermochim. Acta, 2012, 551, 155–163 CrossRef.
- O. P. Haefliger and R. Zenobi, Laser mass spectrometric analysis of polycyclic aromatic hydrocarbons with wide wavelength range laser multiphoton ionization spectroscopy, Anal. Chem., 1998, 70(13), 2660–2665 CrossRef CAS PubMed.
- R. Zimmermann, C. Lermer, K. W. Schramm, A. Kettrup and U. Boesl, 3-Dimensional trace analysis-combination of gas-chromatography, supersonic beam UV spectroscopy and time-of-flight mass-spectrometry, Eur. Mass Spectrom., 1995, 1(4), 341–351 CrossRef CAS.
- S. Otto, T. Streibel, S. Erdmann, M. Sklorz, D. Schulz-Bull and R. Zimmermann, Application of pyrolysis-mass spectrometry and pyrolysis-gas chromatography-mass spectrometry with electron-ionization or resonance-enhanced-multi-photon ionization for characterization of crude oils, Anal. Chim. Acta, 2015, 855, 60–69 CrossRef CAS PubMed.
- D. P. R. Herlemann, M. Labrenz, K. Juergens, S. Bertilsson, J. J. Waniek and A. F. Andersson, Transitions in bacterial communities along the 2000 km salinity gradient of the Baltic Sea, ISME J., 2011, 5(10), 1571–1579 CrossRef CAS PubMed.
- A. Fendt, T. Streibel, M. Sklorz, D. Richter, N. Dahmen and R. Zimmermann, On-Line Process Analysis of Biomass Flash Pyrolysis Gases Enabled by Soft Photoionization Mass Spectrometry, Energy Fuels, 2011, 26(1), 701–711 CrossRef.
- HELCOM, Report on Shipping Accidents in the Baltic Sea Area for the Year, 2010.
- L. Hoikkala, P. Kortelainen, H. Soinne and H. Kuosa, Dissolved organic matter in the Baltic Sea, J. Mar. Syst., 2015, 142, 47–61 CrossRef.
- M. S. Eschner, W. Welthagen, T. M. Groger, M. Gonin, K. Fuhrer and R. Zimmermann, Comprehensive multidimensional separation methods by hyphenation of single-photon ionization time-of-flight mass spectrometry (SPI-TOF-MS) with GC and GC × GC, Anal. Bioanal. Chem., 2010, 398(3), 1435–1445 CrossRef CAS PubMed.
- W. Welthagen, S. Mitschke, F. Muhlberger and R. Zimmermann, One-dimensional and comprehensive two-dimensional gas chromatography coupled to soft photo ionization time-of-flight mass spectrometry: a two- and three-dimensional separation approach, J. Chromatogr. A, 2007, 1150(1–2), 54–61 CrossRef CAS PubMed.
- A. Li, T. Imasaka and T. Uchimura, Analysis of pesticides by gas chromatography/multiphoton ionization/mass spectrometry using a femtosecond laser, Anal. Chim. Acta, 2011, 701(1), 52–59 CrossRef CAS PubMed.
Footnote |
| † Electronic supplementary information (ESI) available. See DOI: 10.1039/c5ay01292a |
| This journal is © The Royal Society of Chemistry 2016 |

