
 Open Access Article
 This Open Access Article is licensed under a Creative Commons Attribution-Non Commercial 3.0 Unported Licence
Structural and elemental changes in glioblastoma cells in situ: complementary imaging with high resolution visible light- and X-ray microscopy†
Tanja
Dučić
*a,
Tatjana
Paunesku
b,
Si
Chen
c,
Milena
Ninković
d,
Swetlana
Speling
d,
Charlene
Wilke
e,
Barry
Lai
c and
Gayle
Woloschak
b
aCELLS – ALBA, Carrer de la Llum 2-26, 08290 Cerdanyola del Vallès, Barcelona, Spain. E-mail: tducic@cells.es
bDepartment of Radiation Oncology, Northwestern University, 300 E. Superior St, Chicago, IL 60611, USA
cAdvanced Photon Source, Argonne National Laboratory, 9700 S. Cass Avenue, Argonne, IL 60439, USA
dDepartment of Neurosurgery, Georg-August University Medical Centre, 37075 Göttingen, Germany
eNorthwestern University, Biological Imaging Facility, 2205 Tech Drive, Evanston, IL 60208, USA
First published on 9th December 2016
Abstract
The glioblastoma (GBM) is characterized by a short median survival and an almost 100% tumor related mortality. GBM cells exhibit highly invasive behavior whose mechanisms are not yet fully understood. The present study explores application of X-ray and visible light microscopy to display the elemental and structural images of cells from 3 patient derived GMB samples and an established GMB cell line. Slight differences in elemental concentrations, in actin cytoskeleton organization and cell morphology were noted between all cells types by X-ray fluorescence and full field soft X-ray microscopy, as well as the Structured Illumination Super-resolution Microscope (SIM). Different sample preparation approaches were used to match each imaging technique. While preparation for SIM included cell fixation and staining, intact frozen hydrated cells were used for the trace element imaging by hard X-ray fluorescence and exploration of the structural features by soft X-ray absorption tomography. Each technique documented differences between samples with regard to morphology and elemental composition and underscored the importance of use of multiple patient derived samples for detailed GBM study.
Introduction
Gliomas are the most common primary human brain tumors which comprise a heterogeneous group of benign and malignant neoplasms that are histologically classified according to the World Health Organization in four groups (WHO I–IV). Glioblastomas (WHO IV) are characterized by a short median survival and an almost 100% tumor related mortality. Despite the development of new treatments in recent years, the overall survival has improved marginally.1 Radiotherapy is only transiently effective, illustrating the profound impact of treatment resistance on prognosis. Although cancer genomics is providing impressive insights into the mutations that drive cancer progression, it is not yet possible to establish exactly how (which mutations) and where (in which cell types) the first steps toward cancer occur.2In recent years, there has been increasing interest in methods aimed to foster our understanding of biochemical processes related to the development of glioblastoma. Different non-invasive and label-free spectroscopic methods are used including Raman- and infrared-spectro-microscopy.2 Current progress in X-ray imaging technologies and the establishment of dedicated facilities have made X-ray microscopy an important new tool for the neuroscience imaging. The novel bio-imaging stations at the synchrotrons provide the ideal sample environment and handling capabilities for X-ray imaging in biomedical applications in general.3 Synchrotron-radiation-based X-ray fluorescence and full field single cells microscopy together have not been, to our knowledge, applied to single cells extracted from patient GBM samples. It is conceivable that this type of imaging analysis of GBM cells in culture could be used to supplement information gained from other non-imaging techniques and link genetic heterogeneity of primary patient derived cells with elemental and structural features of cryo-preserved cells and open the doors to new insights into this disease.
In this study we merged information of two different X-ray microscopes: the soft X-ray tomography and hard X-ray fluorescence (XRF), together with high resolution visible light cells imaging. The Structured Illumination Super-resolution Microscope (SIM) provided additional information regarding the cytoskeleton of different glioblastoma cells. In order to determine elemental maps of GBM cells the XRF imaging was performed. We used two instruments at the Advanced Photon Source (APS) at Argonne National Laboratory (ANL): the Bionanoprobe and the hard X-ray microprobe at the sector 2-ID-D. At the Bionanoprobe X-rays can be focused to a spot as small as 30 nm to provide high resolution imaging of flash frozen, fully hydrated cells at cryogenic temperatures;4 microprobe at sector 2-ID-D, on the other hand, uses a beam focused to 150 nm at its best. Importantly, both of the X-ray microscopes operating at APS mentioned have cryo-operating capacity, where the sample in natural milieu is kept under low temperature; scanning at cryogenic temperature also minimizes the X-ray damage.
To understand possible cellular structural changes of glioblastoma, the synchrotron based transmission soft X-ray full-field microscope operating in “water window” energy range (520 eV) was used for ultrastructural imaging at the synchrotron ALBA, Barcelona. Furthermore, this microscope has the ability to obtain tomographic data set at a higher spatial resolution than confocal visible light microscopy. Moreover, this instrument has the ability to operate under cryo-conditions and the samples can be preserved by freezing, without chemical fixation and thus in a state close to physiological conditions. Importantly, both hard X-ray microscopes and the instrument for soft X-ray tomography can be used to image whole cells without embedding and sectioning. The soft X-ray tomography allows investigation of the 3D structural information of the cultured glioma cells with the resolution of around 40 nm,5 linking the resolution between visible light and electron microscopy. Moreover, this resolution matches well with that obtained with the hard X-rays at the Bionanoprobe instrument.6
In this study we combined hard X-ray imaging with soft X-ray tomography in order to gain a deeper insight into cellular elemental and structural features. Keeping in mind large diversity of different GBM, in this study we have compared glioblastoma cells developed from different brain tumor tissues isolated from three different patients: 11ST, 36ST and 86ST, as well as the commercially available glioblastoma cell line U87MG. We believe that this approach may create a new vantage point for cancer research in general and glioblastoma in particular, especially when combined with other molecular non-imaging techniques.
Material and methods
Preparation of the cancer cells samples of human glioblastoma in culture
Glioma cells isolated from 3 different patients with glioma grade IV (11ST, 36ST and 86ST), were cultivated at University Medicine Göttingen, Germany. The cell medium contained MEM 500 ml (Gibco), 10% heat inactivated foetal calf serum, 2 mM L-Glutamine (GIBCO), 1 mM Na Pyruvate (GIBCO, 11360-039) and PenStrep (Thermo Fisher). Isolated cells, 4 × 10⁴ per flask, were speeded into a 25 cm2 flask into 5 ml of medium, and incubated at 37 °C and 5% CO2. On day 3 cells were collected and placed on Si3N4 membranes for 24 h prior to plunge freezing.Commercially available GBM cell line U87MG was obtained from ATCC and maintained according to the instructions provided. The base medium for this cell line is ATCC-formulated Eagle's Minimum Essential Medium, and the complete growth medium contained 10% of fetal bovine serum. Prior to collection cells were briefly rinsed with Ca++/Mg++ free Dulbecco's phosphate-buffered saline (D-PBS), trypsinized and placed on Si3N4 membrane for 24 h in cell culture medium prior to plunge freezing, the same as patient derived GBM cells.
Sample preparation for X-ray microscopy
The sample preparation included preservation of the intact cells by plunge freezing in liquid ethane. This work was done at the Biological Imaging Facility, Northwestern University, Evanston campus. Samples were kept under cryogenic conditions and used for hard X-ray fluorescence microscopy and full field soft X-ray microscopy measurements without freeze-drying. Imaging of frozen-hydrated cells under cryogenic conditions is a reliable way to preserve the structure of the cell and minimize rearrangement or loss of diffusible ions7 as well as to minimize radiation damage accumulation in the course of X-ray imaging. Previous work8 has shown (i) that best reproducibility and sensitivity of XRF, (ii) best preservation of elemental oxidation state by XANES and (iii) minimal beam damage can be achieved when cells were analyzed in a frozen hydrated state.Prior to plunge freezing live-cells were thoroughly washed with fresh PBS buffer pH = 7.4 in order to remove excess extracellular metal ions. Samples were quickly blotted for 1s with fine filter paper and immediately rapidly plunged in liquid ethane cooled with liquid nitrogen, by using the FEI Vitrobot™ Mark IV and subsequently stored under liquid nitrogen until imaging.
Prior to XRF imaging, frozen samples were examined under cryogenic conditions by using a cryo optical fluorescence microscope (Nikon 50i) at the APS. The cryo-stage CLM77K (Instec, Inc. USA) mounted on the optical microscope allowed us to work at temperature of liquid nitrogen and to choose for subsequent analysis only those cells that are of highest interest for imaging with the X-ray microprobe.
Confocal microscopy
Cells were imaged using a laser scanning confocal microscope equipped with resonant scanner that allows user to scan up to 400 fps (Nikon A1R). To identify cellular cytoskeleton and nucleus, cells were fixed with 3.7% formaldehyde for 10 min at 37 °C, washed twice with potassium-phosphate buffer (PBS) pH = 7.4, permeabilized with 0.1% TRITON X-100 in PBS for 5 min and washed in 1% BSA in PBS for 20 min.Alexa Fluor® 647 phalloidin (ThermoFisher) was used to visualize F-actin in cell cultures and the staining was done for 30 min at 37 °C. After washing the cells 2 times with PBS puffer, nuclei were stained by Hoechst 33342 (Invitrogen) for 10 min. A drop of Prolong Gold Antifade reagent was used prior to covering the slide with a cover glass.
Confocal cell images were taken on the Nikon A1R microscope. This microscope is equipped with multiple lasers and has multispectral unmixing capability; work was done with 405 nm and 633 nm excitation wavelengths. For each visual field, images at 40× magnification were taken.
For fine cytoskeleton structure, we used the Nikon Structured Illumination Super-resolution Microscope. With the software setup provided, this instrument has spatial resolution of up to 115 nm for multiple wavelengths (405, 488, 561, and 640 nm). The images were captured in 2D (with Piezo stepping) and Total Internal Reflection Fluorescence (TIRF) mode.
X-ray fluorescence microscopy at the Bionanoprobe and 2-ID-D X-ray microprobe at the APS synchrotron, USA
X-ray microscopy was performed at two instruments at the Advanced Photon Source (APS) at Argonne National Laboratory. The X-ray fluorescence microprobe at 2-ID-D is an instrument that uses a cooled nitrogen gas produced by cryojet (Oxford Instruments, UK) to allow cryogenic temperature scanning studies with monochromatic 10 keV X-rays best suitable for elemental excitation at the K-absorption edge of elements between Si and Zn. Currently, the best spatial resolution of this instrument is 150–200 nm and spectral resolution of 0.5 eV.Furthermore, to determine the distribution of trace metals within intact cells with the best possible resolution, we used the recently installed Bionanoprobe instrument at 21-ID-D beamline. The Bionanoprobe (BNP) is the first and only X-ray fluorescence microscope (XFM) that allows imaging of frozen-hydrated biological samples up to 10–20 μm thickness, with an X-ray beam that can be focused to 30 nm.4,6 The BNP is equipped with cryogenic capabilities and a robotic sample loading mechanism, which enables frozen-hydrated biological samples and other organic samples to be studied at temperatures close to 100 K. In this experiment, we used the nano-beam X-ray fluorescence imaging to obtain maps of distribution of trace elements with 100 nm spatial resolution at 10 keV. The step size during the scanning was 150 nm for the image in Fig. 4, and 300 nm for images shown in Fig. 5–7, and dwell time per pixel between 200 and 300 ms, with the focused beam flux of 3.5 × 10⁹ photons per s. Spectra were collected on a pixel by pixel basis at 10 keV incident energy at the BNP and 2-ID-D. The MAPS program was used for fitting and analysis of elemental concentration.9 Thin film standards (NBS-1832/33) (The National Institute of Standards and Technology, USA) and RF8-200-S2453 (AXO DRESDEN GmbH, Germany) were used at the 2-ID-D and the BNP, respectively, allowed for elemental quantity calibration.
Data acquisition and analysis
For image and spectra analysis we used MAPS, a freely available software for X-ray fluorescence analysis developed at the APS.9 The algorithms employed are described in detail elsewhere.10Average cellular element concentration was determined after definition of regions of interest (ROIs) so as to have them matched with single cells. Elemental map for potassium map was used to define ROIs in the MAPS software. Elemental concentrations per cell were calculated as means (±SE) of 15 cells for U87MG cell line and of 9 cells for each primary glioma cells group. Statistical analyses of the data were performed using multivariate analysis of variance (ANOVA) in OriginLab 9-1 Pro software (Northampton, MA, USA). In cases of a positive ANOVA finding, we used post hoc Tukey's test. Differences were considered significant with P ≤ 0.05. It should be mentioned that the elemental concentrations were calculated in units of mass per sample surface, while the cell volume under the surface varies. There was no depth resolution in the experiment due to high penetrance of hard X-rays, and the self-absorption of signal was small; therefore the thickness variations do not influence the fluorescence yield.
X-ray full field tomography at the Mistral beamline, at the synchrotron Alba, Spain
The cells were seeded on gold quantifoil R 2/2 holey film microscopy grids Au-G200F1 (Quantifoil, Jena, Germany). Samples were vitrified by plunge freezing and transferred into transmission X-ray microscope (TXM) at the Mistral beamline at the ALBA-Light Source, Spain.5 The acquisition time was 1s by using X-rays at 520 eV photon energy and each X-ray projections were taken with 1° tilt steps at liquid nitrogen temperature. The zone plate objective with an outermost zone width of 40 nm was used; alignment reconstruction and segmentation were performed as described in.11 Alignment of the tilted series was done with IMOD12 and the final reconstructions were performed using the iterative SIRT reconstruction option in TOMO3D.13Results
In this study we explored possibility to investigate individual patient-derived (participants) GBM cells in parallel with optical and X-rays microscopes and compared them with the commercially available glioblastoma cell line. Advantages of X-ray microscopy come from small wavelength and high penetrance of X-rays and the compatibility of cryo-setups with physiological sample environments. In this work both soft and hard X-ray microscopes were used; due to inherent X-ray photon energy and technique differences, two different X-ray microscopes complement each other. As a starting point we used high resolution visible light microscopy as well to record the structural cytoskeleton shape features in “standard” and patient derived glioblastoma cells in culture.Visible light microscopy
The confocal visible light microphotographs of four different glioblastoma cells lines are shown in Fig. 1. Representative fluorescence microphotograph of F-actin (stained with fluorescently labeled phalloidin, in green) and nucleus (DAPI, in red) in different cells are shown. Different cytoskeleton organization and the size of the nuclei were noticeable in 11ST, 36ST and 86ST cells vs. established GBM cell line U87MG. To get deeper insight in the structural organization of the cytoskeleton filaments of these cells, the structural illumination microscopy (SIM) was used (Fig. 2). The SIM is a super-resolution visible light microscopy that employs an algorithm to create a single super-resolution image from a series of individual pictures each acquired through a moving diffraction grating placed in different positions that generates “moiré fringes”. The position of the grating in each image and other characteristics of the microscope configuration such as the Point Spread Function (PSF) are used to extract super-resolution information in Fourier space that can result in a greater than two-fold gain in resolution above the actual optical resolution of the microscope.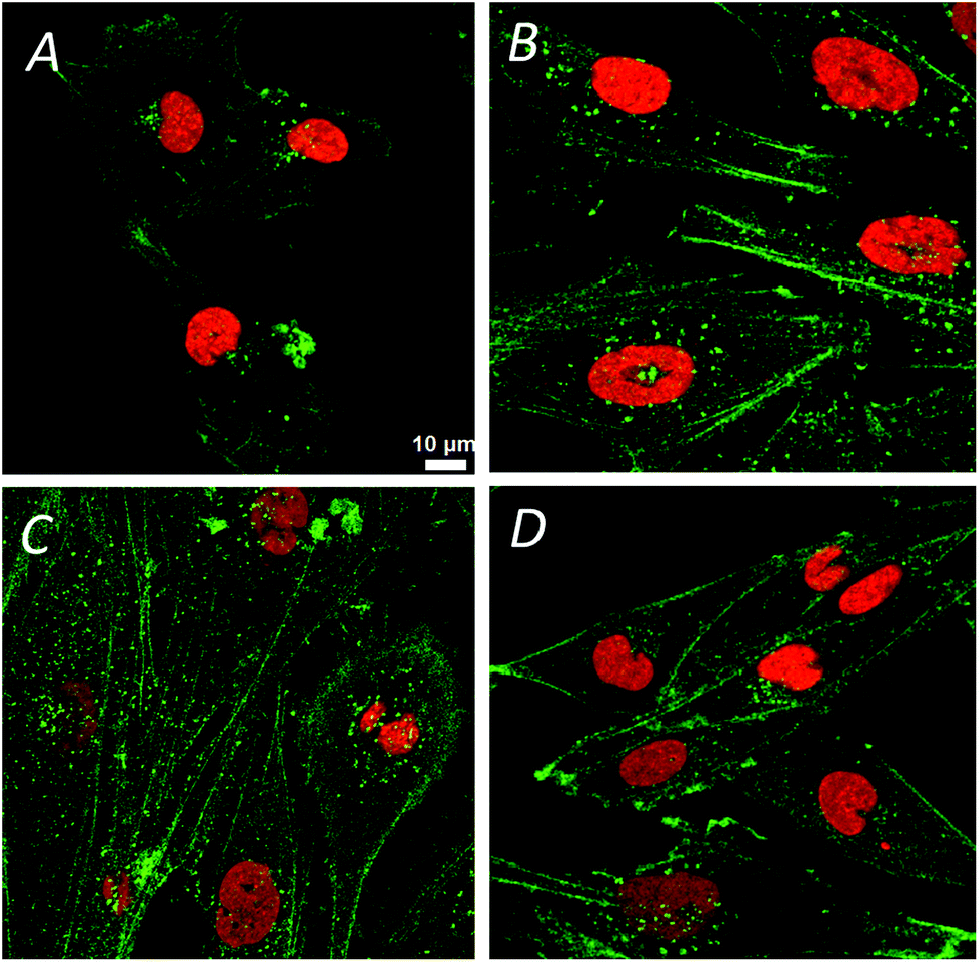 | ||
| Fig. 1 The visible light confocal microscopy of three different glioblastoma (GBM) cells a: 11ST, b: 36ST, c: 86ST and GBM cell line U87MG (d). Green structure refers to cytoskeleton and red to nucleus of cells. | ||
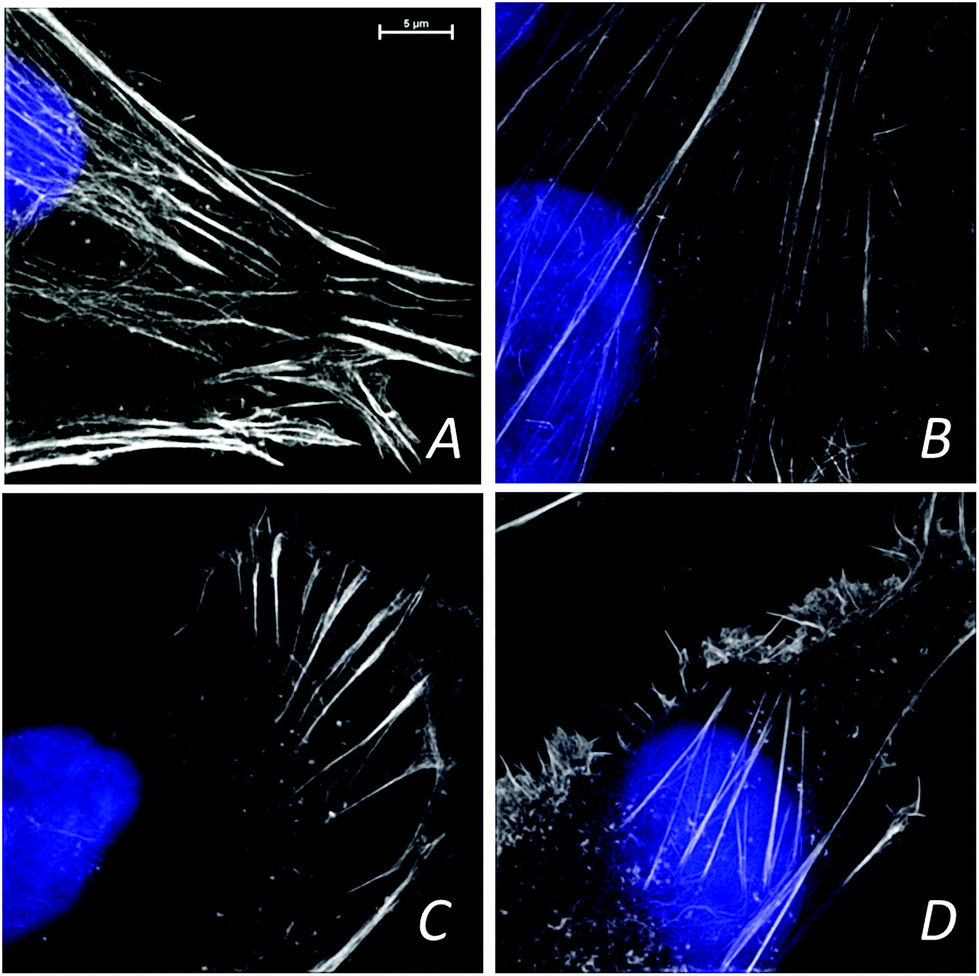 | ||
| Fig. 2 The structured illumination microscopy of glioblastoma cells (GBM) cells a: 11ST, b: 36ST, c: 86ST and GBM cell line U87MG (d). White structure refers to cytoskeleton and blue to nucleus of cells. Scale bar 5 μm. | ||
The F-actin seems to be differently organized in each cell line (Fig. 2). The greatest differences are observed between cell lines 11ST (Fig. 2A) and the U87MG cell line (Fig. 2D). On the other hand, patient derived cells 36ST and 86ST showed similar cytoskeleton organization and size intermediate compared to the two other cell lines (Fig. 2B and C). The cytoskeleton is an integrated network of tubes and filaments that control cell division and invasion.1 However, one needs to be mindful of the fact that these samples were chemically fixed and that it is possible that this has changed some of the sample features. To check structural changes in the non-fixed, close to native state cells, we used cryogenically preserved cells in the novel soft X-ray full field microscope.
Soft X-ray tomography
Soft X-ray microscopy and tomography based on absorption contrast was carried out using an X-ray microscope based on Fresnel zone-plate lenses, in order to elucidate the three-dimensional distribution of membranes and organelles in the intact GBM cells. Soft X-ray tomography was done at the Mistral beamline at the synchrotron Alba Cells, Barcelona, Spain. Imaging in “water window” energy range provides the carbon contrast images i.e. information about structural features of cells.5 This approach allowed a direct comparison of different GBM cells and screening for structure differences on the subcellular level (Fig. 3). In contrast to Fig. 1 and 2 where chemical fixation and staining had to be used to provide cell structure information, with soft X-rays interior structures of cells become visible in absorption contrast of native presented carbon compounds. Absorption contrast of cells illuminated with 520 eV X-rays shows an intricate structure in the cytoplasm around nucleus, which can be well visualized without any staining or physical slicing (sectioning) of samples. Reconstruction of the 141 images collected at 1 degree increments through ±70° of rotation in the tomographic data set yields the depth resolved structure. Representative 2D images from the stack of images used for tomographic reconstruction are shown in Fig. 3. Here we compared the two cells that are the most different with respect to the cytoskeleton organization, as observed in SIM: patient derived 11ST cell line and a long established glioblastoma cell line U87MG. Two types of cells presented different sub-cellular organization in soft X-ray absorption images. In the cell line 11ST very dense cytoplasm with many organelles was observed. Fig. 3B shows a part of nucleus and cytoplasm with abundant lipid droplets and many mitochondria close to the endoplasmic reticulum in the one of the representative 11ST cells. The organelle structure is much more pronounced than that in the cell line U87MG (Fig. 3A). The reconstruction outlines the great potential of soft X-ray tomography to unravel the native 3D glioblastoma cell architecture. The field of view of 10 μm2 is shown, typical for the TXM. However, in order to observe the entire patient derived glioblastoma cells, which are moderately large ∼50–100 μm, it would be necessary to “stitch” several tomograms to complete a single cell 3D image. This approach could introduce a vast radiation damage even with the cryo-preserved sample imaged under cryogenic conditions.14 To avoid this, we limited imaging to those areas from different cells that underscore the greatest structural variance.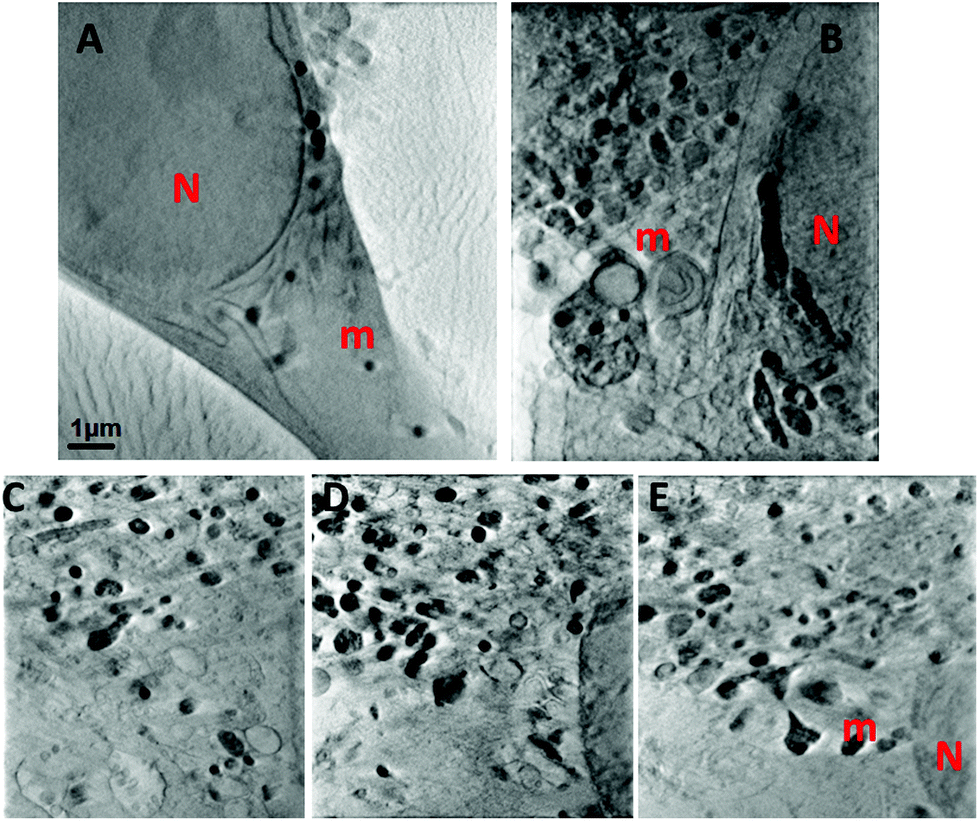 | ||
| Fig. 3 Soft X-ray microscopy: comparison of two different GBM cells: (a) U87MG and cell line 11ST (b). N-nucleus of cell, m-mitochondria. Virtual slices of a tomogram of one cell isolated from 11ST (c–e). | ||
X-ray fluorescence
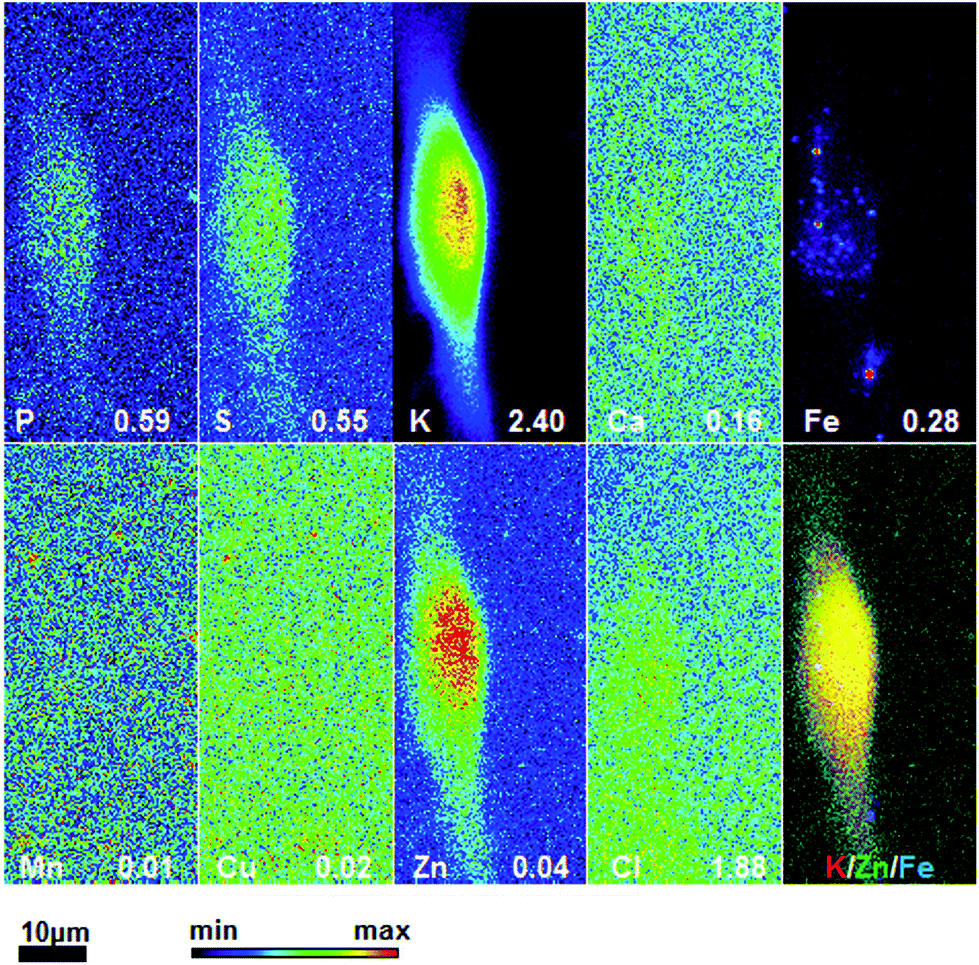
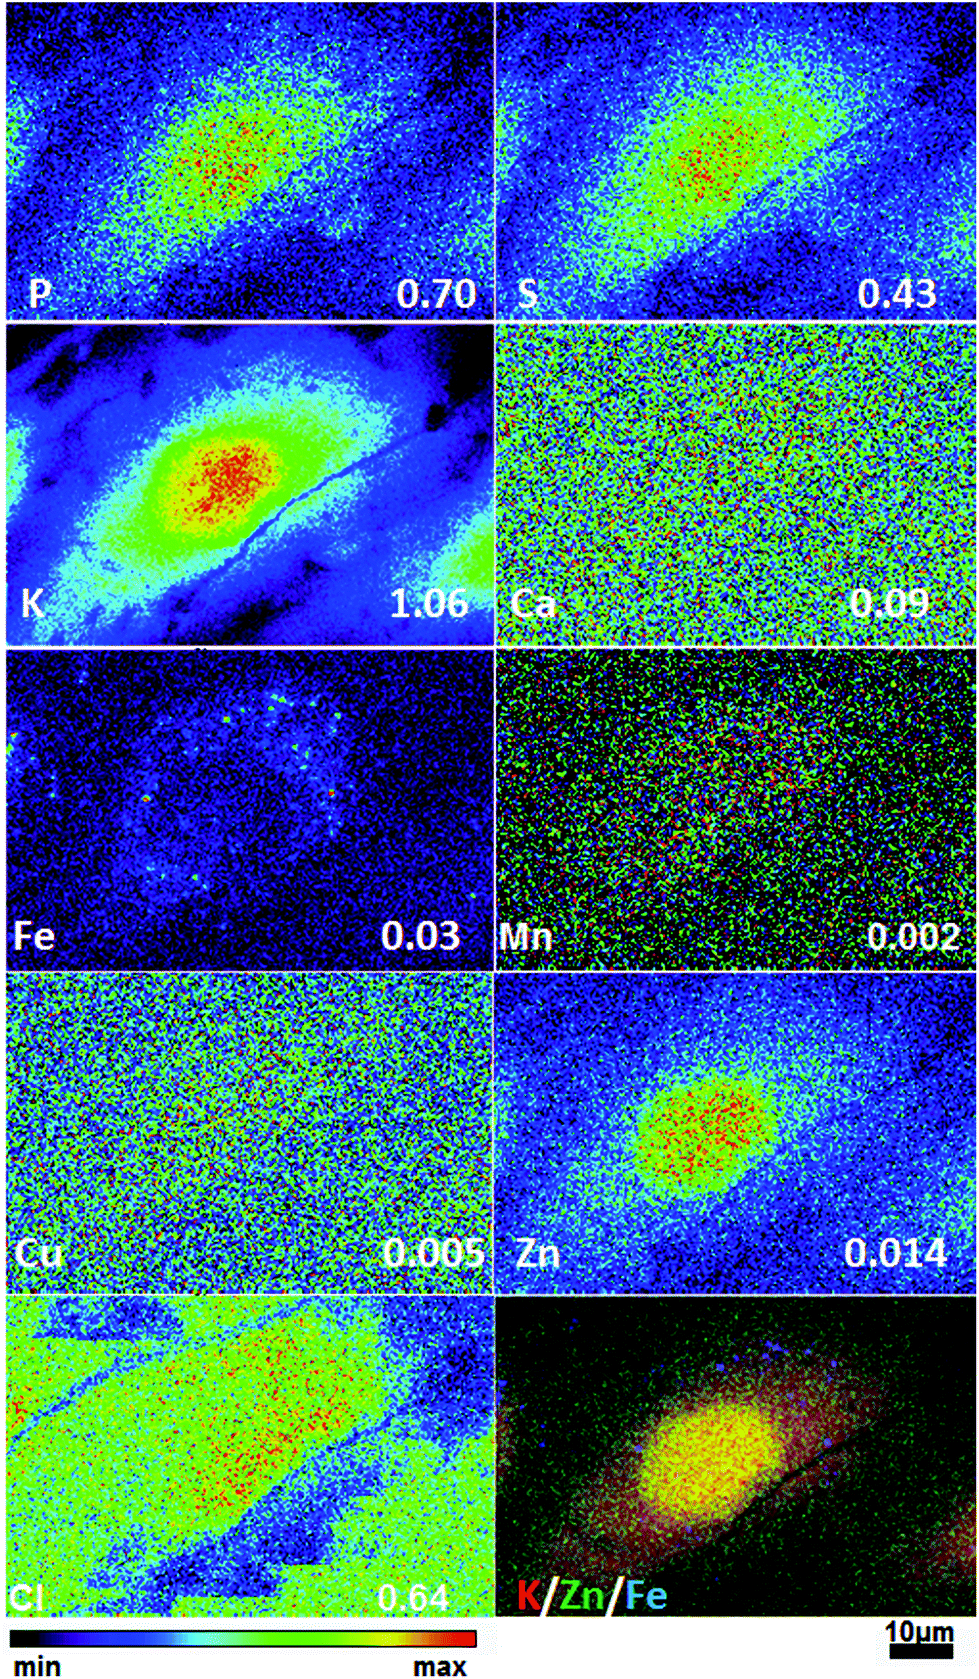
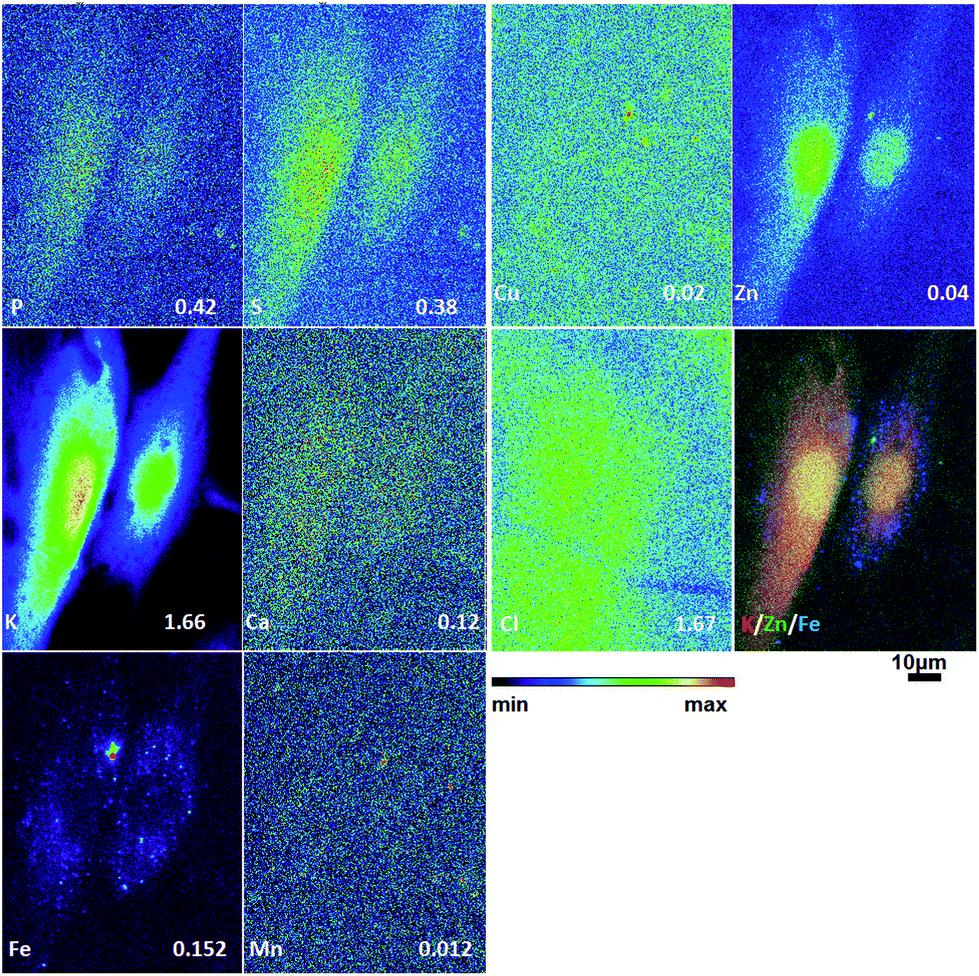
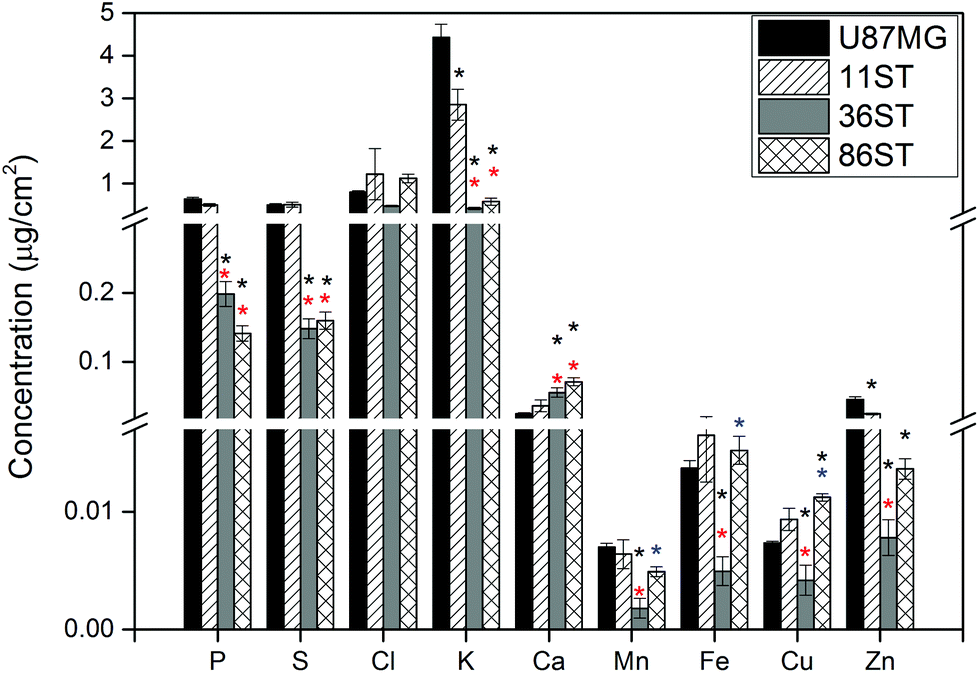
To obtain detailed elemental maps, frozen hydrated patient derived and cultured GBM cells were imaged with hard X-rays under cryogenic conditions. In order to obtain the elemental concentration maps at the micro- and nanometer scale, which could be coupled with the structural information, XRF was used. This in situ study was performed by using the hard X-ray imaging at the Bionanoprobe and the 2-ID-D at the APS synchrotron, Argonne, USA. Use of hard X-rays allowed us to elucidate elemental maps of subcellular structures (Fig. 4–7). The bio-imaging stations at the APS provide the ideal sample environment and handling capabilities for hard X-ray imaging of single cells.3,4,6 The X-ray fluorescence maps of P, Cl, S, K, Ca, Mn, Fe, Cu and Zn are shown in Fig. 4–7 for each cell line. Images were collected by scanning fields of view of about 100 μm × 100 μm with pixel size of 150–300 nm, and dwell time per pixel from 200–300 ms, which is indicate for each separate sample (Fig. 4–7). Different dwell time was taken in account during the normalization data in order to calculate it in μg cm−2. Using the XRF we were able to examine in situ trace metals like Zn, Cu, Fe, and Mn in the intact cells (Fig. 4–7), compare their content and distribution with the macro-elements as K, P, S, and Ca on subcellular level. The P and Zn distribution show a clear enhancement in the cellular nucleus. On the other hand, trace elements as Fe, Mn and Cu are highest in cytoplasm, perinuclear region – very close to nuclei (Mn possibly in mitochondria), in all GBM cells. The absolute area concentration is given in units of μg cm−2 in false colors as indicated in the color bar. The concentrations of the elements vary in different GBM cells and the significant differences mostly in the macro-elements (P, K, and S) are given in Fig. 8; however the most interesting observation is the difference in the distribution of Fe, which is together with Cu and Mn belonging to the redox active elements. Fe together with Mn is accumulated in different regions of U87MG cells (Fig. 4). In the cell lines 11ST, 36ST and 86ST Fe accumulates in clear patterns, mostly in perinuclear space, as shown in is shown in the overlaying images in Fig. 5–7 together with Zn and K. Concentration of all elements normalized against K (which is constant in cells that have been alive at the time of freezing) is shown in the Table 1. Elemental contents for the nucleus and cytoplasm are shown separately. It is important to note that observed concentration of Mn and Fe in all of the GBM cell lines was higher than that recorded for neural cells in literature.3 In general, trace metals including Fe, Mn, and Cu were more abundant in the cytoplasm than in the nucleus in all GBM cells. Zn, on the other hand, which is the marker for nuclei4 was more abundant in this organelle. Interestingly, 86ST cell line presented the highest content for all metals in comparison to other cell lines. Especially Cl, Fe, Ni, Cu and Zn were increased at least twice (Table 1).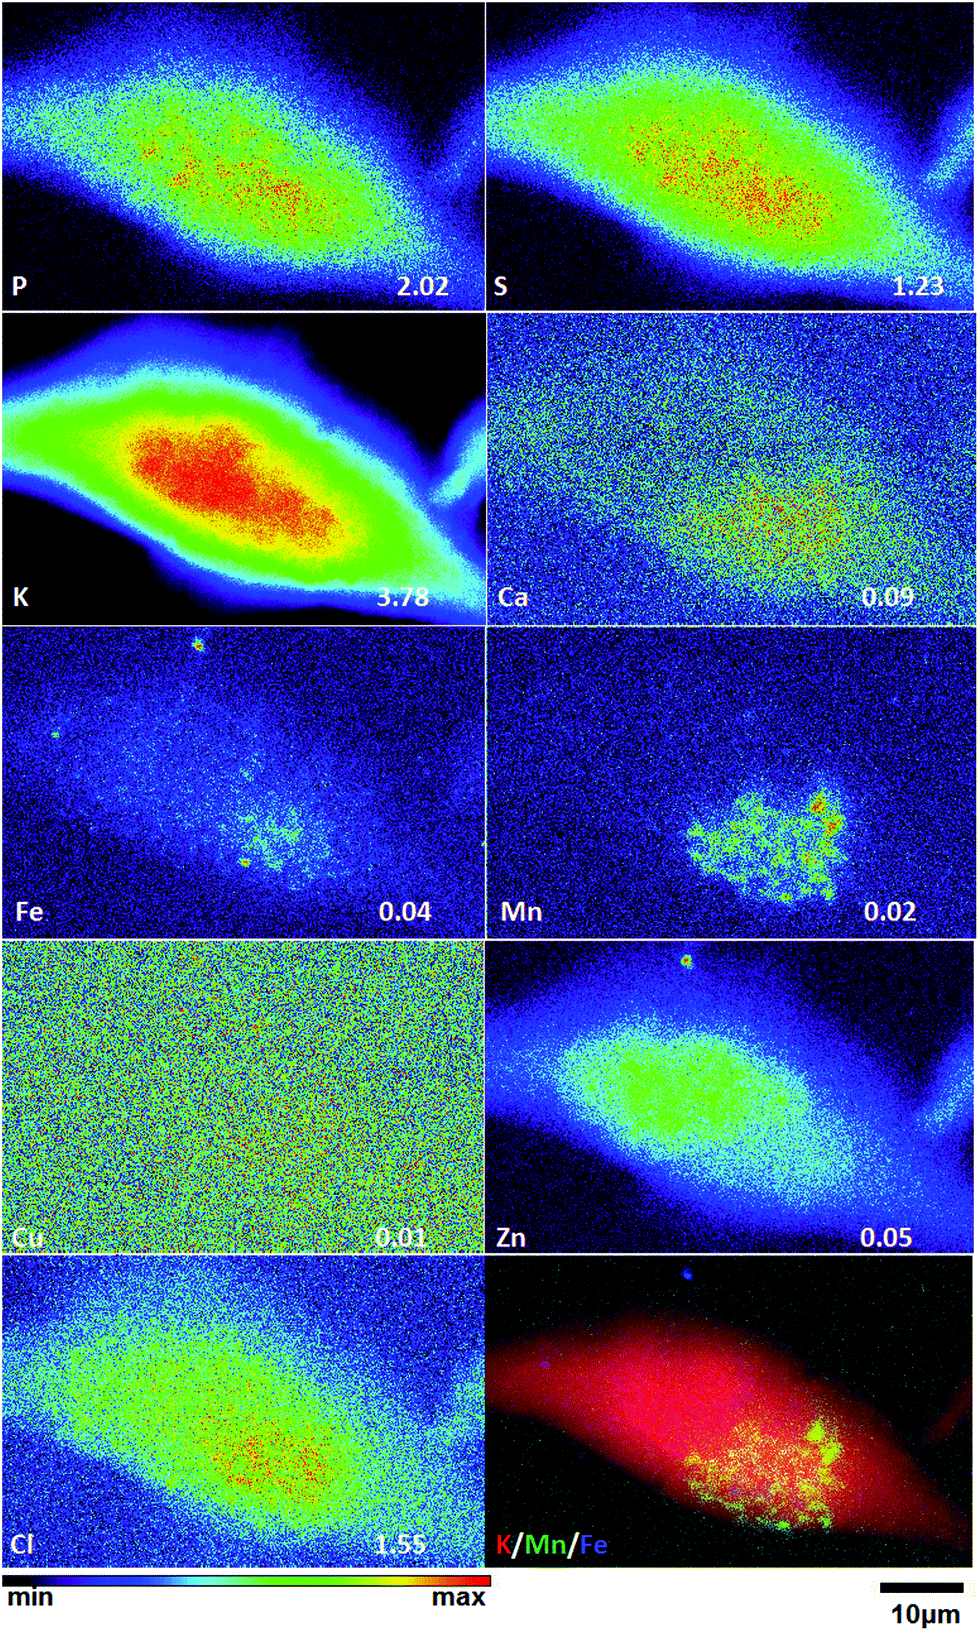 | ||
| Fig. 4 Hard X-ray fluorescence maps of P, S, K, Ca, Fe, Mn, Cu, Zn and Cl and merged map of K (red), mn (green) and Fe (blue) of cryo-preserved GBM cell line U87MG. Image 58 × 37 μm, pixel size 150 nm and dwell time 300 ms. The numbers on the bottom of each map show the maximal concentration in μg cm−2. | ||
 | ||
| Fig. 5 Hard X-ray fluorescence maps of P, S, K, Ca, Fe, Mn, Cu, Zn and Cl and merged map of K (red), Zn (green) and Fe (blue) (b) of cryo-preserved GBM cell line 11ST. Image 28 × 64 μm, pixel size 300 nm and dwell time 200 ms. The numbers on the bottom of each map show the maximal concentration in μg cm−2. | ||
 | ||
| Fig. 6 Hard X-ray fluorescence maps of P, S, K, Ca, Fe, Mn, Cu, Zn and Cl and merged map of K (red), Zn (green) and Fe (blue) of cryo-preserved GBM cell line 36ST. Image 73 × 48 μm, pixel size 300 nm and dwell time 300 ms. The numbers on the bottom of each map show the maximal concentration in μg cm−2. | ||
 | ||
| Fig. 7 Hard X-ray fluorescence maps of P, S, K, Ca, Fe, Mn, Cu, Zn and Cl and merged map of K (red), Zn (green) and Fe (blue) of cryo-preserved GBM cell line 86ST. Image 72 × 96 μm, pixel size 300 nm and dwell time 280 ms. The numbers on the bottom of each map show the maximal concentration in μg cm−2. | ||
 | ||
| Fig. 8 Elements concentration in different cells after X-ray fluorescence imaging of P, S, Cl, K, Ca, Mn, Fe, Cu and Zn of cryo-preserved GBM cell lines U87MG (black color bar), 11ST (right slashes bar), 36ST (gray color bar) and 86ST (grid bar). n = 15 cells for U87MG and n = 9 cells for each patient derived glioblastoma samples: 11ST, 36ST and 86ST, respectively. Values are given as means ± standard error. Asterisks indicate significant differences at p ≤ 0.05. Asterisks in black, red and blue color indicate significant difference after comparison to U87MG, 11ST and 36ST cell lines, respectively. | ||
| % | U87MG cells | 11ST | 36ST | 86ST | ||||
|---|---|---|---|---|---|---|---|---|
| Cytoplasm | Nucleus | Cytoplasm | Nucleus | Cytoplasm | Nucleus | Cytoplasm | Nucleus | |
| P | 35.0 | 37.7 | 13.4 | 28.7 | 52.6 | 55.2 | 19.9 | 14.7 |
| S | 27.0 | 26.5 | 16.2 | 21.2 | 39.1 | 34.0 | 25.9 | 18.6 |
| Cl | 49.5 | 35.6 | 18.1 | 17.0 | 85.1 | 53.8 | 193.2 | 102.4 |
| Ca | 1.6 | 1.0 | 0.7 | 1.5 | 10.5 | 6.5 | 12.9 | 6.6 |
| Mn | 0.1 | 0.1 | 0.2 | 0.2 | 0.1 | 0.1 | 0.7 | 0.4 |
| Fe | 0.4 | 0.3 | 0.4 | 0.5 | 0.7 | 0.3 | 2.2 | 0.9 |
| Cu | 0.3 | 0.2 | 0.3 | 0.2 | 0.4 | 0.3 | 1.8 | 0.9 |
| Zn | 0.7 | 0.8 | 0.8 | 1.1 | 1.0 | 1.1 | 2.1 | 2.1 |
Discussion
Glioma is a heterogeneous group of benign and malignant neoplasms that are histologically classified in 4 groups according to the WHO. However, even within the same group there is a great variability between tumors. In this study GBM cells isolated from three different patients were grown in culture and used to prepare samples for different types of imaging. While it is generally expected that genetic and epigenetic features of such cells vary from each other, this study shows that morphology and elemental concentrations and distribution in the patient derived GBM samples vary as well. The data were obtained using several novels X-ray and super-resolution visible light microscopies.For many years neuroscience was taking advantage of the high-resolution imaging enabled by transmission electron microscopy, as well as low-resolution deep penetrance X-ray imaging (such as CT scans) for investigation of gross pathology of central neural system. In between these two extreme cases, X-ray microscopy (XM) is a valuable tool to the field of neuroscience, with increasing application.15–20 Up to now the most studies using different X-ray microscopes were performed on tissues isolated from different brain tumors by using X-ray fluorescence imaging at low resolution, with pixel size of 15 μm.21 Even more importantly, before this work the only GBM samples investigated by XFM used cell culture cell lines such as U87MG cells.22 In this study we show that higher structural and chemical resolution imaging of patient derived GBM samples is possible; moreover, the findings of such imaging confirm variability of GBM as a disease even when cancers fall within the same group.
Cytoskeleton and structural organization
It is well known that cytoskeleton participates in the malignant behavior of glioblastomas.1 The potential cytoskeleton protein as therapeutic target is also considered. Cancer cells possess a broad spectrum of migration and invasion mechanisms, which include cell-migration strategies. In addition, cancer cells can modify their migration mechanisms in response to different conditions.1On the other hand, ample evidence indicates that ion channels are a critical component of the cellular migratory machinery. The connection between ion channel and cytoskeleton dynamics of GBM has, for example, been shown for the electroneutral Na+–K+–Cl− cotransporter-1 (NKCC). The NKCC1 regulates cytoskeleton dynamics through multiple targets that include filament actin regulation. NKCC1 modulates migration of GBM cells by at least two different mechanisms: cell volume regulation (through ion transport) and regulation of the actin cytoskeleton.23 Chloride channels in glioma cells have been associated with tumor invasiveness, presumably by facilitating cell shape and cell volume changes that are more conducive to migration and invasion. Blockade of glioma Cl− channels specifically inhibits tumor cell migration in a dose-dependent manner.24 There is a whole range of ion channels which could play a role in glioblastoma malignancy and modulate elemental makeup of these cells. Therefore, combined application of different imaging and XRF techniques in GBM research could support further examination and connection between cytoskeleton and elemental (dependent on ion channels) cell status. Learning more about the cellular and molecular basis of different migration/invasion processes will help us to understand how cancer cells disseminate and support development of new treatment strategies (reviewed in ref. 25). It is worth mentioning that in this work growth of GBM cells on Si3N4 windows was supported by the presence of proteinaceous coating, while prior in vitro studies have shown the importance of fibronectin, laminin and collagen in stimulating a migratory phenotype of GBM cells.26
A soft X-ray tomography has demonstrated that single GBM cells tomography under cryogenic conditions is possible by using the soft X-ray microscope. In contrast to electron tomography, which is still superior in resolution for thin samples, for work with soft X-rays cell sectioning and staining are not required. Fig. 3 shows a cryo-transmission X-ray imaging and tomography of patient derived and “established” GBM cells which illustrates the major difference in cytoskeleton organization based on the confocal and super-resolution visible light microscopy (Fig. 1 and 2). The interior structure in absorption contrast shows an intricate structure of nucleus, mitochondria and other organelles, which can be well visualized in absorption (density) contrast of carbon without staining or slicing. Reconstruction of the 140 images collected at 1° intervals through ±70° rotation in the tomographic data set yields the depth resolved structure. This reconstruction outlines the great potential of soft X-ray tomography to unravel the subcellular structure of native, whole, cryogenically preserved GBM cells.
The X-ray imaging of neural cells is a very powerful technique since penetration power and contrast make X-rays a unique probe to map out the three-dimensional structure of specimen by tomography. In general, significant progress in the last decade led to the realization of X-ray microscopy as a technique ripe for application to neuroscience.20
Elemental composition
The X-ray elemental imaging methods provide a new insight into molecular processes and interactions in the active neural cells and tissues. Apart from elemental and structural information (which X-rays provide with high resolution and penetration), X-ray imaging applications can also provide spectroscopic information on the sample; information that can be recorded by a combination of X-ray microscopy and X-ray spectroscopy.3Gianoncelli and co-authors used 2D soft X-ray microscopy coupled with XRF to investigate nanoparticles in U87MG cells.21 In our experiments we used the same cell line as an example of established GBM cells in cell culture and contrasted them with patient derived GBM samples. The studies of Szczerbowska-Boruchowska group suggest that chemical trace elements may contribute new information to neurobiology of gliomas.2,21 We found here that in all of the GBM cells originating from different patients the levels of intracellular Mn and Fe and other elements are altered compared to the established GBM cell line U87MG. Because these elements are involved in redox reactions (e.g. Mn mostly through its inclusion in Mn SOD in mitochondria; while Fe in different ferri-proteins, and both participate in Fenton reaction), it is possible that reactive oxygen species in these samples contribute to processes leading to genomic instability.
Aggressiveness of malignant tumors has been attributed to various factors, with one of the strong determinants being tumor cell oxidative stress.27 High levels of reactive oxygen species (ROS) has produced result in damage to DNA, protein and also cell membrane as an inevitable intracellular reaction leading to further oncogenic signals and/or to mitochondrial malfunction in cancer cells. ROS is also known to contribute to many aberrant signaling pathways responsible for apoptosis,28 cell proliferation,29 invasion30 and metastasis.31 Manganese super oxide dismutase (MnSOD) has been previously identified as one of the top regulated genes associated with poor survival in GBM patients.32 The same group has studied and evaluated the protein expression of MnSOD across various grades of astrocytoma, and studied its influence on survival of GBM patients and following recurrence.33 It has been shown an increased expression of MnSOD in anaplastic astrocytoma and GBM compared to low grade astrocytoma and control brain. An increase in MnSOD expression following GBM tumor recurrence strengthens its putative role in tumor aggressiveness.33 The last study suggests that MnSOD is a major contributor to aggressiveness in GBM and together with high Mn accumulation in GBM is also rendering MnSOD as an interesting molecule for further understanding of its functional role in contributing to aggressiveness and therapy resistance in GBM. Further a higher accumulation of Mn and overexpression of MnSOD suggests a possible role in therapy resistance. Secondly, Liu and co-authors found that the novel tumor-targeting manganese complex induces ROS-mediated apoptotic and autophagic cancer cell death.34 Furthermore the antitumor compound Mn(II), Adpa-Mn was more selective against cancer cells than the popular chemotherapeutic reagent, cisplatin. Adpa-Mn achieved its selectivity against cancer cells through the transferrin (Tf)-transferrin receptor (TfR) system, which is highly expressed in tumor cells and induced both apoptosis and autophagy.34 Taken together with our data this suggests the possible consideration of Mn-compounds as a target in the anticancer treatment.
Concerning high Fe accumulation in GBM cells, recently recognized form of regulated cell death, ferroptosis is an iron- and ROS-dependent form of regulated cell death (reviewed in ref. 35). It is characterized morphologically by the presence of smaller-than-normal mitochondria with condensed mitochondrial membrane densities, reduction or vanishing of mitochondria crista, and outer mitochondrial membrane rupture. Activation of mitochondrial voltage-dependent anion channels and mitogen-activated protein kinases, upregulation of endoplasmic reticulum stress, and inhibition of cystine/glutamate antiporter is involved in the induction of ferroptosis. This process is characterized by the accumulation of lipid peroxidation products and lethal ROS derived from iron metabolism and can be pharmacologically inhibited by iron chelators. Misregulated ferroptosis has been implicated in multiple physiological and pathological processes, including cancer cell death, neurotoxicity, neurodegenerative diseases, acute renal failure, drug-induced hepatotoxicity, etc.35 Our study demonstrates very prominent Fe and Mn perinuclear accumulation, and one could speculate that these trace metals participate in high metabolic activity of GBM cells. However, the soft X-ray microscopy showed relatively low mitochondrial density as well as small size in comparison to other cancer cell lines (data not shown). Secondly, in the nuclei we found lack of chromatin condensation, which all point out that ferroptosis could play important role in these GBM cells.
Conclusion
This study addressed the ultrastructure and the three-dimensional structure of different GBM cells, with contrast mechanisms dependent on use of X-rays: elemental mapping and carbon absorption contrast. This information was complemented by optical microscopy techniques. Differences between established GBM cell line and patient derived cells were notable with each technique used.In conclusion, this study allowed us to demonstrate the difference in structural organization and the distribution of trace metals and other elements, together with the cytoskeleton changes in cells originated from different patient derived GBM cells, with high chemical and spatial resolution. The main goal of the current studies was to show our ability to work with patient derived samples and demonstrate resolution and information power and possibility which we could obtain by using different complementary X-ray microscopies. In the direction of future usage of correlative X-ray tomographic microscopies, this approach could be used for imaging of other specimens relevant for various biomedical questions. In the present study we optimized cryogenic simultaneous sample preparation for different X-ray microscopies. The differences in cytoskeleton, elemental and structural organization in GBM cells found in this study may shed a new light on the mechanisms of GBM cell behaviour and metastatic potential.
Acknowledgements
We thank the Advanced Photon Source (APS) facility at Argonne National Laboratory for beam time allocation and excellent working conditions. Use of the Advanced Photon Source, an Office of Science User Facility operated for the U.S. Department of Energy (DOE) Office of Science by Argonne National Laboratory, was supported by the U.S. DOE under Contract no. DE-AC02-06CH11357.We are thankful to Dina Arvanitis and Josh Rappoport, from the Nikon Imaging Center, Feinberg School of Medicine, Chicago for the help during using SIM microscope. Alison Dufour is acknowledged for helping with the confocal imaging. Momčilo Dučić was helping with the cryo-fixation process of cells at Northwestern University, Evanston. Tanja Dučić's work was carried out with financial support of the UICC Fellowship no. ICR/2014/339966.
References
- S. K. Ray, Glioblastoma. Molecular Mechanisms of Pathogenesis and Current Therapeutic Strategies, 2010 Search PubMed.
- A. D. Surowka, D. Adamek and M. Szczerbowska-Boruchowska, Analyst, 2015, 140, 2428–2438 RSC.
- T. Dučić, E. Carboni, B. Lai, S. Chen, B. Michalke, D. F. Lázaro, T. F. Outeiro, M. Bähr, E. Barski and P. Lingor, ACS Chem. Neurosci., 2015, 6, 1769–1779 CrossRef PubMed.
- Y. Yuan, S. Chen, T. Paunesku, S. C. Gleber, W. C. Liu, C. B. Doty, R. Mak, J. Deng, Q. Jin, B. Lai, K. Brister, C. Flachenecker, C. Jacobsen, S. Vogt and G. E. Woloschak, ACS Nano, 2013, 7, 10502–10517 CrossRef CAS PubMed.
- A. Sorrentino, J. Nicolás, R. Valcárcel, F. J. Chichón, M. Rosanes, J. Avila, A. Tkachuk, J. Irwin, S. Ferrer and E. Pereiro, J. Synchrotron Radiat., 2015, 22, 1112–1117 CrossRef CAS PubMed.
- S. Chen, J. Deng, Y. Yuan, C. Flachenecker, R. Mak, B. Hornberger, Q. Jin, D. Shu, B. Lai, J. Maser, C. Roehrig, T. Paunesku, S. C. Gleber, D. J. Vine, L. Finney, J. Vonosinski, M. Bolbat, I. Spink, Z. Chen, J. Steele, D. Trapp, J. Irwin, M. Feser, E. Snyder, K. Brister, C. Jacobsen, G. Woloschak and S. Vogt, J. Synchrotron Radiat., 2014, 21, 66–75 CAS.
- K. Zierold and R. A. Steinbrecht, Cryotechniques in Biological Electron Microscopy, Springer, Berlin, Heidelberg, 1987 Search PubMed.
- T. Dučić, E. Barski, M. Salome, J. C. Koch, M. Bähr and P. Lingor, J. Neurochem., 2013, 124, 250–261 CrossRef PubMed.
- S. Vogt, J. Phys. IV, 2003, 104, 635–638 CAS.
- S. Vogt, J. Maser and C. Jacobsen, J. Phys. IV, 2003, 104, 617–622 CAS.
- F. J. Chichón, M. J. Rodríguez, E. Pereiro, M. Chiappi, B. Perdiguero, P. Guttmann, S. Werner, S. Rehbein, G. Schneider, M. Esteban and J. L. Carrascosa, J. Struct. Biol., 2012, 177, 202–211 CrossRef PubMed.
- J. R. Kremer, D. N. Mastronarde and J. R. McIntosh, J. Struct. Biol., 1996, 116, 71–76 CrossRef CAS PubMed.
- J. I. Agulleiro and J. J. Fernandez, Bioinformatics, 2011, 27, 582–583 CrossRef CAS PubMed.
- E. Pereiro, J. Nicolás, S. Ferrer and M. R. Howells, J. Synchrotron Radiat., 2009, 16, 505–512 CrossRef CAS PubMed.
- A. C. Leskovjan, A. Kretlow, A. Lanzirotti, R. Barrea, S. Vogt and L. M. Miller, NeuroImage, 2011, 55, 32–38 CrossRef CAS PubMed.
- J. Chwiej, J. Trace Elem. Med. Biol., 2010, 24, 78–88 CAS.
- J. Chwiej, A. Patulska, A. Skoczen, K. Janeczko, M. Ciarach, R. Simon and Z. Setkowicz, JBIC, J. Biol. Inorg. Chem., 2015, 20, 1277–1286 CrossRef CAS PubMed.
- M. W. Bourassa and L. M. Miller, Metallomics, 2012, 4, 721 RSC.
- S. Vogt and M. Ralle, Anal. Bioanal. Chem., 2013, 405, 1809–1820 CrossRef CAS PubMed.
- T. Salditt and T. Dučić, in Super-Resolution Microscopy Techniques in the Neurosciences Series, ed. E. Fornasiero and R. Silvio, 2014, pp. 257–290 Search PubMed.
- M. Szczerbowska-Boruchowska, M. Lankosz and D. Adamek, J. Biol. Inorg. Chem., 2011, 16, 1217–1226 CrossRef CAS PubMed.
- A. Gianoncelli, P. Marmorato, J. Ponti, L. Pascolo, B. Kaulich, C. Uboldi, F. Rossi, D. Makovec, M. Kiskinova and G. Ceccone, X-Ray Spectrom., 2013, 42, 316–320 CrossRef CAS.
- P. Schiapparelli, R. Magana-Maldonado, S. Hamilla, L. Sibener, J. C. Martinez-Gutierrez, H. Aranda-Espinoza and A. Quinones-Hinojosa, Neuro. Oncol., 2014, 16, v43–v44 CrossRef.
- L. Soroceanu, T. J. J. Manning and H. Sontheimer, J. Neurosci., 1999, 19, 5942–5954 CAS.
- P. Friedl and K. Wolf, Nat. Rev. Cancer, 2003, 3, 362–374 CrossRef CAS PubMed.
- E. Serres, F. Debarbieux, F. Stanchi, L. Maggiorella, D. Grall, L. Turchi, F. Burel-Vandenbos, D. Figarella-Branger, T. Virolle, G. Rougon and E. Van Obberghen-Schilling, Oncogene, 2014, 33, 3451–3462 CrossRef CAS PubMed.
- Y. Han and J. Z. Chen, BioMed Res. Int., 2013, 2013, 825065 Search PubMed.
- H. U. Simon, A. Haj-Yehia and F. Levi-Schaffer, Apoptosis, 2000, 5, 415–418 CrossRef CAS PubMed.
- M. Ogrunc, R. Di Micco, M. Liontos, L. Bombardelli, M. Mione, M. Fumagalli, V. G. Gorgoulis and F. d'Adda di Fagagna, Cell Death Differ., 2014, 21, 998–1012 CrossRef CAS PubMed.
- L. Enns and W. Ladiges, J. Bioenerg. Biomembr., 2012, 44, 635–638 CrossRef CAS PubMed.
- F. Sotgia, U. E. Martinez-Outschoorn and M. P. Lisanti, BMC Med., 2011, 9, 62 CrossRef CAS PubMed.
- A. Arimappamagan, K. Somasundaram, K. Thennarasu, S. Peddagangannagari, H. Srinivasan, B. C. Shailaja, C. Samuel, I. R. P. Patric, S. Shukla, B. Thota, K. V. Prasanna, P. Pandey, A. Balasubramaniam, V. Santosh, B. A. Chandramouli, A. S. Hegde, P. Kondaiah and M. R. Sathyanarayana Rao, PLoS One, 2013, 8, e62042 CAS.
- S. D. Shwetha, A. H. Shastry, A. Arivazhagan and V. Santosh, Pathol., Res. Pract., 2016, 212, 17–23 CrossRef CAS PubMed.
- J. Liu, W. Guo, J. Li, X. Li, J. Geng, Q. Chen and J. Gao, Int. J. Mol. Med., 2015, 35, 607–616 CAS.
- Y. Xie, W. Hou, X. Song, Y. Yu, J. Huang, X. Sun, R. Kang and D. Tang, Cell Death Differ., 2016, 23, 369–379 CrossRef CAS PubMed.
Footnote |
| † Electronic supplementary information (ESI) available. See DOI: 10.1039/c6an02532c |
| This journal is © The Royal Society of Chemistry 2017 |