
 Open Access Article
 This Open Access Article is licensed under a Creative Commons Attribution-Non Commercial 3.0 Unported Licence
Accurate quantification of apoptosis progression and toxicity using a dielectrophoretic approach†
Erin A.
Henslee
a,
Ruth M.
Torcal Serrano
a,
Fatima H.
Labeed
a,
Rita I.
Jabr
b,
Christopher H.
Fry‡
b,
Michael P.
Hughes
*a and
Kai F.
Hoettges§
a
aCentre for Biomedical Engineering, Department of Mechanical Engineering Sciences, University of Surrey, Guildford, Surrey GU2 7XH, UK. E-mail: m.hughes@surrey.ac.uk
bFaculty of Health and Medical Sciences, University of Surrey, Guildford, Surrey GU2 7XH, UK
First published on 19th October 2016
Abstract
A loss of ability of cells to undergo apoptosis (programmed cell death, whereby the cell ceases to function and destroys itself) is commonly associated with cancer, and many anti-cancer interventions aim to restart the process. Consequently, the accurate quantification of apoptosis is essential in understanding the function and performance of new anti-cancer drugs. Dielectrophoresis has previously been demonstrated to detect apoptosis more rapidly than other methods, and is low-cost, label-free and rapid, but has previously been unable to accurately quantify cells through the apoptotic process because cells in late apoptosis disintegrate, making cell tracking impossible. In this paper we use a novel method based on light absorbance and multi-population tracking to quantify the progress of apoptosis, benchmarking against conventional assays including MTT, trypan blue and Annexin-V. Analyses are performed on suspension and adherent cells, and using two apoptosis-inducing agents. IC50 measurements compared favourably to MTT and were superior to trypan blue, whilst also detecting apoptotic progression faster than Annexin-V.
Introduction
The study of apoptosis, or programmed cell death, is of great significance because it plays an important role in the normal development of multi-cellular organisms. Problems with the regulation of apoptosis can lead to diseases such as cancer (too little apoptosis) or neurodegenerative conditions such as Parkinson's or Alzheimer's diseases (too much apoptosis). New compounds that regulate apoptotic pathways can have applications as therapeutic agents, and hence quantifying the effectiveness of the new compounds is essential in drug discovery. Apoptotic cell death has a distinct cytological morphology and the signalling cascade is regulated at several points, therefore, there are many methods and opportunities to evaluate apoptotic death. There are several assays for apoptosis detection and understanding the mode of operations, their pros and cons, as well as the limitations of each assay is important. The process of apoptotic cell death can be completed in a few hours, and therefore if the assay is performed too early or too late, the results may not be accurate. Of the methods used to study apoptosis, spectroscopic techniques are standard, though new options are emerging.1 Most spectroscopic techniques for apoptosis rely on fluorescence detection of immunochemical labels or fluorescent probes which react to the cell environment during apoptosis. There are several options available including Annexin V staining, the TUNEL assay, and measurement of mitochondrial membrane potential.1 These assays measure different parameters which correlate with apoptotic progression. Trypan blue inclusion in cells measures surface membrane integrity by assessing the number of cells that will allow trypan blue to enter the cell interior. The MTT assay is a colourimetric assay to assess cell metabolic activity, as viable cells with an active metabolism convert MTT into a purple coloured formazan product. The TUNEL assay detects DNA fragmentation by labelling the terminal end of nucleic acids and such DNA fragmentation is a characteristic hallmark of apoptosis. The Annexin-V assay measures the loss of phospholipid asymmetry in the cell membrane which occurs early in the apoptotic process; phosphatidylserine, which is usually in the inner membrane leaflet, is transported to the outer leaflet as an “eat me” signal to macrophages;2 fluorescence labelling of Annexin V, combined with a nuclear stain, allows distinguishing between healthy, early apoptotic and late apoptotic cells using flow cytometry.3 The early apoptotic phase can be quite brief, and so experiments at different drug incubation times must be performed to prove that cells exhibit early apoptosis before reaching late apoptosis/necrosis. Whilst Annexin is fairly robust when used in suspensions growing cells, the use of flow cytometry can produce anomalous results due to damage caused by shear forces.4In addition to indicating the presence or absence of apoptosis in the cell population, new compounds need to be quantified in their effectiveness or cytotoxicity. In most cases this is measured using the half maximal inhibitory concentration (IC50), which indicates the necessary drug concentration to inhibit a biological process on a cell population by half. There are various types of tests that are typically used to determine the IC50 of a drug including simple light microscopy such as viability measures with trypan blue, fluorescent microscopy, 3-(4,5-dimethylthiazol-2-yl)-2,5-diphenyltetrazoliumbromide (MTT) assay,5 and characterising cell populations through flow cytometry.6 All of these methods involve staining of the cells often with expensive and cytotoxic dyes, lengthy preparation procedures, and rely on cellular events that occur as a result of drug exposure downstream of the initial drug effect. There is also the added complexity of comparing methods, as each measures viability mechanistically.
Dielectrophoresis (DEP) has been used as an alternative method of analysing the onset of apoptosis in the past, having been used to detect changes in cell phenotype within 30 minutes of drug incubation.7 DEP was first demonstrated to be capable of detection physiological changes in apoptosis in 2002,8 when Wang et al. demonstrated that the technique could more sensitively detect apoptotic induction than common methods such as the Annexin-V assay, using crossover methods to study changes in the cell membrane. Subsequent work compared DEP and Annexin-V for both membrane and cytoplasm, and found that DEP could detect apoptosis considerably earlier than the conventional test for PS expression in K562 cells, and that early events in apoptosis such as the calcium activated translocation of the negatively charged phospholipid phosphatidylserine (PS) and the reduction of intracellular potassium all precede membrane degradation and thus detection by methods such as trypan blue or MTT.8–14 More recent work has used the detection of apoptosis as a test for new DEP-based cytometry and cell sorting devices;15–20 in all cases, devices were presented that were able to sort apoptotic from non-apoptotic cells, indicating again that apoptosis can be measured according to changes in cell electrophysiology.
Whilst DEP has been conclusively shown to be able to discriminate between apoptotic and non-apoptotic cells, analyses have thus far been based on the analysis of intact cells in the early stages of apoptosis. In fact, a key stage in the apoptotic progress is the disintegration of the cell into apoptotic bodies, which cannot be detected by most DEP methods, preventing DEP from accurately quantifying apoptosis progression across a population. This is significant, because whilst DEP can be used to identify whether a given cell is apoptotic or not, it is significantly more difficult to quantify apoptosis across a population in order to assess, for example, the concentration of a drug required to induce apoptosis (the IC50); such a measurement would require the detection and quantification of apoptotic bodies (typically 1 μm across) as well as intact cells.
In this paper, we use a DEP analysis technique which analyses light absorbance changes due to DEP, hence allowing the quantification of apoptotic bodies. The DEP method was benchmarked with a suspension cell line (Jurkat) and the widely-used anti-cancer drug doxorubicin (DOX). Then, two studies were carried out on HeLa (adherent) and Jurkat (suspension) cells to benchmark DEP's speed and accuracy against MTT, trypan blue and flow cytometry with Annexin V/PI for apoptosis. The work demonstrates that with appropriate preparation, DEP analysis is as accurate as existing techniques whilst also being faster, simpler and cheaper to perform.
Experimental methods
Cell culture
Jurkat cells were cultivated in modified RPMI-1640 medium (Biosera, UK) supplemented with 10% heat-inactivated foetal bovine serum (Invitrogen, UK), 2 mM L-glutamine and 1% penicillin–streptomycin (Sigma-Aldrich, UK) and sub-cultured every 48 h.HeLa cells were cultivated in MEM with Earle's salts and non-essential amino acids (Biosera, UK) supplemented with 10% heat-inactivated foetal bovine serum (Invitrogen, UK), 2 mM L-glutamine and 1% penicillin–streptomycin (Sigma-Aldrich, UK). The medium was changed every 48 h and the cells were passaged using Accutase® (Sigma-Aldrich, UK) at around 70% confluence. HeLa cells were seeded at 6000 cells per cm2 in T175 flasks.
Drug treatments and preparation
To prepare cells for the DEP assay, samples were centrifuged at room temperature at 259g for 6 minutes and washed in iso-osmotic DEP medium consisting of 8.5% (w/v) sucrose, 0.5% (w/v) dextrose, 100 μM CaCl2 and 250 μM MgCl2![[thin space (1/6-em)]](https://www.rsc.org/images/entities/char_2009.gif) 21 adjusted to a conductivity of 0.01 Sm−1 using phosphate-buffered saline (PBS), and resuspended at a final cell concentration of 106 cells per ml (±15%). To calibrate how well DEP detects different sub-populations in a homogenous sample, a sample of healthy cells (not treated with DOX) and a sample of DOX-treated cells were prepared for DEP experiments. Then ratios of the healthy and the treated cell samples were prepared in ratios of 1:3, 2:2 and 3:1. A viability test was carried out on 20 μL of each of the mixtures as well as on the original samples using trypan blue 0.4% solution.
21 adjusted to a conductivity of 0.01 Sm−1 using phosphate-buffered saline (PBS), and resuspended at a final cell concentration of 106 cells per ml (±15%). To calibrate how well DEP detects different sub-populations in a homogenous sample, a sample of healthy cells (not treated with DOX) and a sample of DOX-treated cells were prepared for DEP experiments. Then ratios of the healthy and the treated cell samples were prepared in ratios of 1:3, 2:2 and 3:1. A viability test was carried out on 20 μL of each of the mixtures as well as on the original samples using trypan blue 0.4% solution.
DEP assay
The DEP assays were conducted on a DEPtech 3DEP well-based DEP cytometer23–25 (Uckfield, UK). The instrument (Shown in Fig. 1) uses twenty parallel 3D electrode arrays to infer the DEP behaviour of a cell population by analysing the radial motion of cells within the well over a period of 10 seconds. It can measure the DEP response reliably up to 45 MHz, providing more accurate information about the dielectric properties of the cytoplasm. | ||
| Fig. 1 Two DEPtech 3DEP cell analysers; the device on the left of the image is closed (as when in use), the device on the right is open to show the chip (red) and optical path. | ||
Approximately 80 μL of prepared cell suspension was pipetted into a 3DEP disposable chip, inserted into the reader and energized at 10 kHz–20 MHz to produce a full DEP spectrum. This was repeated for each treatment group at least 5 times. Data were analysed over 10 s (Jurkat) or 40 s (HeLa) intervals.
A single shelled model26,27 was fitted to the average of the sample data using the averages of measured cell radii.
The effective permittivity and conductivity of the particle considering a single shell model is given by:
 | (1) |
 | (2) |
Broche et al. developed a mathematical method to model multiple sub-populations within a sample.28 This is achieved by adding together the individual single-shell models of each subpopulation at each frequency point. MATLAB (The MathWorks, Inc., Natick, MA) was used to establish Pearson correlation coefficients (R) and RMS errors of the final multi-population fits. All data presented here have R-values >0.99. Cell radii were obtained by image analysis of cells on a haemocytometer using Image-J (National Institute of Health, Maryland, US). One hundred cells were measured for each sample. The distribution of cell size was analysed using SPSS (SPSS Inc. Chicago, IL).
Flow cytometry measurements
Annexin V FITC Apoptosis detection kit (Sigma-Aldrich, UK) was used to detect apoptosis using flow cytometry. HeLa cell concentration was adjusted to 106 cells per ml. Staurosporine treatment was applied to the wells at: 0.5 h, 2 h, and 4 h. A control of non-induced HeLa cells for a zero time point was also established. After the drug treatment was terminated, the cells were brought into suspension and washed twice with PBS. Control cells were also seeded in order to use them for compensation adjustments, made to minimise overlap between the two fluorochromes. The cells were resuspended in 1× binding buffer at a concentration of approximately 1 × 10⁶ cells per ml. Annexin V-FITC (5 μL) and Propidium Iodide (PI: 10 μL) solution were added to 500 μL of cell suspension. The cells were incubated for 10 min at room temperature and protected from light. After incubation the cells were analysed using a Beckman Coulter BD FACSCanto II flow cytometer emitting an excitation light at 488 nm from a laser. The detection was made at 518 nm for FITC detection and 620 nm for PI detection.MTT experiments
3-(4,5-Dimethylthiazol-2-yl)-2,5 diphenyltetrazoliumbromide (MTT) assay experiments were conducted following a protocol described by Mosmann.5 MTT was used to titrate cell viability following drug treatment. HeLa cells were treated as described for flow cytometry, whilst for Jurkat cells, doxorubicin was added to complete RPMI1640 to achieve final concentrations of 0.1, 0.3, 0.5 and 1 μM. The cells were seeded at a density of 3.6 × 10⁴ cells per ml, 24 h after the previous passage to ensure exponential growth, and kept in T25 flasks in 5 ml of medium with the corresponding concentrations of doxorubicin. Following incubation for 8, 16, 32 and 48 h, the cells were centrifuged, the supernatant removed, and resuspended in 60 μl of MTT: 10 μL was plated per well in 6 wells (6 repeats) and incubated for 4 hours. Following incubation, tetrazolium crystals were dissolved in 100 μl of DMSO. The absorbance intensity was measured by a microplate reader (VERSAmax) at 570 nm with a reference wavelength of 690 nm. Plates were read within 30 minutes of adding the DMSO. All experiments were performed in quadruplicate and the relative cell viability (%) was expressed as a percentage relative to the untreated control cells.Trypan blue experiments
20 μl of cell suspension was mixed with 20 μl of trypan blue 0.4% solution (Sigma-Aldrich, UK) in order to assess cell viability. The test was performed on a haemocytometer. The number of viable and non-viable cells in the haemocytometer were counted, and the viability percentage was calculated.IC50 determination
In pharmacological research, the half maximal inhibitory concentration, IC50, is a common toxicity measure which indicates the concentration of a drug that is needed to inhibit a given biological process in half of the cells in a population. For chemotherapeutic agents that are cytotoxic, the IC50 represents the concentration of the chemotherapeutic agent that is needed to inhibit population cell growth by half. The cytotoxicity of a compound is the extent to which that compound can damage the cell and this damage is dose dependent. Cytotoxic compounds can cause cell death in different ways including necrosis and apoptosis. The cytotoxicity can be determined by incubating cells with a range of concentrations of a drug for a period of time and quantifying the growth inhibition on the cells by comparing the viability of treated and healthy control. A dose response graph is typically used in which the effect of cell growth is plotted as a function of drug concentration. The Hill equation29 has been widely used to describe the dose response relationship, in the ‘sigmoid Emax model’, given by: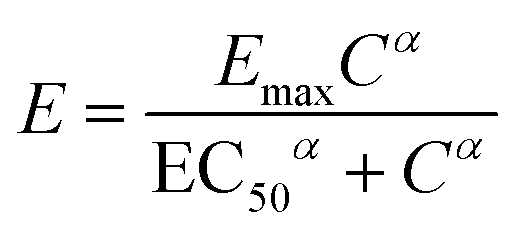 | (3) |
Results and discussion
Validation of DEP multiple subpopulation model against known mixtures of healthy and treated cells
It has previously been shown that when DEP analysis is performed on heterogeneous cell populations, the resulting DEP spectrum is the mathematical point-wise addition of the spectra of separate sub-populations.24,28 Consequently, if the data are of sufficient quality, it is possible to model multiple populations by identifying separate dispersions and other characteristic features in the recorded spectrum. The accuracy of this is increased further where the populations can be characterised in advance.We hypothesised that the data taken by the system presented here are sufficiently accurate for pair-wise modelling up to four populations, where the original populations have already been characterised. To test this, mean analyses (n = 15) of Jurkat cells were analysed before and after 16 h of treatment with 10 μM doxorubicin (referred to as healthy control and DOX-treated). Each analysis identified two populations: in the first case, the sample was found to contain 90% healthy cells and 10% which exhibited a significantly lower cytoplasmic capacitance, suggesting cell damage perhaps due to cell handling (ESI Fig. 1A†). Two populations were also found in the DOX-treated sample, one indicating apoptotic cells and the other presenting much smaller particles (∼1 μm), suggested to be apoptotic bodies, in a 54:46% ratio (ESI Fig. 1B†). The two samples (HC and DOX) were then mixed in 25:75, 50:50 and 75:25 ratios and analysed with DEP using the average of five repeats. Analysis was performed by using best-fit software to estimate the ratios of the two established populations in which the spectra derived for the HC and DOX cells should be mixed in order to maximise the correlation coefficient. Ratios were estimated in 1% steps (and further 0.1% steps when necessary), with the highest R value selected. The results can be seen in Table 1; the system determined the ratios to an accuracy of 5% or better, with R-values ≥0.98 (and reaching up to 0.998). It was noted that the variability in the DEP replicates was increased for the treated sample indicating the heterogeneity of sample may not be as consistent as the two populations found in the healthy sample. This highlights the effectiveness of the system for the analysis of heterogeneous populations, such as for cytotoxicity analysis.
| Best fit % with constant parameters | ||||||||
|---|---|---|---|---|---|---|---|---|
| Healthy Control Total | Healthy Control (sub-pop 1) | Healthy Control (sub-pop 2) | DOX cells (sub-pop 3) | DOX fragments (sub-pop 4) | DOX total | R value | ||
| Known mixture % | 100% HC | 100% | 90% | 10% | — | — | — | 0.998 |
| 75% HC | 75.0% | 67.5% | 7.5% | 13.5% | 11.5% | 25.0% | 0.9908 | |
| 50% HC | 55.0% | 49.5% | 5.5% | 24.3% | 20.7% | 45.0% | 0.9933 | |
| 25% HC | 30.0% | 27.0% | 3.0% | 37.8% | 32.2% | 70.0% | 0.9742 | |
| 100% DOX | — | — | — | 54% | 46% | 100% | 0.9943 | |
| Cytoplasmic conductivity (S m−1) | 0.46 | 0.07 | 0.12 | 0.02 | ||||
| Cytoplasmic relative permittivity | 60 | 60 | 80 | 70 | ||||
| Membrane conductance (S m−2) | 25.0 | 12.5 | 12.5 | 1.3 | ||||
| Membrane capacitance (mF m−2) | 9.96 | 7.75 | 6.64 | 7.75 | ||||
| Radius (μm) | 6.5 | 6.0 | 5.5 | 1.0 | ||||
IC50 determination of doxorubicin on Jurkat cells by MTT, DEP and trypan blue
A common measurement of the efficacy of cellular assays is the determination of a response curve to a drug in order to determine its inhibitory concentration that affects 50% of cells, or IC50. Jurkat cells are electrophysiologically transformed by the use of anti-cancer drugs such as doxorubicin, thus DEP may present a rapid, simple-to-use and low-cost alternative to IC50 assay techniques such as MTT or trypan blue. To determine the toxicity of doxorubicin on Jurkat cells, the percentage of viable cells after incubation with each concentration is needed. We incubated Jurkat cells for 8–32 h with doxorubicin at concentrations between 0.1 to 1 μM. After 8 h incubation with doxorubicin, in addition to the two populations similarly identified in ESI Fig. 1† for the healthy control, a third population had lower membrane capacitance and conductance and lower cytoplasmic conductivity and permittivity. The second population is interpreted as being affected by the drug but not dead, as the trypan blue test did not show that cells were necrotic.After 16 h incubation with doxorubicin a fourth population, with properties indicating a small radius, was found; closer observation of the cells under the microscope confirmed the presence of cell fragments approximately 1–2 μm in diameter. At each time point, the established DEP properties of these four populations were used to determine viability at each concentration (examples of this are shown in ESI Fig. 4† for 1 μM). This was performed through iterating sub population percentage, optimising R of the single shell fit to the spectra data. DEP viability % was interpreted as the total percentage of sub population 1 and 2. Again it was observed that the error associated with DEP replicates of the 32 h was higher than shorter incubation times suggesting the heterogeneity of the sample had increased. The effect of doxorubicin on Jurkat cells was also calculated by comparing the results at each concentration against the healthy control using both trypan blue and MTT, the results of which are shown in Table 3. For the lower concentration and shortened incubation times the MTT result was negative, indicating that those cells proliferated more than the healthy control. The numbers of trypan blue stained cells and unstained cells were also measured for each experiment, though this proved difficult at times when most of the cells were necrotic. There was a presence of ghost-like cells which were difficult to see under the microscope and appeared brighter than the rest or had a pale-blue appearance. For the experiments with the longer incubation times and higher concentrations, the cell concentration appeared to be lower and the presence of very small debris was noticeable but difficult to quantify under the microscope.
The percentage of viable cells obtained using DEP, MTT and trypan blue, for each concentration at a given time point, was used to calculate the IC50 values with the Hill Model by fitting to a rectangular hyperbola with iterative least squares regression and error given is error of fit to data points using Kaleidagraph (Synergy Software, Reading, PA USA). Table 2 shows the IC50 values obtained with the different methods over time. Each DEP experiment results in a dielectrophoretic spectrum from which populations with different properties can be obtained. The healthy population is determined as a control and then after incubation with the drug, the healthy population (which consists of two sub populations) can be subtracted in order to obtain the properties of the remaining populations. In this study, the properties of the affected cells and cell fragments are assumed to be the same in all incubation time points and concentrations in order to obtain an estimate of their properties. The DEP results highlighted the presence of three populations after 8 h, as can be seen from the bend in the polarisability at higher frequencies, indicating a population with a lower membrane capacitance and cytoplasm conductivity. After 16 h a fourth population, made up of cell fragments, could be seen in the spectra. By 32 h, there was a noticeable decrease in the healthy populations of each concentration. The IC50 could be determined at this point and proved close to the result obtained with MTT at both 16 h and 24 h; it was also consistent with the value obtained by trypan blue at 32 h, though unlike DEP and MTT this method was unable to produce a result at 16 h.
| 0.1 μM | 0.3 μM | 0.5 μM | 1 μM | IC50 | ||
|---|---|---|---|---|---|---|
| a DNC designates when Hill Model did not converge with given data. | ||||||
| MTT: growth inhibition (%) | ||||||
| DOX incubation time | 8 h | −2.9 ± 0.013 | −0.94 ± 0.014 | 2.7 ± 0.020 | 2.9± 0.026 | 0.37 ± 0.07 |
| 16 h | 3.0 ± 0.006 | −1.0 ± 0.036 | 34.2 ± 0.019 | 56.1 ± 0.006 | 1.21 ± 0.20 | |
| 32 h | 2.9 ± 0.019 | 50.5 ± 0.012 | 69.5 ± 0.003 | 79.5 ± 0.004 | 0.33 ± 0.04 | |
| Trypan blue: % viability | ||||||
| 8 h | 94 ± 3 | 96 ± 2 | 98 ± 1 | 99 ± 1 | DNC | |
| 16 h | 94 ± 3 | 97 ± 2 | 94 ± 1 | 82 ± 2 | 5.07 ± 0.75 | |
| 32 h | 94 ± 3 | 60 ± 5 | 29 ± 1 | 27 ± 2 | 0.36 ± 0.035 | |
| DEP: % viability (±1%) | ||||||
| 8 h | 90 | 94.5 | 83 | 85 | 0.14 ± 0.11 | |
| 16 h | 90 | 85 | 65 | 20 | 0.70 ± 0.11 | |
| 32 h | 90 | 40 | 35 | 0 | 0.25 ± 0.04 | |
Cytotoxicity analysis of staurosporine on HeLa cells by MTT, DEP, Annexin-V and trypan blue
Staurosporine is a widely-used agent for the induction of apoptosis. To benchmark DEP against common methods of viability or apoptosis itself, HeLa cells were incubated with staurosporine and then DEP, flow cytometry, MTT and trypan blue measured at regular time-points.The mean (n = 14) DEP spectra of HeLa cells, together with the modelled electrical parameters, are shown in ESI Fig. 2.† Analysis of the control HeLa population indicated that 15% of the population was small-radius debris, rising to 30% after 0.5 h incubation with staurosporine. After 0.5 h incubation with staurosporine the healthy population (population 1) had decreased by 18% and after 2 h by 41% compared to the healthy control. The mean cell radius had increased from 7.7 μm to 8.1 μm, coinciding with a decrease in cytoplasmic conductivity from 0.38 mS m−1 to 0.26 mS m−1 whilst the cytoplasmic permittivity remained the same. The membrane capacitance decreased from 38.7 mF m−2 to 35.4 mF m−2 whilst the membrane conductance remained constant. After 2 hours, cell debris accounted for 50% of the population, but the cell-sized population retained the cell properties as after 0.5 h, though the radius decreased to 7.26 μm (lower than the healthy control, but within the standard deviations). After 0.5 h incubation with staurosporine the healthy population (population 1) had decreased to 82% and after 2 h to 58%.
Flow cytometric analysis was performed for Propidium Iodide (PI) and Annexin V-FITC; the latter adheres to phosphatidylserine exposed on the cell membrane during early apoptosis, whilst PI indicates loss of membrane integrity in late apoptosis. In all experiments 10000 events were measured, of which some fell outside the gating set by the control sample (ESI Fig. 3†). The healthy control showed a small percentage of early apoptotic cells, this could be because apoptosis can also be induced by cell stress. It also contained a small percentage of late apoptotic cells. After 0.5 h the healthy population decreased by 4% and the early apoptotic population increased by the same amount. The healthy population decreased as incubation time was longer. The late apoptotic population increased steadily as incubation time was longer.
The healthy control gated population was 77.4% of the events registered. The 0.5 h, 2 h, 4 h, 6 h, and 12 h gated populations were 75.3%, 59.8%, 42.5%, 37%, and 24.6% of the events registered, respectively. These results indicate that the presence of cell debris increases steadily from 0.5 h of incubation with 1 μM staurosporine. The viability determined by flow cytometry is shown in Table 3.
| Viability (%) measured by method | |||||
|---|---|---|---|---|---|
| Trypan blue | Flow cytometry | MTT viability | DEP | ||
| STS incubation time | Healthy control | 92 ± 1 | 91 ± 3 | 100 ± 0 | 85 ± 5 |
| 0.5 h | 86 ± 3 | 87 ± 2 | 98 ± 1 | 70 ± 5 | |
| 2 h | 75 ± 5 | 73 ± 6 | 92 ± 1 | 50 ± 5 | |
| 4 h | 38 ± 1 | 27 ± 4 | 50 ± 1 | 0 ± 5 | |
The viability of HeLa cells after each incubation time point was calculated by comparing their concentration against the healthy control concentration. Table 2 shows the results obtained with MTT. MTT was chosen in order to observe the viability of the cell population without harvesting methods affecting the result. For the shorter incubation times the result is negative, indicating that those cells proliferated more than the healthy control. After 4 h (n = 5) MTT shows that half of the population is still viable. For the healthy control the cell viability was 98%. The viabilities for the incubation time points were 98% at 0.5 h, 92% after 2 h, and 87% after 4 h.
The trypan blue experiments were carried out immediately before the DEP experiments in order to determine cell viability of the samples. The results, when compared with the flow cytometry populations that are not stained with PI correlate well, as seen in Table 3, indicating that DEP accords with flow cytometry in terms of cells with intact membranes. Previous results comparing DEP to other viability methods also showed DEP to underestimate viability when compared to trypan blue and flow cytometry, again suggesting DEP measures earlier apoptotic events than these methods resulting in a lower DEP viability measure. Confirmation of this could be found in this same study, where Nexin (which detects an early apoptotic feature of phosphatidylserine on the outer cell membrane) and DEP demonstrated near identical viability counts.16 This is corroborated with another DEP study that showed a strong inverse relationship between PS externalisation and cytoplasmic conductivity.11
MTT overestimates the viability of the cells because during the early stages of apoptosis the cell is still able to metabolise the tetrazolium salt.5 MTT on adherent cells was carried out whilst they were still attached to the microplate and, since no detachment was needed, the cells were not harmed by the harvesting process. The MTT experiments showed that the cells were viable from 0.5 h to 2 h. At 4 h, MTT estimated that half of the population was viable. When incubated in suspension, DEP detected a decrease in the healthy population after 0.5 h incubation, and that population also had lower cytoplasmic conductivity. The population had decreased to 80% (from 85% to 70%) and cytoplasm conductivity from 0.38 to 0.26 S m−1. Flow cytometry, for the 0.5 h sample, showed that the healthy population had decreased to 95% (from 91 to 87%). When the different methods are compared (Table 3) it is clear that the DEP result is comparable to both MTT and flow cytometry in terms of viability assessment, whilst being faster and substantially lower cost to implement.
DEP has previously been used to quantify apoptotic progression, detecting cells in early or late apoptosis from normal cells.7–20 It can detect early events associated with the onset of apoptosis in a manner which can be correlated with other apoptotic events such as the activation of scramblases which translocate membrane phospholipids between inner and outer leaflets.11 However, whilst tools for the study of apoptosis often focus on the analysis of the apoptotic process, a greater part of the analysis is in the quantification of the number of cells undergoing the phenomenon in order to determine the efficacy of drugs at different concentrations. This has been something that DEP has been previously unable to achieve, because the majority of DEP analysis methods use cell tracking in some form to measure the force on a population of cells. Cells in late apoptosis tend to break into small (>2 μm) particles known as “apoptotic bodies” that are too small to track easily, making it difficult to quantify how many cells have entered this phase. The method described here uses a different approach, relying on the optical absorbance of cells within a well structure. Typically, 1000 cells will be contained within each well, with 20 wells being analysed. As cells disintegrate, they remain within the optical path and retain similar absorbance characteristics, allowing them to remain as part of the quantification process.
The multi-population model used here used four fixed models for healthy cells plus those in apoptosis, tracking the variation in population sizes by finding the best-fit proportions of the four populations. The fits to the four curves were typically determined to have values of R2 > 0.99 and, when mixed in fixed ratios, were accurate to within 5% of the actual population ratios. When using these models to track actual cell populations undergoing apoptosis there is good agreement between DEP and the other methods. For Jurkat cells, results with DEP typically produced a lower value by a factor of ∼2; given that IC50 values typically deal with orders of magnitude, this is functionally a very similar result. For HeLa cells where the assay operated on much shorter timescales, DEP produced a result much more rapidly than the other methods, principally because DEP measures cell stress rather than cell death, by identifying ion efflux early in the apoptotic process, though MTT did start to show similar results some 2 h later.
Taken together, these results suggest that DEP can be used as an effective tool for quantifying cell death. It produces IC50 results comparable to standard assays such as MTT, flow cytometry, and trypan blue. The technique does not require any cell staining, is faster than the other methods, producing functionally similar results with significantly lower complexity and operating cost and has demonstrated sensitivity to physiological changes in cells across early to late stage apoptosis.
Competing interests
KFH and MPH are directors of DEPtech Ltd, which produce the 3DEP instrument used here.Acknowledgements
Funding for this work was provided from the South East of England Development Agency and Finance South East. A studentship to RMTS was provided by Labtech International.References
- M. M. Martinez, R. D. Reif and D. Pappas, Anal. Methods, 2010, 2, 996–1004 RSC.
- V. A. Fadok, D. R. Voelker, P. A. Campbell, J. J. Cohen, D. L. Bratton and P. M. Henson, J. Immunol., 1992, 148, 2207–2216 CAS.
- G. Koopman, C. P. M. Reutelingsperger, G. A. M. Kuijten, R. M. J. Keehnen, S. T. Pals and M. H. J. Vanoers, Blood, 1994, 84, 1415–1420 CAS.
- M. van Engeland, F. C. Ramaekers, B. Schutte and C. P. Reutelingsperger, Cytometry, 1996, 24, 131–139 CrossRef CAS PubMed.
- T. Mosmann, J. Immunol. Methods, 1983, 65, 55–63 CrossRef CAS PubMed.
- G. Ormerod, Flow Cytometry: A Practical Approach, OUP Oxford, 2000 Search PubMed.
- S. Chin, M. P. Hughes, H. M. Coley and F. H. Labeed, Int. J. Nanomed., 2006, 1, 333–337 CAS.
- X. J. Wang, F. F. Becker and P. R. C. Gascoyne, Biochim. Biophys. Acta, 2002, 1564, 412–420 CrossRef CAS.
- F. H. Labeed, H. M. Coley and M. P. Hughes, Biochim. Biophys. Acta, Gen. Subj., 2006, 1760, 922–929 CrossRef CAS PubMed.
- L. Duncan, H. Shelmerdine, M. P. Hughes, H. M. Coley, Y. Hübner and F. H. Labeed, Phys. Med. Biol., 2008, 53, N1–N7 CrossRef CAS PubMed.
- H. J. Mulhall, A. Cardnell, K. F. Hoettges, F. H. Labeed and M. P. Hughes, Integr. Biol., 2015, 7, 1396–1401 RSC.
- R. Pethig and M. S. Talary, IET Nanobiotechnol., 2007, 1, 2–9 CrossRef CAS PubMed.
- S. J. Martin, C. P. Reutelingsperger, A. J. Mcgahon, J. A. Rader, R. C. van Schi, D. M. Laface and D. T. Green, J. Exp. Med., 1995, 341, 1545–1556 CrossRef.
- C. D. Bortner and J. A. A. Cidowlski, Philos. Trans. R. Soc., 2014, 369, 1638 Search PubMed.
- C.J Huang, A.L. Chen, L. Wang, M. Guo and J. Yu, Biomed. Microdevices, 2007, 9, 335–343 CrossRef PubMed.
- M. Nikolic-Jaric, T. Cabel, E. Salimi, A. Bhide, K. Braasch, M. Butler, G. E. Bridges and D. J. Thomson, Biomicrofluidics, 2013, 7, 024101 CrossRef PubMed.
- D. Lee, B. Hwang, Y. Choi and B. Kim, Sens. Actuators, A, 2016, 242, 1–8 CrossRef CAS.
- D. Lee and B. Kim, Int. J. Precis. Eng. Man., 2015, 16, 609–613 CrossRef.
- K. Braasch, M. Nikolic-Jaric, T. Cabel, E. Salimi, G. E. Bridges, D. J. Tmonson and M. Butler, Biotechnol. Bioeng., 2013, 110, 2902–2914 CrossRef CAS PubMed.
- R. T. Kalyana Kumar, S. Liu, J. D. Minna and S. Prasad, Biochim. Biophys. Acta, 2016, 1860, 1877–1883 CrossRef PubMed.
- C. H. Fry, S. C. Salvage, A. Manazza, E. Dupont, F. H. Labeed, M. P. Hughes and R. I. Jabr, Biophys. J., 2012, 103, 2287–2294 CrossRef CAS PubMed.
- S. Mahabadi, F. H. Labeed and M. P. Hughes, Electrophoresis, 2015, 36, 1493–1498 CrossRef CAS PubMed.
- Y. Hübner, K. F. Hoettges, G. E. N. Kass, S. L. Ogin and M. P. Hughes, IEEE Proc. Bionanotechnol., 2005, 4, 21–25 Search PubMed.
- K. F. Hoettges, Y. Hübner, L. M. Broche, S. L. Ogin, G. E. N. Kass and M. P. Hughes, Anal. Chem., 2008, 80, 2063–2068 CrossRef CAS PubMed.
- L. M. Broche, K. F. Hoettges, S. L. Ogin, G. E. N. Kass and M. P. Hughes, Electrophoresis, 2011, 32, 2393–2399 CAS.
- A. Irimajiri, T. Hanai and A. Inouye, J. Theor. Biol., 1979, 78, 251–269 CrossRef CAS PubMed.
- U. Lei, P. H. Sun and R. Pethig, Biomicrofluidics, 2011, 5, 044109 CrossRef CAS PubMed.
- L. M. Broche, F. H. Labeed and M. P. Hughes, Phys. Med. Biol., 2005, 50, 2267–2274 CrossRef PubMed.
- S. Goutelle, M. Maurin, F. Rougier, X. Barbaut, L. Bourguignon, M. Ducher and P. Maire, Fundam. Clin. Pharmacol., 2008, 22, 633–648 CrossRef CAS PubMed.
- A. V. Hill, J. Physiol., 1910, 40(suppl.), iv–vii Search PubMed.
Footnotes |
| † Electronic supplementary information (ESI) available. See DOI: 10.1039/c6an01596d |
| ‡ Present address: School of Physiology and Pharmacology, University of Bristol, University Walk, Bristol BS8 1TD, UK. |
| § Present address: Department of Electrical Engineering and Electronics, University of Liverpool, Brownlow Hill, Liverpool L69 3GJ, UK. |
| This journal is © The Royal Society of Chemistry 2016 |