 Open Access Article
Creative Commons Attribution 3.0 Unported Licence
Anodic stripping voltammetry with graphite felt electrodes for the trace analysis of silver†
Trevor J.
Davies
Department of Natural Sciences, University of Chester, Thornton Science Park, Pool Lane, Ince, Cheshire, CH2 4NU, UK. E-mail: t.davies@chester.ac.uk; Tel: +44 (0)1244512297
First published on 31st May 2016
Abstract
Graphite felt (GF) is a mass produced porous carbon electrode material commonly used in redox flow batteries. Previous studies have suggested GF may have valuable applications in electroanalysis as a low cost disposable carbon electrode material, although most GF sensors have used flow cell arrangements. In this work, an elegant wetting technique is employed that allows GF electrodes to be used in quiescent solution to detect trace levels of silver in water via anodic stripping voltammetry. GF electrodes display good repeatability and a limit of detection of 25 nM of Ag+ in 0.1 M HNO3, with a linear range spanning two orders of magnitude. This compares to a value of around 140 nM when using conventional carbon electrodes. Combined with their low cost and disposable nature, the results suggest GF electrodes can make a valuable contribution to electroanalysis.
Introduction
Limit of detection is a key property of any sensor. For electrochemical sensors, a common and successful route to decreasing the limit of detection is maximising current density, thus boosting the signal to noise ratio.1 In quiescent solutions this is achieved by using micro and nano-sized electrodes, where decreasing the electrode size increases the mass transport coefficient.2–4 However, as the electrode size decreases the fabrication technique becomes more complicated and the cost of the electrode often increases. In addition, the magnitude of the current decreases, which eventually requires the need for high specification potentiostats and low-noise environments.This article investigates the use of graphite felt (GF) as an electrode material for electroanalysis. GF is a porous electrode material commonly used in redox flow batteries, with a large surface area and relatively low manufacturing cost.5 For example, each 1 × 1 × 0.28 cm piece of GF used in this study had a surface area of approximately 55 cm2 and cost less than 1 British pence. Previous work suggested GF electrodes may have beneficial properties for electroanalysis, capable of producing good signals at low levels of analyte.6 This is surprising given that GF electrodes are “mega-macro” electrodes and the perceived trend in electroanalysis is towards smaller electrodes with increased current densities. This work builds from the recent study of solution phase redox systems to investigate the use of graphite felt electrodes for stripping voltammetry in quiescent solution.
Stripping voltammetry is a widely reported electroanalytical technique that can be used to detect a large range of metals and important organic/organometallic molecules at low concentrations (less than ppb in some cases) and relatively low cost.1 Although a number of stripping voltammetric techniques exist, the general procedure involves pre-concentration of the analyte at the electrode surface followed by the stripping step, where the analyte “deposit” dissolves back in solution as a result of a potential ramp. The latter step generates the electrochemical signal from which the species may be identified and quantified. In anodic stripping voltammetry (ASV), the analyte is often a metal cation that undergoes reduction forming a neutral metal deposit on the working electrode surface. The electrode potential is then increased until the metal deposit undergoes oxidation back to the (aqueous) cation, essentially being stripped from the surface. The sensitivity of the method can be increased by introducing forced convection of analyte to the electrode surface, for example via a rotating disc electrode,7 wall jet electrode,8 channel electrode9 or ultrasound.10 This enhances mass transfer and improves the pre-concentration step leading to lower limits of detection. Anodic stripping voltammetry has also been performed with GF electrodes in flow cells (to enhance the deposition step). Geneste and co-workers used GF flow cells to detect a number of metal ions, including lead copper and zinc, with impressive results suggesting the “mega-macro” electrode concept was worth pursuing for electroanalysis.11–15
However, flow cells add another layer of complication to experimental techniques and less intricate quiescent arrangements are often preferred for analytical methods. Although a number of researchers have used mega macro carbon electrodes for ASV in quiescent solutions with some success, for example macro porous carbon spheres and carbon fibre mats,16,17 the situation with GF electrodes is complicated due to their hydrophobicity, which can cause wetting issues and poor repeatability.6 A novel solution to the GF wetting problem was proposed by Bouabdalaoui et al. who used a pre-treatment involving glycerol and sodium alginate to produce hydrophilic GF electrodes that were then used to detect lead and mercury in aqueous solutions.18 Demkin also used GF electrodes to detect trace tin in quiescent aqueous solutions of jewellery alloys, although no details of the GF wetting procedure were given.19 Therefore, provided there is repeatable electrode wetting, the scientific literature suggests mega-macro carbon electrodes can make a valuable contribution to electroanalysis, bucking the trend of ever-decreasing electrode dimensions.
The detection of silver via anodic stripping voltammetry has attracted significant attention over the past decades, with many types of working electrodes employed. Due to its low toxicity and relatively low cost, carbon has always been an attractive material for electrodes in electroanalysis. Silver has been detected with a wide range of carbon electrodes including wax impregnated graphite,20,21 glassy carbon,22 screen printed carbon,23 edge plane pyrolytic graphite,24 carbon fibres,25 carbon paste26 and boron doped diamond.27Table 1 provides a literature summary of the detection of trace silver via stripping voltammetry at carbon electrodes. In most cases, nM detection limits were achieved using forced convection to enhance mass transport. In this work GF is used as an electrode material in the anodic stripping voltammetry of silver, detecting silver cations (Ag+) in water at low concentrations using linear sweep and differential pulse voltammetry under quiescent conditions. The ethanol wetting method developed by Smith et al. is employed,6 allowing fast and repeatable experiments without the need for a flow cell. Limits of detection are established in two different systems and compared with that obtained using conventional carbon electrodes. The results are promising and highlight the advantages of mega-macro electrodes. In addition, the quiescent method employed in this work demonstrates the ability of GF electrodes to accurately probe a defined “trapped” volume of electrolyte, providing new insights into the fundamental processes occurring at the electrode–liquid interface.
| Electrode material | Electrolyte medium | Technique | Pre-concentration conditions | Lowest concentration measured | Statistical LoD | Linear range | Ref. |
|---|---|---|---|---|---|---|---|
| Wax impregnated pyrolytic graphite | 0.3 M NH4NO3/0.3 M NH4OH | ASV | 900 s deposition under stirring | 4 nM | 20 | ||
| Wax impregnated spectroscopic graphite | 0.2 M KNO3 | ASV | 900 s deposition under stirring | 4 nM | 21 | ||
| Glassy carbon (hydrogen activated) | 0.15 M NH4NO3/0.75 M NH3 | ASV | 300 s deposition at a rotating disc electrode | 50 nM | 22 | ||
| Screen printed carbon electrode (thin layer) | 0.1 M NH4SCN | SWASV | 90 s quiescent deposition | 0.93 μM–7.5 μM | 23 | ||
| Edge plane pyrolytic graphite electrode | 0.1 M HNO3/14 mM KCl | DPASV | 120 s (300 s) quiescent deposition | 10 nM | 8.1 nM (0.2 nM) | 10 nM–81 nM (1 nM–7 nM) | 24 |
| Carbon fibre electrodes | Natural water samples (no additional electrolyte) | ASV | 180–480 s quiescent deposition | 9.3 nM | 2.8 nM | 46 nM–232 nM | 25 |
| Carbon paste electrode | Potassium hydrogen phthalate buffer (pH 4.5) | SWASV | 600 s deposition at a rotating disc electrode | 1.9 nM | 1.9 nM–19 nM | 26 | |
| Boron-doped diamond | 0.5 M HNO3/12.5 mM KCl | ASV | 300 s deposition under insonation | 1 nM | 0.4 nM | 1 nM–100 nM | 27 |
Experimental
All chemicals (analytical grade) were used as received from VWR without further purification. Solutions of AgNO3 in 0.1 M HNO3 (pH 1.1) and AgNO3 in 0.1 M HNO3 with 14 mM KCl (pH 1.1) were prepared using ultrapure water (18 MΩ cm−1, Milli-Q®). Voltammetric measurements were carried out using a μAutolab III (ECO-Chemie, Utrect, The Netherlands) potentiostat. All measurements were conducted using a three electrode cell. The counter electrode was a platinum gauze and the reference was a saturated mercury–mercrous sulphate (Hg/Hg2SO4) electrode (IJ Cambria Scientific Ltd, UK). Two 3 mm diameter carbon electrodes, edge plane pyrolytic graphite (EPPG) and pyrolytic formed carbon (PFC), were used as conventional working electrodes (IJ Cambria Scientific Ltd, UK). Both electrodes were prepared by polishing with diamond slurries of decreasing particle size (6 μm, 3 μm and 1 μm) on a cloth lapping pad followed by washing the surface in ultrapure water and briefly sonicating. The GF used was GFD 2.5, a commercially available felt supplied by SGL Group, with a nominal thickness of 2.8 mm (measured under a slight compressive force).28 A 1 cm2 piece of GF was cut from a clean roll of the felt using a bespoke ‘cookie cutter’ tool then weighed using a 4 point balance (this allowed an estimation of the electrochemical surface area of the GF piece, as discussed in the ESI†). A 0.5 mm (diameter) platinum wire was then passed through the felt to secure it and provide a good electrical connection to the whole of the felt piece, as described previously.6 The size of the voltammetric signal from the platinum wire was negligible compared to the signal from the GF electrode. In some cases, a 2 cm2 section of GF connected via 0.5 mm diameter platinum wire was used as the counter electrode instead of the platinum gauze.Fully wetting GF electrodes is the key to obtaining repeatable results in aqueous solutions. The GF wetting procedure used was similar to that previously reported.6 The GF electrode was initially washed in ethanol then rinsed with ultrapure water via a wash-bottle. The water-wet GF electrode was then sonicated for 1 minute in a sacrificial sample of the test electrolyte before being transferred to the electrochemical cell.
Anodic stripping voltammetry (ASV) was performed with the three working electrodes (EPPG, PFC and GF) in solutions containing trace amounts of Ag+. This involved an initial preconditioning of the electrode surface at 0.2 V (vs. Hg/Hg2SO4) for 10–30 s, followed by Ag deposition (always under quiescent conditions) at −0.5 to −0.9 V for 60–120 s. The Ag deposits were then removed via electrochemical oxidation (stripping) either by linear sweep voltammetry or differential pulse voltammetry. All experiments were conducted at 20 ± 1 °C in a Faraday cage. Given the relatively large currents obtained with GF electrodes for trace analysis (tens of μA) and the scan rates used in this work (0.05 V s−1), a Faraday cage should not be necessary. However, the experiments were conducted in a particularly noisy environment, necessitating the use of a Faraday cage.
Results and discussion
Silver in 0.1 M nitric acid
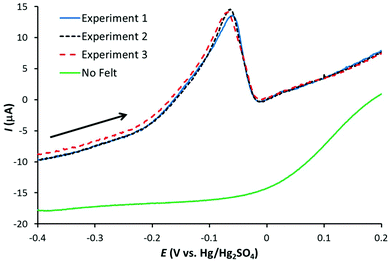
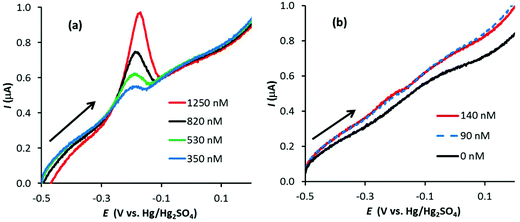
A 1 μM solution of AgNO3 in 0.1 M HNO3 was used to identify the optimum conditions for Ag detection with the three working electrodes. Fig. 1 illustrates linear sweep voltammograms (at 50 mV s−1) for three Ag stripping experiments with a GF electrode in 1 μM AgNO3/0.1 M HNO3. The electrodes were preconditioned at +0.2 V for 30 s followed by Ag deposition at −0.6 V for 120 s. Also shown is the corresponding signal obtained with the bare Pt wire. As observed, the GF electrode gives a well-defined stripping peak, with negligible contribution form the Pt wire. In addition, the repeatability is excellent with the stripping charge (proportional to the area under the stripping peak) equal to 27.4 ± 0.3 μC for the three signals.With optimum conditions determined (see the ESI† for more details), ASV experiments were first performed with the conventional carbon electrodes, PFC and EPPG, in 0.1 M HNO3 with increasing amounts of Ag+ (AgNO3). Fig. 2 illustrates linear sweep stripping voltammograms (50 mV s−1) obtained with the PFC electrode at different concentrations of Ag+. In this case, the preconditioning occurred at +0.2 V for 30 s and the Ag deposition followed at −0.8 V for 120 s, which are similar conditions to those used in analytical test laboratories.29 As observed, the signal decreases in magnitude with [Ag+], and is just visible at a concentration of 140 nM (suggesting the limit of detection is just below 140 nM). The results for the EPPG electrode were similar (not shown), but with a higher limit of detection.
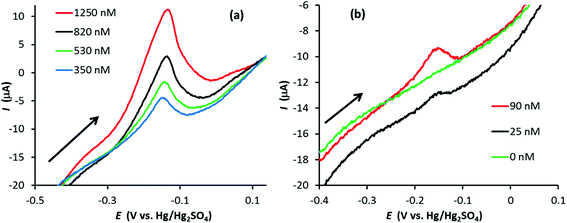
Fig. 3 illustrates linear sweep stripping voltammograms (50 mV s−1) from experiments performed with a GF electrode in 0.1 M HNO3 with increasing amounts of Ag+. In this case the GF was preconditioned at 0.2 V for 10 s and Ag deposition occurred at −0.6 V for 90 s (increasing the deposition time beyond 90 s made a relatively small improvement in the signal). There are a few noticeable differences between the signals of the GF and PFC electrodes (Fig. 2vs.Fig. 3). First, although the surface area of the GF electrode is almost 800 times greater than the PFC electrode (∼55 cm2vs. 0.07 cm2), the ratio of the peak currents (GF vs. PFC) is approximately 30. This is expected given the porous nature of GF electrodes, which results in low current densities compared to conventional disc electrodes.6 Second, the stripping signal at the GF electrode appears to be sharper than that for the PFC electrode at the same Ag+ concentration. Finally, the limit of detection (LoD) appears to be significantly lower for the GF electrode, with a signal still observed at 25 nM Ag+, which was the lowest concentration to produce a recognizable signal for the given experimental conditions. Further experiments at longer deposition times obtained signals at concentrations as low as 10 nM for the GF electrode in this system, approximately 14 times lower than the PFC electrode LoD (see Fig. S3 in the ESI†).
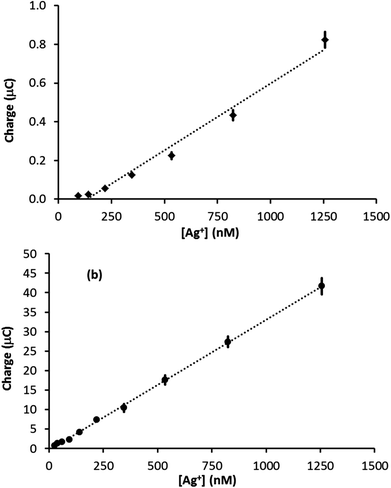
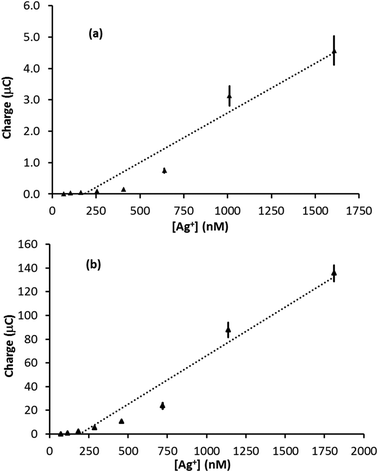
The amount of Ag deposited on the electrode surface is directly proportional to the charge passed during the stripping event (assuming all the Ag is removed from the electrode surface), which is equal to the integral of the stripping peak divided by the scan rate. Fig. 4 illustrates plots of stripping peak charge vs. Ag+ concentration for the linear sweep stripping voltammograms (50 mV s−1) obtained with a (a) PFC and (b) GF electrode. In both cases, the scan-to-scan repeatability was excellent and the largest error came from the analysis of the signal, up to ±10% for the smallest signals (error bars are plotted but are difficult to see as in most cases they are less than or equal to the width of the marker). In the case of the PFC electrode, the plot is not linear over the range of concentrations studied. This contrasts the GF electrode, for which a linear relationship is observed over a range of nearly two orders of magnitude. In addition, the GF linear range extends to a significantly lower concentration due to the superior limit of detection. Furthermore, Fig. S4 in the ESI† compares results from two different felt electrodes over the same concentration range and demonstrates the good repeatability attainable with these electrodes. Using the 3σ method,30 a limit of detection was evaluated (from Fig. 4b) as 35 nM, which is in excellent agreement with the 25 nM limit observed in the actual experiment. Comparing these results with the previous sensors in Table 1, a silver detection limit of 25 nM ranks 7th out of 9 studies, the best detection limit in Table 1 being 100 times lower than that achieved with GF. However, given that most of the studies in Table 1 used forced convection, a 25 nM detection limit in quiescent solution with a disposable electrode that costs less than one British pence is impressive. Also, the magnitude of the linear range of the GF sensor ranks joint first with those in Table 1, suggesting GF electrodes can make a valuable contribution to electroanalysis.
With some basic approximations, it is possible to estimate the silver stripping charge obtained with the GF electrodes. For a given a deposition time and redox species diffusion coefficient, a threshold pore diameter, dlimit, can be estimated below which full depletion of the redox species within the pore occurs. Using a deposition time, t, of 90 s and a diffusion coefficient, D, of 1.55 × 10⁻⁵ cm2 s−1 for Ag+,31dlimit is approximately 480 μm (calculation details are given in the ESI†). This is much greater than the average pore size in the GF electrode (approximately 30 μm)6 and suggests it is reasonable to assume full depletion of Ag+ within the felt is possible in the 90 s deposition step (i.e. all the Ag+ within the GF electrode is reduced to Ag and deposited on the GF surface).
The dimensions of the felt are known (2.8 mm × 10 mm × 10 mm) and the felt porosity, ϕ, can be determined from the mass measurement (see the ESI†). Therefore, complete reduction of Ag+ within the GF would lead to the deposition of nAg moles of Ag, where nAg is given by:
| nAg = [Ag+]bulkϕVGF | (1) |
In the above equation [Ag+]bulk is the initial concentration of Ag+, VGF is the volume of the piece of GF and the other symbols have already been defined. In this case, the stripping charge due to the internal surface, Qint, is simply nAg multiplied by Faraday's constant:
| Qint = FnAg | (2) |
This value of Qint represents a lower limit as it ignores the contribution from the external surface of the GF, which has a geometric area of 3.12 cm2. Treating the external surface as a planar electrode with surface area A (3.12 cm2) and assuming complete reduction of Ag+ at the electrode surface, the stripping charge due to the external surface, Qext, can be estimated by integrating the Cottrell equation:32
 | (3) |
In this case, t is 90 s, D is 1.55 × 10⁻⁵ cm2 s−1 and the other parameters are known. Assuming diffusion is the dominant form of mass transport in the deposition period, the sum of Qext and Qint represents an upper limit to the stripping signal. Fig. 5 illustrates a plot of stripping charge vs. Ag+ concentration for the GF electrode in Fig. 4b. Overlaid are the approximate upper and lower limits. As observed, the experimental value lies between the two limits, suggesting the GF electrode achieves a constant percentage deposition within the pores of the electrode (close to 100% deposition) over the concentration range. Interestingly, this result suggests there may be no limit to the linear range of the stripping charge vs. [Ag+] relationship, providing the signal is dominated by the interior surface of the felt.
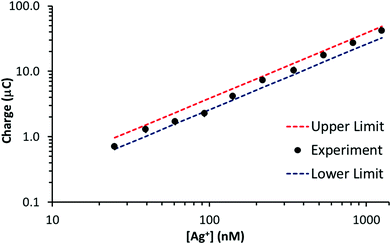 | ||
| Fig. 5 Stripping charge vs. Ag+ concentration for the GF electrode (∼55 cm2 surface area, ∼0.28 cm3 volume) in Fig. 4b. Overlaid are the approximate upper and lower stripping charge limits determined with eqn (2) and (3). | ||
Differential pulse voltammetry (DPV) was also used to generate stripping signals with the GF electrodes (after the same preconditioning and Ag deposition steps used for linear sweep experiments). Optimum DPV parameters were found using a 2.5 μM solution of AgNO3 in 0.1 M HNO3: 0.03 s modulation time; 0.1 s interval time; 50 mV amplitude; 4 mV step potential. However, at low Ag+ concentrations, the DPV signals were poor as shown in Fig. S5 in the ESI.† Similar features were observed for the EPPG and PFC electrodes, in agreement with previous work by Compton et al.24
Silver in 0.1 M nitric acid and 14 mM KCl
Silver stripping signals can be improved by the addition of small amounts of KCl.24,27 Accordingly, Ag trace analysis was conducted in 0.1 M nitric acid containing 14 mM KCl, as used by Compton and co-workers.24 Fig. S6 in the ESI† illustrates linear sweep voltammograms obtained with PFC and GF electrodes at different concentrations of Ag+. The anodic stripping of Ag at 0.05 V s−1 followed preconditioning at 0.2 V for 30 s (PFC) or 10 s (GF) and a deposition step of −0.9 V for 120 s (PFC) or −0.6 V for 90 s (GF). For the PFC electrode, an Ag signal was observed from 102 nM upwards (the EPPG results were similar). The corresponding concentration was 73 nM for the GF electrode, suggesting a slightly lower limit of detection than conventional carbon electrodes, but not as low as that achieved in the absence of KCl.On increasing Ag+ concentration, the signal noticeably improved for all the electrodes tested, producing much sharper stripping peaks than the corresponding systems without KCl. Fig. 6 illustrates plots of stripping charge vs. Ag+ concentration for the PFC and GF electrodes. In both cases the relationship is clearly non-linear over the concentration range studied, most noticeably for the PFC electrode. As before, it is possible to predict an upper and lower limit for the expected stripping charge obtained from the GF electrode (assuming 100% Ag deposition within the pores). The results are shown in Fig. 7 along with those obtained experimentally. In contrast to the system without KCl (Fig. 5), the experimental results do not all lie within the upper and lower limits. At low Ag+ concentrations, the recorded charge is significantly less than expected whereas at Ag+ concentrations above 1 μM the charge is larger than the maximum value expected via deposition supported by diffusion only. This agrees with previous work with conventional carbon electrodes in the HNO3/KCl system, where the stripping charge densities obtained were rather high given the Ag+ concentration values.24 Furthermore, Fig. 7 suggests the Ag/HNO3/KCl deposition system is not “well-behaved” (in contrast to Fig. 5) and highlights another advantage of GF electrodes in obtaining important fundamental insights into redox processes.
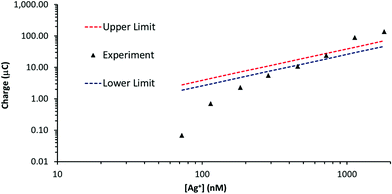 | ||
| Fig. 7 Stripping charge vs. Ag+ concentration for the GF electrode (∼53 cm2 surface area, ∼0.28 cm3 volume) in Fig. 6b. Overlaid are the approximate upper and lower stripping charge limits determined with eqn (2) and (3). | ||
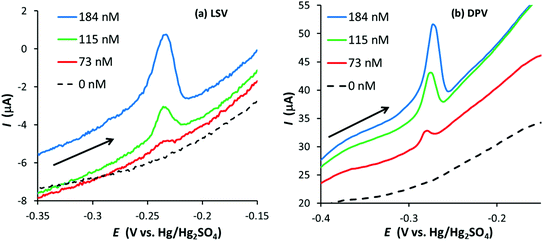
Fig. 8 illustrates linear sweep (50 mV s−1) and differential pulse voltammograms obtained with the same GF electrode for the anodic stripping of Ag after a preconditioning at 0.2 V for 10 s and a deposition step of −0.6 V for 90 s (the DPV conditions were the same as those for the GF electrode in 0.1 M HNO3). In this case, a good DPV signal is observed, which appears to be better defined than the LSV signal, suggesting DPV can further improve the LoD for graphite felts.
Although DPV improved the Ag signal, the LoD was hardly affected (a silver signal was not observed at 46 nM, the next concentration below 73 nM). In contrast, a signal was observed at an Ag+ concentration of 41 nM when using DPV with the EPPG electrode, a noticeable decrease from 100 nM obtained using LSV (in agreement with Compton and co-workers).24 The results suggest DPV is more effective at decreasing the limit of detection for conventional electrodes than for GF electrodes.
Conclusions
The results clearly demonstrate GF electrodes can be used for the trace analysis of silver in water via anodic stripping voltammetry. The GF electrodes have been found to give repeatable signals and appear to have a significantly lower limit of detection than conventional carbon electrodes (in 0.1 M HNO3) with a larger linear range. Indeed, initial results suggest the linear range for the GF/Ag/HNO3 system may not have an upper limit, providing the signal is dominated by the internal surface of the felt. DPV can also be used with GF electrodes to improve signals, although with little impact on the limit of detection. Given their low cost and disposable nature, this suggests GF (and mega-macro) electrodes can make a valuable contribution to electroanalysis.Furthermore, GF electrodes may be used to accurately determine the level of depletion in electrodeposition experiments, across a wide range of concentrations. This can determine if a deposition system is “well-behaved” or not, as demonstrated by the change observed with the addition of KCl to the HNO3 electrolyte. The GF electrodes contain a relatively large and reproducible trapped volume that can be completely probed with voltammetric techniques, providing valuable fundamental insights into well-known redox systems. Further investigations are underway to determine the mechanisms behind the strange behaviour observed in the Ag+/HNO3/KCl system.
Acknowledgements
The author thanks the RSC for providing a Research Fund Grant to pay for the equipment, software and consumables used in the above work. The author also thanks Robert Smith and Prof. Richard Nichols (both from the University of Liverpool) for their support and advice and Rory Thompson (University of Chester) for help with materials preparation.References
- J. Wang, Analytical Electrochemistry, Wiley-VCH, New York, 2nd edn, 2000 Search PubMed.
- M. C. Henstridge and R. G. Compton, Chem. Rec., 2012, 12, 63 CrossRef CAS PubMed.
- N. J. Freeman, R. Sultana, N. Reza, H. Woodvine, J. G. Terry, A. J. Walton, C. L. Brady, I. Schmueser and A. R. Mount, Phys. Chem. Chem. Phys., 2013, 15, 8112 RSC.
- K. Dawson, A. Wahl and A. O'Riordan, J. Phys. Chem. C, 2012, 116, 14665 CAS.
- M. H. Chakrabarti, N. P. Brandon, S. A. Hajimolana, F. Tariq, V. Yufit, M. A. Hashim, M. A. Hussain, C. T. J. Low and P. V. Aravind, J. Power Sources, 2014, 253, 150 CrossRef CAS.
- R. E. G. Smith, T. J. Davies, N. B. Baynes and R. J. Nichols, J. Electroanal. Chem., 2015, 747, 29 CrossRef CAS.
- C. M. A. Brett and A. M. C. F. Oliveira Brett, J. Electroanal. Chem., 1989, 262, 83 CrossRef CAS.
- C. M. A. Brett, J. L. F. C. Lima and M. B. Q. Garcia, Analyst, 1994, 119, 1229 RSC.
- J. C. Ball, J. A. Cooper and R. G. Compton, J. Electroanal. Chem., 1997, 435, 229 CrossRef CAS.
- J. Davis, M. F. Cardosi, I. Brown, M. J. Hetheridge and R. G. Compton, Anal. Lett., 2001, 34, 2375 CrossRef CAS.
- B. Feier, D. Floner, C. Cristea, E. Bodoki, R. Sandulescu and F. Geneste, Talanta, 2012, 98, 152 CrossRef CAS PubMed.
- R. Nasraoui, D. Floner and F. Geneste, J. Electroanal. Chem., 2009, 629, 30 CrossRef CAS.
- R. Nasraoui, D. Floner and F. Geneste, Electrochem. Commun., 2010, 12, 98 CrossRef CAS.
- B. Feier, D. Floner, C. Cristea, R. Sandulescu and F. Geneste, Electrochem. Commun., 2013, 31, 13 CrossRef CAS.
- R. Nasraoui, D. Floner, C. Paul-Roth and F. Geneste, J. Electroanal. Chem., 2010, 638, 9 CrossRef CAS.
- Y. Zhang, J. Zhang, Y. Liu, H. Huang and Z. Kang, Mater. Res. Bull., 2012, 47, 1034 CrossRef CAS.
- D. Li, J. Li, X. Jia and E. Wang, Electrochem. Commun., 2014, 42, 30 CrossRef CAS.
- L. Bouabdalaoui, B. Le Ouay, T. Coradin and C. Laberty-Robert, Int. J. Electrochem., 2015, 890425 Search PubMed.
- A. M. Demkin, J. Anal. Chem., 2006, 61, 153 CrossRef CAS.
- U. Eisner and H. B. Mark, J. Electroanal. Chem., 1970, 24, 345 CAS.
- S. P. Perone, Anal. Chem., 1963, 35, 2091 CrossRef CAS.
- R. Pribil and M. Stulikova, Talanta, 1987, 34, 705 CrossRef CAS PubMed.
- J. W. Dilleen, S. D. Sprules, B. J. Birch and B. G. D. Haggett, Analyst, 1998, 123, 2905 RSC.
- F. Wantz, C. E. Banks and R. G. Compton, Electroanalysis, 2005, 17, 655 CrossRef CAS.
- J. Wang, J. Lu and P. A. M. Farias, Anal. Chim. Acta, 1996, 318, 151 CrossRef CAS.
- D. E. Schildkraut, P. T. Dao, J. P. Twist, A. T. Davis and K. A. Robillard, Environ. Toxicol. Chem., 1998, 17, 642 CrossRef CAS.
- A. J. Saterlay, F. Marken, J. S. Foord and R. G. Compton, Talanta, 2000, 53, 403 CrossRef CAS PubMed.
- K. Kinoshita and S. Leach, J. Electrochem. Soc., 1982, 129, 1993 CrossRef CAS.
- Metrohm Application Bulletin No. 207/2e.
- J. Mocak, A. M. Bond, S. Mitchell and G. Scollary, Pure Appl. Chem., 1997, 69, 297 CrossRef CAS.
- M. V. Stackelberg, M. Pilgram and V. Toome, Z. Elektrochem., 1953, 57, 342 CAS.
- R. G. Compton and C. E. Banks, Understanding Voltammetry, Imperial College Press, London, 2nd edn, 2011 Search PubMed.
Footnote |
| † Electronic supplementary information (ESI) available. See DOI: 10.1039/c6an00590j |
| This journal is © The Royal Society of Chemistry 2016 |

