 Open Access Article
Creative Commons Attribution 3.0 Unported Licence
Exploring the effect of laser excitation wavelength on signal recovery with deep tissue transmission Raman spectroscopy†
Adrian
Ghita
a,
Pavel
Matousek
*b and
Nicholas
Stone
*a
aSchool of Physics and Astronomy, University of Exeter, Streatham Campus, EX4 4QL, Exeter, UK. E-mail: nick.stone@exeter.ac.uk
bCentral Laser Facility, Research Complex at Harwell, STFC Rutherford Appleton Laboratory, OX11 0QX, UK. E-mail: pavel.matousek@stfc.ac.uk
First published on 27th July 2016
Abstract
The aim of this research was to find the optimal Raman excitation wavelength to attain the largest possible sensitivity in deep Raman spectroscopy of breast tissue. This involved careful consideration of factors such as tissue absorption, scattering, fluorescence and instrument response function. The study examined the tissue absorption profile combined with Raman scattering and detection sensitivity at seven different, laser excitation wavelengths in the near infrared region of the spectrum. Several key scenarios in regards to the sample position within the tissue were examined. The highest Raman band visibility over the background ratio in respect to biological tissue provides the necessary information for determining the optimum laser excitation wavelength for deep tissue analysis using transmission Raman spectroscopy, including detection of breast calcifications. For thick tissues with a mix of protein and fat, such as breast tissue, 790–810 nm is concluded to be the optimum excitation wavelength for deep Raman measurements.
Introduction
Breast cancer represents the most common form of malignancy among women worldwide, with more than half a million killed by the disease in 2011.1 For early detection of breast cancers, many national and local healthcare providers have implemented population-screening programs using a standard mammographic X-ray imaging technique. The purpose of the screening programs is to detect breast calcifications and densities, which can be associated with the presence of malignancy. Screening detects around 18![[thin space (1/6-em)]](https://www.rsc.org/images/entities/char_2009.gif) 000 cancers per year in the UK out of the 48
000 cancers per year in the UK out of the 48![[thin space (1/6-em)]](https://www.rsc.org/images/entities/char_2009.gif) 000 diagnosed.2 Despite this success, mammographic imaging lacks the chemical specificity to establish the true nature of the calcifications identified, to assist in classification of benign or malignant types. Furthermore, the sensitivity of mammography is reduced in dense breasts, presenting a serious problem for those individuals with higher breast density; especially the case among younger women.3,4 In the absence of an effective chemical method to provide a definitive answer, the patient undergoes a biopsy followed by histopathological examination to declare the final diagnosis. The procedure involves considerable time delays that can cause substantial anxiety for the patient and puts considerable burden on health service resources.
000 diagnosed.2 Despite this success, mammographic imaging lacks the chemical specificity to establish the true nature of the calcifications identified, to assist in classification of benign or malignant types. Furthermore, the sensitivity of mammography is reduced in dense breasts, presenting a serious problem for those individuals with higher breast density; especially the case among younger women.3,4 In the absence of an effective chemical method to provide a definitive answer, the patient undergoes a biopsy followed by histopathological examination to declare the final diagnosis. The procedure involves considerable time delays that can cause substantial anxiety for the patient and puts considerable burden on health service resources.
Light interaction with biological tissue can result in absorption, scattering, reflection and refraction. Each one of these phenomena can be utilised to obtain morphological or chemical information about the tissue structures. Recently, several optical methods have been proposed for tissue imaging. Optical coherence tomography is one example and is based on light scattering and reflection to produce micrometre-resolution images of tissue structures.5 Another method, photo-acoustic tomography proposed for in vivo tissue imaging, uses the sound-waves generated by the rapid local heating in the tissue from the laser absorption. This method takes advantage of the strong absorption of haemoglobin in the NIR domain to generate high contrast images. Thus strong vascularised structures like malignant formations are easier to detect inside biological tissue.6 Another method, diffuse optical imaging, exploits the changes of the transmitted ballistic photon inside breast tissues.7,8 Despite the fact that all these methods can bring major improvement in medical imaging, they suffer from delivering limited chemical information required for complete diagnosis of many abnormalities observed.
There have been early studies using X-ray diffraction9–11 performed on breast tissue sections that have revealed different crystalline structures of calcifications, namely the presence of calcium oxalate and carbonated hydroxyapatite. Furthermore, the chemical composition of these structures is correlated with benign or malignant types of associated lesions inside breast tissue.10 However, practical implementation of an in vivo XRD approach is difficult (and uses potentially harmful ionising radiation).
Raman spectroscopy is an analytical technique based on inelastic scattering of light by the sample molecule and provides rich chemical information. The idea of using Raman spectroscopy for biomedical applications has gained considerable attraction in the last 25 years12 with recent advances in instrumental performance and associated detection sensitivity.13–15 Raman spectroscopy combined with optical microscopy has opened the door to automated clinical classification methods based on chemical specificity of tissue sections.16 It can be envisaged as an objective pathological tool to discriminate between tissue sections,17–23 or tissue regions within the same tissue section by using spectral analysis methods based on multivariate processing methods.
Raman spectroscopy represents a very versatile tool as it can be incorporated into an endoscopic probe to provide easy access to certain biological sites24 or in a hypodermic needle to identify abnormalities within the injection sites.25 Although, fibre probes have the potential to probe both the surface of organs and small tissue volumes, when inserted interstitially, they are invasive and not suitable for examining large volumes of tissues within solid organs such as in the breast and prostate.
Application of Raman spectroscopy to large volumes in biological samples requires an in-depth understanding of the complexity of absorption and scattering phenomena encountered when light travels inside a highly heterogeneous matrix such as breast tissue. The photons travelling inside the tissue are undergoing multiple scattering processes due to huge variation in the optical properties between tissue regions, biological cells and cell organelles. The multiple scattering events experienced by the laser and Raman photons impede conventional optical imaging and can severely hamper the detection efficiency of Raman system.
In addition, absorption events even at a wavelength where tissue absorption is minimised, become very important when dealing with large tissue samples. Previous Raman spectroscopy measurements in turbid media have shown a strong influence from the absorption coefficient [μa], a drop in the signal being linearly proportional to 1/μa.26 Consequently, the laser penetration depth is dependent on the wavelength and heavily influenced by the absorption profile of specific sample. Moreover, the fluorescence caused by the various chromophores located inside human tissue can, in some situations, overwhelm the entire Raman spectrum. One potential solution to avoid fluorescence and retrieve Raman signals from deeper layers is the use of the picosecond Kerr gating technique. Using this approach, Raman signals from calcifications have been retrieved from depths of 0.9 mm in biological tissue.27 However, since the application itself, utilises high power pulsed lasers, the suitability for in vivo application raises questions due to prohibitive costs and laser safety concerns.
A considerably simpler alternative to Kerr gating is to recover the Raman spectra from depth by spatial offset Raman spectroscopy (SORS). This approach involves illuminating the sample surface at one point and collecting the Raman signal at different spatially offset locations. It provides a high degree of flexibility as it can probe different depths within the sample just by adjusting the distance between illumination and collection points.28 In the inverse SORS configuration, a ring illumination is designed with the collection point in the centre of the circle.29 What is appealing about this approach is the facility to accommodate higher laser powers within the safety limits since the laser light can be spread over the area of the illumination ring, opening the door to the possibility of in vivo application of SORS. The SORS configuration can be used to probe tumours as demonstrated in detecting calcium oxalate and hydroxyapatite inside chicken breast30 or profile tumour margins of breast tissue sample with 95% and 100% specificity.31 Despite the numerous advantages of the SORS configuration, the highest penetration depth reported inside biological tissue is around 10 mm,32 well below the desired tissue penetration depth (order of 40–50 mm).
Probing Raman at a deeper level inside large diffusely scattering samples has been facilitated using transmission Raman geometries with non-biological samples in quality control on pharmaceutical manufacture31 or security.33 The set-up of Transmission Raman spectroscopy is relatively simple and versatile, dating from the very beginning of the Raman spectroscopy.34 Therefore, it seems reasonable to consider the concept of Transmission Raman spectroscopy for clinical applications in vivo. The non-invasive approach of Raman spectroscopy without the need of sample preparation represents a promising tool for deep tissue detection of breast calcifications, which can be deployed as a complementary technique to standard mammographic screening. The Raman spectra of calcium oxalate (type I calcifications) and hydroxyapatite (type II calcifications) possess strong sharp features and can be easily distinguished from the surrounding Raman bands of biological tissue.35 This strong contrast can be exploited for detection and typing of breast calcifications on a reliable basis. The proof of principle of this concept was demonstrated earlier35 when Raman signals from hydroxyapatite powder were recovered from a 26 mm thick block of porcine tissue. Although the results are promising, further developments are required for Raman signal acquisition from within tissues as thick as 50 mm. Deep Raman spectroscopy has been applied as a tomographic configuration for in vitro imaging of canine bone36 and in vivo imaging of rat bone37 or through fibre probes within the surgical environment.38–40
This paper discusses the optimisation of a deep Raman system by analysing the signal to noise ratio obtained at several representative laser wavelengths within the NIR spectral domain. The main aim was to identify the optimum Raman excitation wavelength to inform the next-stage development of high sensitivity Raman platform for achieving scanning depths of 4–5 cm with clinically relevant calcification concentrations in breast tissue in vivo.
Experimental
Samples
The breast tissue phantoms used in this study were made of porcine shoulder tissues. These contained skin, fat and muscle replicating much of the gross chemical composition of human breast tissue. The tissue samples were purchased fresh from a local supermarket and sliced to a thickness of around 35 mm × 80 mm × 60 mm (precision of ±3 mm). A quartz optical vial (dimensions 37 × 12 × 3 mm) filled with trans-stilbene [tS] was used as an inorganic marker to simulate distinct breast calcification signals.Transmission Raman instrument
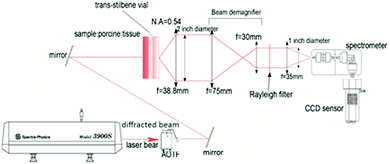
The schematics of the transmission Raman set-up is presented in Fig. 1. The laser used in these experiments was a tuneable Ti:Sapphire laser 3900S (Newport Spectra Physics, Santa Clara, US) pumped by a 532 nm Finesse (Laser Quantum, Stockport, UK). To clean up the laser line spectrally from spurious amplified spontaneous emission a NIR acousto-optic tuneable filter (AOTF) was used (Gooch & Housego, Ilminster, UK). After passing through the AOTF, the laser light was delivered to the sample with a spot size of 2 mm. The Raman signal was collected on the other side of the sample with a 50 mm diameter biconvex collection lens with 38.4 mm focal length (N.A. = 0.7). A de-magnifying optical train was used to match the light path to the available 25 mm diameter filters used for removing elastically scattered light.Three edge filters were used for different laser excitation wavelengths as follows: a 785 nm filter (BLP01-785R-25, Semrock, Rochester, US) for 770 nm, 780 nm and 790 nm; an 808 nm filter (BLP01-808R-25, Semrock, Rochester, US) for 800 nm and 810 nm; and an 830 nm filter (LP02-830RU-25, Semrock, Rochester, US) for 820 nm and 830 nm.
Finally, an imaging lens channelled the collected Raman photons into a dispersive spectrometer (Holospec f/1.8 Kaiser Optical, Michigan, US). The spectrometer was equipped with a fixed custom-made transmission diffraction grating covering a spectral range from 700 nm to 1100 nm. The spectrometer was coupled to a deep depletion NIR CCD detector (Andor iDus 420, Oxford Instruments, Belfast, UK). The large spectral range of the detection system enabled rapid switching between laser excitation wavelengths and recording the corresponding Raman fingerprints without a recourse to a major change in the setup. The estimated spectral resolution of the system, using the atomic lines of the Ocean Optics calibration source was around 12 cm−1. The instrument response function of the system was obtained using an HL-2000 (Ocean Optic) white light source. The instrument response function was measured separately for each long pass filter used in the Raman measurements and includes also intermediary optics.
Experimental methods
The attenuation profile of the phantom tissue was calculated as the logarithm of the ratio between input light intensity and output light intensity of spectrally dispersed light. The relative light intensity was estimated based on the number of counts recorded by the CCD detector after subtracting the dark noise.The detection efficiency of subsurface signals was measured at seven different wavelengths in the range from 770 nm to 830 nm. The spectra were acquired in kinetic mode in five sets of measurements with 40 s used for each acquisition. The laser power, measured with the power meter after the AOTF filter was maintained constant at 200 mW at all excitation wavelengths (the variation of number of photons between 770 nm and 880 nm for the same laser power is around 8% and as such this difference was neglected in subsequent analysis considering the magnitude of other effects present).
Regarding the Raman experiments, we have selected three measurement scenarios taking into account key possible locations of breast calcifications within living tissue in respect to illumination in transmission set-up. A trans-stilbene (tS) vial was placed on front (laser illumination side), middle (inside) and back (collection side) of the phantom tissue. trans-Stilbene has a higher Raman scattering cross-section, when compared to calcium oxalate and hydroxyapatite, although it has similar optical properties, thus it provides stronger Raman features with sufficient signal to noise ratios avoiding the interference from artefacts in the background analysis that are easily detectable at all vial positions using our setup.30 The laser illumination position was maintained throughout the vial repositioning and for all excitation wavelengths.
Data analysis
The recorded Raman spectra were imported into Matlab for data pre-processing, which consisted of cosmic background removal and detector intensity offset removal. The ‘peak visibility’ was defined as the ratio between Raman peak height and the average level of background noise adjacent to the Raman peak, with the background noise level estimated as a square root of detected photoelectrons (after appropriate conversion from CCD counts to photoelectron counts). The peak height was calculated using Gaussian peak fitting in Origin (Originlab, Massachusetts, US) after subtracting the local background.Results and discussion
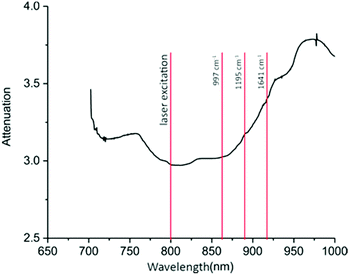
Fig. 2 presents the attenuation profile of a breast phantom (porcine tissues) measured using a broad band source, coupled to the collection optics used in Raman measurements. The shorter dimension represents the optical axis in these experiments and the other dimensions provide semi-infinite boundaries for the light, thus minimising errors due to losses. The sample had the same dimensions and composition to the one used in the Raman measurements, consisting of skin, fat and protein rich muscle. The attenuation profile is very informative because it indicates the regions with high attenuation which needs to be avoided by both laser and Raman photon wavelengths to minimise photon losses. The spectral region of minimum absorption is located in the region between 790 and 830 nm, followed by a plateau up to 860 nm and then a steep slope at around 930 nm.The relative difference in attenuations between the lowest and highest values is about 30%. Therefore, based on the attenuation profile, we have chosen to explore in detail the laser excitation wavelengths in the spectral region between 770 nm and 830 nm.
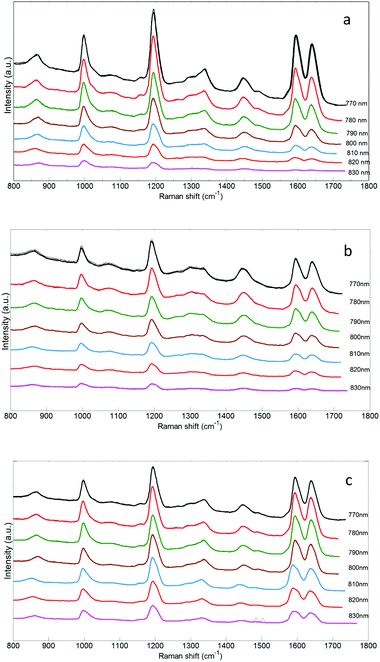
trans-Stilbene [tS] was selected as a local Raman scattering source for placement at different locations in the tissue phantom. It exhibits stronger Raman scattering compared with hydroxyapatite providing an easier medium to assess the influence of laser excitation wavelength on the quality of Raman signals. It also provides a convenient surrogate for HAP as its main Raman band is close to the phosphate band of hydroxyapatite (∼960 cm−1). The results of the Raman measurements of the tS inside the porcine tissue are presented in Fig. 2 for each of three locations in the sample. One can recognize the strong Raman bands of the tS at 997 cm−1 corresponding to ring deformation and C–H deformation at 1195 cm−1.41 The double peak recorded at 1594 cm−1 and 1641 cm−1 belongs to the ring stretching of the aromatic structure.41 Biological spectral signatures are represented by the C–H peak between 1420 cm−1 and 1480 cm−1 assigned to protein and lipid structures present in the sample42 as well as a broad peak of the proteins around 1342 cm−1. Three Raman peaks of the trans-stilbene: 997 cm−1, 1195 cm−1 and 1641 cm−1 were analysed and compared to the background. By choosing more than one peak, we could monitor the spectral changes of the peaks throughout the fingerprint region. The contrast between organic and inorganic structures is very pronounced and helps enable accurate peak analysis of the trans-stilbene signal penetration.
The inorganic tS vial was placed at three positions in the sample: between the laser and sample; in the middle of the sample; between the sample and the collection optics.
The evolution observed in the Raman bands in Fig. 3 is associated with the different interaction of laser photons with tissue sample molecules in combination with changes in the sensitivity of the spectrometer system to the Raman photons at various wavelengths. Furthermore, the vial location within the tissue also influences the detection of the trans-stilbene peaks. Also readily noticeable is the absence of the double peaks for the 830 nm excitation when the vial is situated in front of the tissue on the illumination side.
When the sample is placed in the middle of the tissue phantom the peaks become more prominent, as the sample is moved towards the back of the sample on the detection side the peaks are completely distinguishable. An explanation in the difference observed between these three situations may be found in the attenuation profile (Fig. 2). Because no changes to the set-up have been made except the vial position, it is the only parameter that can influence the Raman band heights. When the sample is placed in front of the tissue the tS Raman photons are travelling through the tissue towards the detection side. The corresponding wavelength positions of the Raman tS bands at 1594 cm−1 and 1641 cm−1 for 830 nm excitation wavelength are 956 nm and 961 nm; these are well located in the high attenuation region of the porcine tissue (Fig. 2).
According to the Beer Lambert law, the absorption increases with the length of sample that light passes through. Therefore, when the vial in located in the middle the Raman photons have less distance to travel through the tissue to reach the collection side and this leads to lower losses and thus higher numbers of Raman photons collected. Obviously when the vial is placed at the back of the sample (collection side), the Raman photons travel immediately into free space and the collection optics before being detected by the spectrometer, thus not incurring any associated tissue attenuation of the Raman photons.
The tS vial positions in respect to tissue location represents extreme examples of the measurements situations of the Raman signal sources within tissues, and enable us to assess the most representative situations relevant to measuring breast calcification in tissue.
The measurements obtained at different excitation laser wavelengths when the vial is maintained at the same position, reveal a striking contrast in peak height evolution between 770 nm and 830 nm laser excitation wavelengths (Fig. 3). The influence of excitation laser wavelength on the Raman signal it is well known in the scientific community and documented.43–45 In reality the spectra are influenced not only by the laser wavelengths used, but also the transmission profile of the intermediary optics and diffraction grating, as well as the quantum efficiency of the CCD detector. The spectral region for Raman detection ranges from 834 nm to 960 nm depending on the laser wavelength and the Raman bands are located on the descending slope of the quantum efficiency curve of the CCD detector.
That means that detection sensitivity decreases towards longer excitation wavelength (see ESI Fig. S1†). The corresponding wavelengths of the tS double peaks for the 770 nm excitation wavelength are 874 nm and 881 nm, and are situated on the lower attenuation region compared to the same Raman peaks when using 830 nm excitation (956 nm and 961 nm). In addition to the absorption and the detection efficiency dependencies on wavelength, the Raman scattering cross-section is also dependent on the laser excitation wavelength, proportional to 1/λ4.
For a clear understanding of the influence of the laser wavelength on the sensitivity of the detection of Raman bands we have calculated peak visibility for all three tS peaks. The peak visibility describes the prominence of Raman bands above the noise level in the background. Fig. 4 illustrates the average values of the peak visibility for each sample position corresponding to the selected trans-stilbene peaks plotted against laser wavelengths. The plots provide a clear picture of the key parameters of the experiment enabling an advanced understanding of the effects of the competing factors combining to provide an indicator for the optimum laser wavelength. One can notice a variety of profile trends in each plot and for each peak individually. Overall the 997 cm−1 peaks tends to have a smoother evolution compared to the other tS peaks with a maximum signal reached in the region between 790 nm and 810 nm. The Raman band at 997 cm−1 is close to the peak positions for calcium oxalate, 945 cm−1 and calcium phosphate 960 cm−1, so it may suitable to choose a laser in this spectral region.
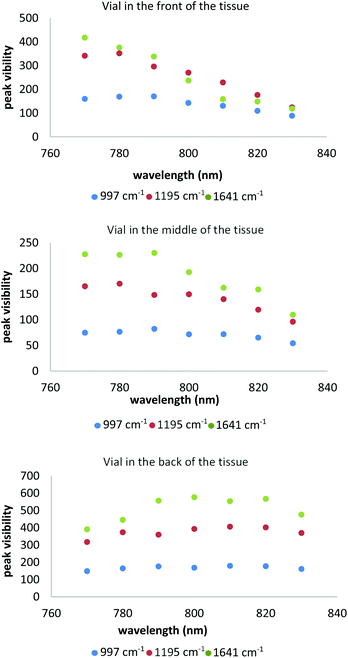 | ||
| Fig. 4 Peak visibility of the trans-stilbene peaks for the all scenarios of the measurements. Five replicates of each measurement. | ||
The other peaks of trans-stilbene indicated distinct behaviours for each measurement scenario. For the vial located at the front of the tissue phantom, the peak visibility decreases very steeply towards longer wavelengths. The vial placed in the middle presents a different picture with 1192 cm−1 for which the peak visibility increases up to 780 nm followed by a steep profile decrease. The peak at 1641 cm−1 (at a similar spectral position to Amide I peaks in tissues) indicates a similar profile with an increase up to 790 nm. The last measurement set-up when the vial is moved towards the back of the tissue presents a fairly smooth profile for the 1195 cm−1 peak with a dip at 790 nm and a peak around 810 nm. The profile of the 1641 cm−1 has a more obvious drop off, following an increase in peak visibility up to 800 nm, a small dip at 810 nm followed by a decrease at 830 nm.
To gain insight into the origin of these dependencies we have performed a more detailed qualitative analysis of the Raman peaks and background noise level independently. Fig. 4 depicts the Raman peak heights while Fig. S2 (see ESI†) presents the corresponding background noise level plots used for peak visibility calculations. What is interesting about background noise profiles is that there is a little difference between measurements (except Fig. S3c†), the trend of the auto-fluorescence background noise level seems quite linear regardless of the laser wavelengths. The decreasing profile observed could be explained by the reduced sensitivity of the CCD detector towards longer wavelengths.
The Raman peak height (see Fig. 5) indicates the presence of a trend with excitation wavelength, which was less obvious in Fig. 4. The overall tendency for each peak height, in the range of excitations 800–830 nm, is to decrease towards the longer wavelength regardless of measurement configurations. Instead we recognize a plateau shape for 997 cm−1 peak height profile for the laser wavelengths 770 nm, 780 nm and 790 nm which is difficult to explain since we are expecting a continuous drop in peak height due decrease in signal to Raman scattering cross-section and detector quantum efficiency.
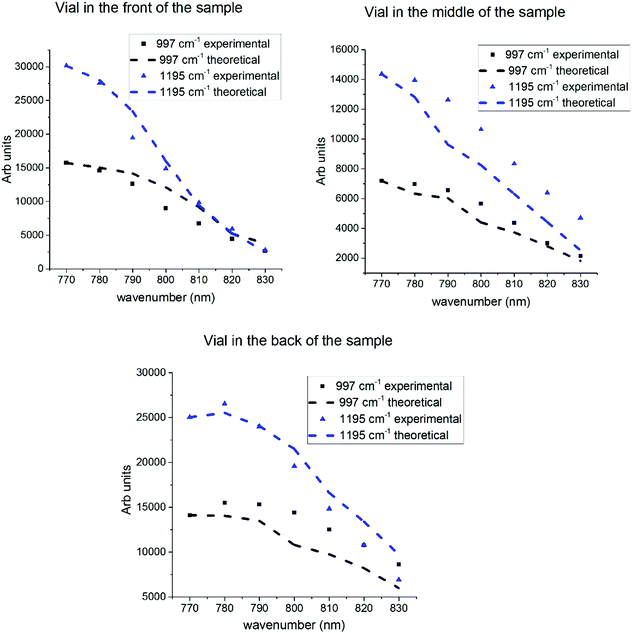 | ||
| Fig. 5 Experimental Raman peak height vs. laser wavelength for each position of the vial [left hand side] inside the tissue along their theoretical predictions of Raman peak height (right hand side). | ||
To have a better understanding of the nature of the plateau shape observed in the plots, we have construct a theoretical model (eqn (1)) which accounts for a combination of attenuation profile (A), Raman differential scattering cross section (dσ/dΩ), instrument response function (R), (symbol “×” represents multiplication):
| F = dσ/dΩ×A×R | (1) |
We made an assumption that each of these factors will modify the values of the recorded Raman bands by a scaling parameter according to each measurement situation. The total outcome of the model will be a product of these scaling parameters that can be applied to the recorded data. For example when the vial is located in front of the tissue the model will include the scattering cross-section, instrument response function and absorption of the Raman photons inside the tissue, since the laser photons are travelling only in free space prior to interacting with the tS. The model changes with vial locations towards the back of the tissue, where the attenuation of the laser light is more important than the attenuation of Raman photons. The vial in the middle of the sample model incorporates both the laser light attenuation and Raman photon losses. This time the laser photons will be absorbed and Raman photons are modelled to travel half distance than at extreme positions. Fig. 6 presents the plots of the two (997 cm−1 and 1195 cm−1) measured Raman peak intensities alongside with the computed Raman peak values obtained from our model overlap in the same plot. For the detailed picture of the peak comparison experimental vs. simulated the reader should address the Fig. S5 in ESI.† Overall the simulated plots of the Raman peak intensities tend to follow the experimental data. The plot profiles change while the vial is placed at the back (Fig. 5-bottom graphs), indicating a slightly curved profile between 770 and 790 nm. This is more pronounced in our theoretical results. There is a small potential difference in the attenuation profile of the tissue phantom used Raman and separate attenuation measurements. Depending on the spectral region on the attenuation and instrument response function, as well as the vial position relative to the sample we obtain a different outcome of the Raman peak intensities.
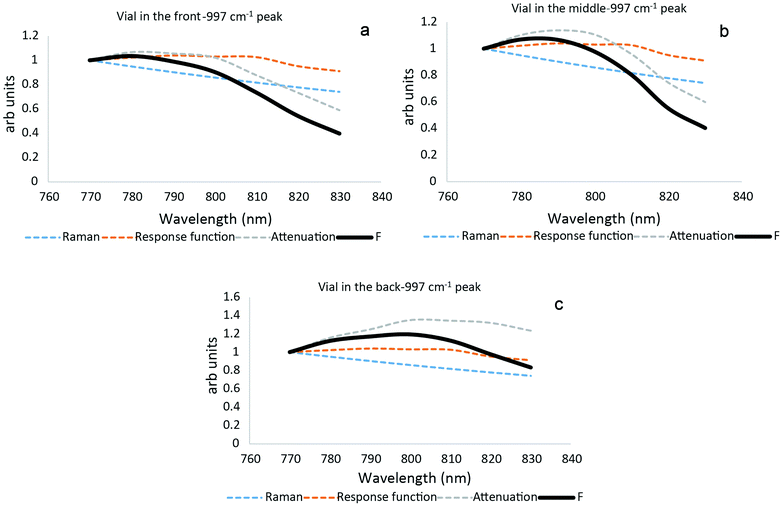 | ||
| Fig. 6 Plot of the individual parameters of the model described from eqn (1): Raman scattering cross-section, instrument's response function and tissue attenuation along with overall profile of the model (F) for each vial position front, middle and back. | ||
Overall, the simple model provides a satisfactory explanation of data measured. It is therefore viable to derive individual contributions of each individual factor to the overall model. In Fig. 6 each parameter included in the theoretical model along with the overall outcome, for peak 997 cm−1 at each one of the measurement scenarios are presented. At the first glance the total profile tends to follow the attenuation profile in most of the cases. It appears that that tissue attenuation is the dominant effect in our measurements except Fig. 6c. According to Fig. 6a and c at the laser excitation wavelengths 770, 780 and 790 nm we observe competing effects between instrument response function on one hand and tissue attenuation and Raman cross-section on the other hand. As a consequence, these effects balance the contribution of the attenuation.
For laser excitations between 800 to 830 nm all the plots seem to indicate a constant decline. We do observe some competing effects again in the Fig. 6c, the attenuation decrease presents a different evolution. The laser absorption seems to be less influential, for the 997 cm−1 peak when the sample is placed at the back, so the theoretical profile looks less steep compared to the other experimental situations. When the vial containing trans-stilbene (ts) is located at the front or in the middle of the tissue, the attenuation in the tissue tends to define the profile of the plots since it drops faster than other parameters.
Conclusions
In this paper, we explored the Raman peak visibility of a ‘foreign’ sample, mimicking breast calcifications, in transmission Raman spectroscopy located in front, middle and back of a thick porcine phantom tissue at seven different excitation wavelengths. The Raman measurements indicate the strong influence on sample position, instrument response function and laser excitation wavelength on the peak visibility. The peak visibility plots provide a comprehensive picture about detection sensitivity of the transmission Raman set-up at different wavelengths. We conclude that the optimum laser wavelength for breast calcification detection lies in the spectral region between 790 and 810 nm.Acknowledgements
An EPSRC grant (EP/K020374/1) funded the work presented here.Notes and references
- J. Ferlay, I. Soerjomataram, R. Dikshit, S. Eser, C. Mathers, M. Rebelo, D. M. Parkin, D. Forman and F. Bray, Int. J. Cancer, 2015, 136, E359–E386 CrossRef CAS PubMed.
- A. J. Murray and D. M. Davies, Surgery, 2013, 31, 1–3 Search PubMed.
- C. M. Checka, J. E. Chun, F. R. Schnabel, J. Lee and H. Toth, Am. J. Roentgenol., 2012, 198, W292–W295 CrossRef PubMed.
- D. S. Buist, P. L. Porter, C. Lehman, S. H. Taplin and E. White, J. Natl. Cancer Inst., 2004, 96, 1432–1440 CrossRef PubMed.
- J. G. Fujimoto, C. Pitris, S. A. Boppart and M. E. Brezinski, Neoplasia, 2000, 2, 9–25 CrossRef CAS PubMed.
- L. H. V. Wang and S. Hu, Science, 2012, 335, 1458–1462 CrossRef CAS PubMed.
- D. J. Hall, J. C. Hebden and D. T. Delpy, Appl. Opt., 1997, 36, 7270–7276 CrossRef CAS PubMed.
- T. Yates, J. C. Hebden, A. Gibson, N. Everdell, S. R. Arridge and M. Douek, Phys. Med. Biol., 2005, 50, 2503–2517 CrossRef PubMed.
- C. M. Busing, U. Keppler and V. Menges, Virchows Arch. A: Pathol. Anat. Histol., 1981, 393, 307–313 CrossRef.
- V. Barth, E. D. Franz and A. Scholl, Die Naturwissenschaften, 1977, 64, 278–279 CrossRef CAS PubMed.
- O. Hassler, Cancer, 1969, 23, 1103–1109 CrossRef CAS PubMed.
- G. J. Puppels, F. F. M. Demul, C. Otto, J. Greve, M. Robertnicoud, D. J. Arndtjovin and T. M. Jovin, Nature, 1990, 347, 301–303 CrossRef CAS PubMed.
- W. Kiefer and S. Schlücker, Surface enhanced Raman spectroscopy: analytical, biophysical and life science applications, John Wiley & Sons, 2011 Search PubMed.
- E. Smith and G. Dent, Modern Raman spectroscopy: a practical approach, John Wiley & Sons, 2013 Search PubMed.
- P. Vandenabeele, Practical Raman spectroscopy: an introduction, John Wiley & Sons, 2013 Search PubMed.
- J. Smith, C. Kendall, A. Sammon, J. Christie-Brown and N. Stone, Technol. Cancer Res. Treat., 2003, 2, 327–331 CrossRef CAS PubMed.
- K. Kong, C. J. Rowlands, S. Varma, W. Perkins, I. H. Leach, A. A. Koloydenko, H. C. Williams and I. Notingher, Proc. Natl. Acad. Sci. U. S. A., 2013, 110, 15189–15194 CrossRef CAS PubMed.
- M. Larraona-Puy, A. Ghita, A. Zoladek, W. Perkins, S. Varma, I. H. Leach, A. A. Koloydenko, H. Williams and I. Notingher, J. Mol. Struct., 2011, 993, 57–61 CrossRef CAS.
- C. Kendall, N. Stone, N. Shepherd, K. Geboes, B. Warren, R. Bennett and H. Barr, J. Pathol., 2003, 200, 602–609 CrossRef PubMed.
- N. Stone, P. Stavroulaki, C. Kendall, M. Birchall and H. Barr, Laryngoscope, 2000, 110, 1756–1763 CrossRef CAS PubMed.
- P. Crow, N. Stone, C. A. Kendall, J. S. Uff, J. A. M. Farmer, H. Barr and M. P. J. Wright, Br. J. Cancer, 2003, 89, 106–108 CrossRef CAS PubMed.
- K. Kong, C. Kendall, N. Stone and I. Notingher, Adv. Drug Delivery Rev., 2015, 89, 121–134 CrossRef CAS PubMed.
- A. S. Haka, K. E. Shafer-Peltier, M. Fitzmaurice, J. Crowe, R. R. Dasari and M. S. Feld, Proc. Natl. Acad. Sci. U. S. A., 2005, 102, 12371–12376 CrossRef CAS PubMed.
- J. C. C. Day and N. Stone, Appl. Spectrosc., 2013, 67, 349–354 CrossRef CAS PubMed.
- J. C. C. Day, R. Bennett, B. Smith, C. Kendall, J. Hutchings, G. M. Meaden, C. Born, S. Yu and N. Stone, Phys. Med. Biol., 2009, 54, 7077–7087 CrossRef CAS PubMed.
- C. Reble, I. Gersonde, S. Andree, H. J. Eichler and J. Helfmann, J. Biomed. Opt., 2010, 15, 037016 CrossRef PubMed.
- R. Baker, P. Matousek, K. L. Ronayne, A. W. Parker, K. Rogers and N. Stone, Analyst, 2007, 132, 48–53 RSC.
- P. Matousek, I. P. Clark, E. R. C. Draper, M. D. Morris, A. E. Goodship, N. Everall, M. Towrie, W. F. Finney and A. W. Parker, Appl. Spectrosc., 2005, 59, 393–400 CrossRef CAS PubMed.
- P. Matousek, Appl. Spectrosc., 2006, 60, 1341–1347 CrossRef CAS PubMed.
- P. Matousek, Chem. Soc. Rev., 2007, 36, 1292–1304 RSC.
- P. Matousek and A. W. Parker, Appl. Spectrosc., 2006, 60, 1353–1357 CrossRef CAS PubMed.
- P. Matousek and N. Stone, J. Biomed. Opt., 2007, 12, 024008 CrossRef PubMed.
- C. Eliasson, N. A. Macleod and P. Matousek, Anal. Chem., 2007, 79, 8185–8189 CrossRef CAS PubMed.
- C. V. Raman and K. S. Krishnan, Nature, 1928, 121, 501–502 CrossRef CAS.
- N. Stone and P. Matousek, Cancer Res., 2008, 68, 4424–4430 CrossRef CAS PubMed.
- M. V. Schulmerich, J. H. Cole, K. A. Dooley, M. D. Morris, J. M. Kreider, S. A. Goldstein, S. Srinivasan and B. W. Pogue, J. Biomed. Opt., 2008, 13, 020506 CrossRef PubMed.
- J. L. H. Demers, F. W. L. Esmonde-White, K. A. Esmonde-White, M. D. Morris and B. W. Pogue, Biomed. Opt. Express, 2015, 6, 793–806 CrossRef PubMed.
- E. M. Kanter, E. Vargis, S. Majumder, M. D. Keller, E. Woeste, G. G. Rao and A. Mahadevan-Jansen, J. Biophotonics, 2009, 2, 81–90 CrossRef CAS PubMed.
- A. S. Haka, Z. Volynskaya, J. A. Gardecki, J. Nazemi, R. Shenk, N. Wang, R. R. Dasari, M. Fitzmaurice and M. S. Feld, J. Biomed. Opt., 2009, 14, 054023 CrossRef PubMed.
- A. S. Haka, Z. Volynskaya, J. A. Gardecki, J. Nazemi, J. Lyons, D. Hicks, M. Fitzmaurice, R. R. Dasari, J. P. Crowe and M. S. Feld, Cancer Res., 2006, 66, 3317–3322 CrossRef CAS PubMed.
- Z. Meic and H. Gusten, Spectrochim. Acta, Part A, 1978, 34, 101–111 CrossRef.
- A. T. Tu, Raman spectroscopy in biology: principles and applications, Wiley, 1982 Search PubMed.
- R. Li, D. Verreault, A. Payne, C. L. Hitchcock, S. P. Povoski, E. W. Martin and H. C. Allen, J. Raman Spectrosc., 2014, 45, 773–780 CrossRef CAS.
- C. J. Frank, D. C. B. Redd, T. S. Gansler and R. L. Mccreery, Anal. Chem., 1994, 66, 319–326 CrossRef CAS PubMed.
- N. Stone, Raman spectroscopy of biological tissue for application in optical diagnosis of malignancy, PhD thesis, Cranfield University, 2001 Search PubMed.
Footnote |
| † Electronic supplementary information (ESI) available. See DOI: 10.1039/c6an00490c |
| This journal is © The Royal Society of Chemistry 2016 |

